. 2015 Jan 22:5:7949.
doi: 10.1038/srep07949.

An integrated phylogenomic approach toward pinpointing the origin of mitochondria

Affiliations

An integrated phylogenomic approach toward pinpointing the origin of mitochondria

Zhang Wang et al. Sci Rep. .

Abstract

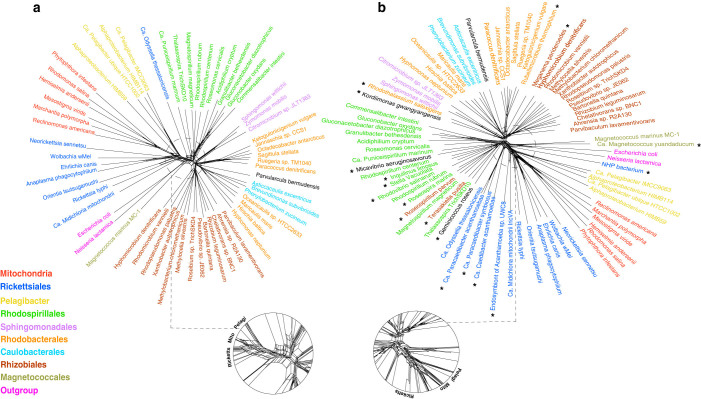
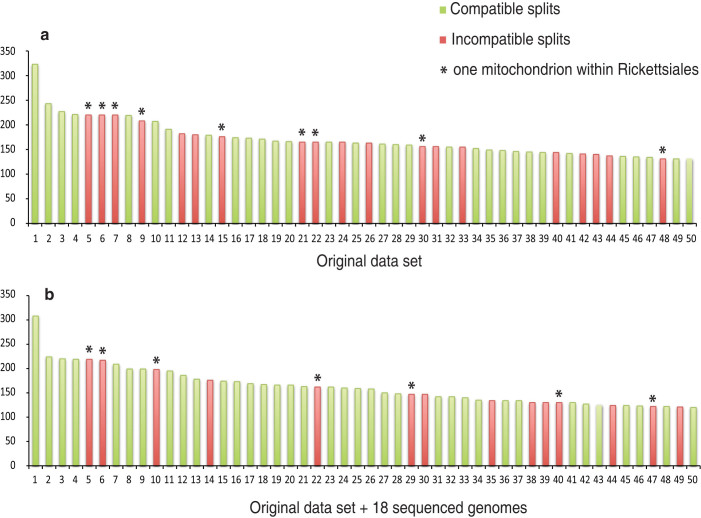
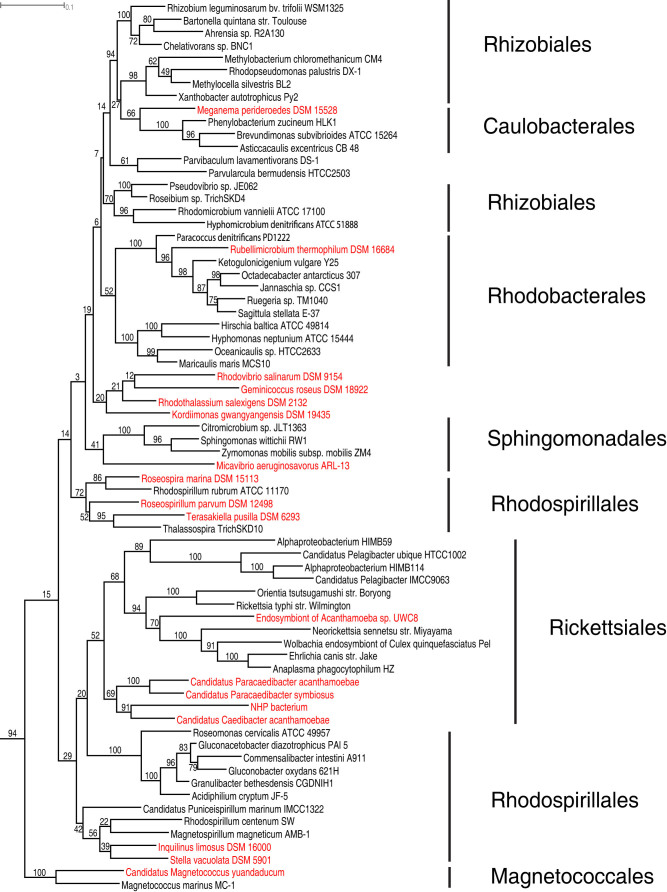
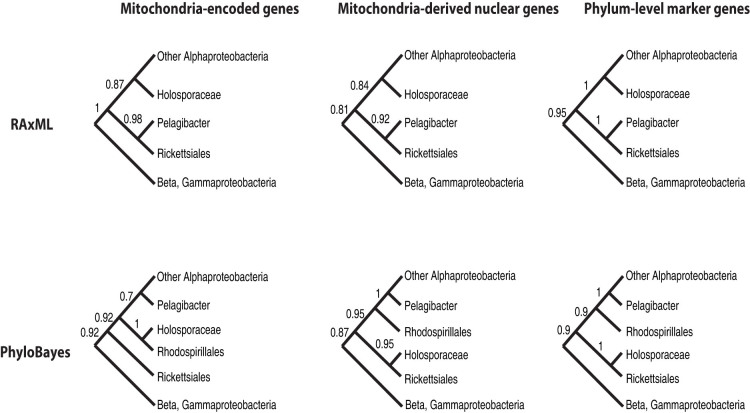
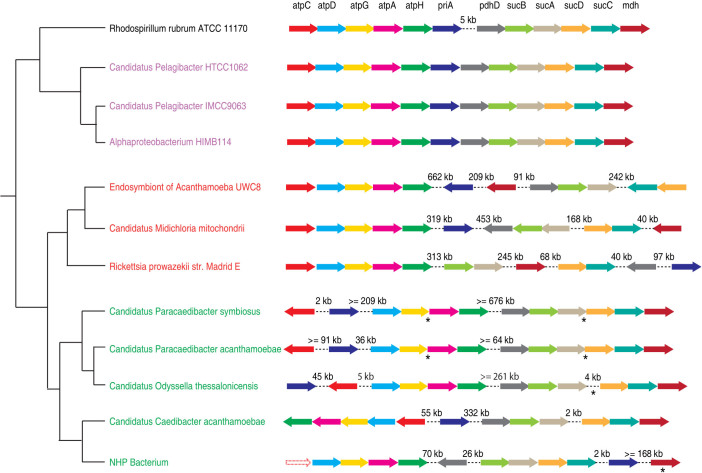
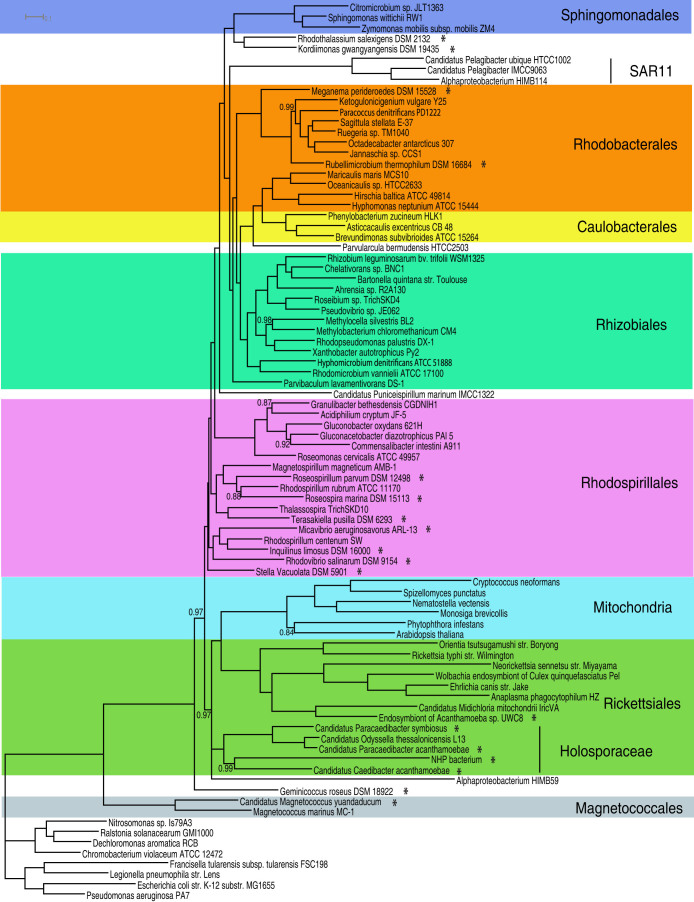
Overwhelming evidence supports the endosymbiosis theory that mitochondria originated once from the Alphaproteobacteria. However, its exact position in the tree of life remains highly debated. This is because systematic errors, including biased taxonomic sampling, high evolutionary rates and sequence composition bias have long plagued the mitochondrial phylogenetics. In this study, we address this issue by 1) increasing the taxonomic representation of alphaproteobacterial genomes by sequencing 18 phylogenetically novel species. They include 5 Rickettsiales and 4 Rhodospirillales, two orders that have shown close affiliations with mitochondria previously, 2) using a set of 29 slowly evolving mitochondria-derived nuclear genes that are less biased than mitochondria-encoded genes as the alternative "well behaved" markers for phylogenetic analysis, 3) applying site heterogeneous mixture models that account for the sequence composition bias. With the integrated phylogenomic approach, we are able to for the first time place mitochondria unequivocally within the Rickettsiales order, as a sister clade to the Rickettsiaceae and Anaplasmataceae families, all subtended by the Holosporaceae family. Our results suggest that mitochondria most likely originated from a Rickettsiales endosymbiont already residing in the host, but not from the distantly related free-living Pelagibacter and Rhodospirillales.


Figures

Figure 1
Figure 1. Rooted genome trees of Alphaproteobacteria and mitochondria represented by NeighborNet graphs.
a) Original dataset. b) Original dataset + 18 newly sequenced genomes in this study (denoted with asterisks). Conflicting signal is represented by the network in the graph. The tree is rooted using Beta and Gammaproteobacteria as the outgroup.
Figure 2
Figure 2. Split spectrum of the concatenated alignment of 26 mitochondria-encoded genes for a) the original dataset, b) the original dataset plus 18 genomes sequenced in this study.
Each bar represents a split and the height of bar (Y-axis) is the number of sites in the alignment supporting the split. The splits were ranked by their support and only the top 50 splits are shown. The splits were considered as compatible or incompatible by reconciling with well established phylogenetic relationships such as the monophyly of mitochondria or Rickettsiales. Compatible splits are in green and incompatible splits are in red. Asterisks indicate conflicting splits where a single mitochondrial species is placed within the Rickettsiales order.
Figure 3
Figure 3. A rooted SSU rRNA maximum likelihood tree of alphaproteobacterial representatives using RAxML.
Highlighted in red are the 18 isolates selected for sequencing in this study. The tree was rooted using Beta and Gammaproteobacteria as the outgroup. Bootstrap values (out of 100 replicates) are shown.
Figure 4
Figure 4. Schematic phylogenetic trees based on the mitochondrial, nuclear and phylum-level marker datasets and reconstructed using RAxML and PhyloBayes.
Bootstrap values (for RAxML trees) and posterior probability values (for PhyloBayes trees) for internal nodes are shown beside them.
Figure 5
Figure 5. The gene orders of a gene cluster of 12 protein-coding genes in Rickettsiales (red), Holosporaceae (green), the SAR11 group (purple) and the free-living Rhodospirillum rubrum (black).
Each arrow represents a gene in the cluster. Arrows with dotted lines represent a missing gene. Genome rearrangements are shown as dotted lines between two genes, with the distance between them shown above the lines. Because of the incomplete nature of some genome assemblies, the exact distance between two genes could not be determined. In this case, a minimum distance was estimated as the sum of distances of each gene to the end of the contig it was located on. For the same reason, the orientation of some genes could not be determined (indicated by asterisks below the genes).
Figure 6
Figure 6. A rooted Bayesian consensus tree made with the nuclear dataset of 72 Alphaproteobacteria and 6 eukaryotes.
Asterisks indicate the 18 genomes sequenced in this study. The tree was rooted using Beta and Gammaproteobacteria as the outgroup. The posterior probability support values of the internal nodes are 1.0 unless as indicated in the tree.

References

    1. Lang B. F., Seif E., Gray M. W., O'Kelly C. J. & Burger G. A comparative genomics approach to the evolution of eukaryotes and their mitochondria. J. Eukaryot. Microbiol. 46, 320–326 (1999). - PubMed
    1. Kurland C. G. & Andersson S. G. Origin and evolution of the mitochondrial proteome. Microbiol. Mol. Biol. Rev. 64, 786–820 (2000). - PMC - PubMed
    1. Gabaldon T. & Huynen M. A. Reconstruction of the proto-mitochondrial metabolism. Science 301, 609 (2003). - PubMed
    1. Gray M. W., Burger G. & Lang B. F. Mitochondrial evolution. Science 283, 1476–1481 (1999). - PubMed
    1. Gray M. W., Burger G. & Lang B. F. The origin and early evolution of mitochondria. Genome Biol. 2, REVIEWS1018 (2001). - PMC - PubMed

Publication types

LinkOut - more resources