

Quantification of central substance P receptor occupancy by aprepitant using small animal positron emission tomography
- PMID: 25609595
- PMCID: PMC4368889
- DOI: 10.1093/ijnp/pyu030
Quantification of central substance P receptor occupancy by aprepitant using small animal positron emission tomography
Abstract
Background: Central substance P receptors, termed NK-1 receptors, have been considered as therapeutic targets in the development of drugs against diverse conditions, including emesis, overactive bladder, and depression.
Methods: Here, we applied small animal positron emission tomography (PET) and a radioligand for NK-1 receptors ([(18)F]FE-SPA-RQ) for measuring occupancies of these receptors by a selective antagonist (aprepitant) in order to examine the validity of this in vivo imaging system for preclinical characterization of candidate agents acting on NK-1 receptors, and as a tool for predicting optimal doses in humans.
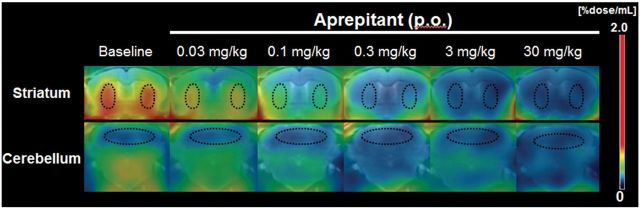
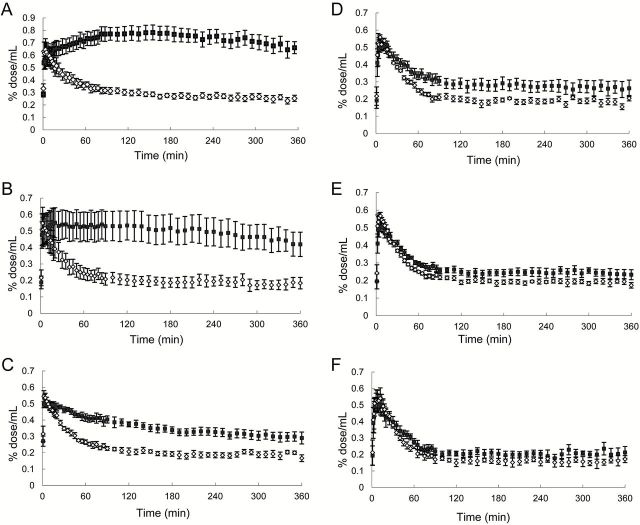
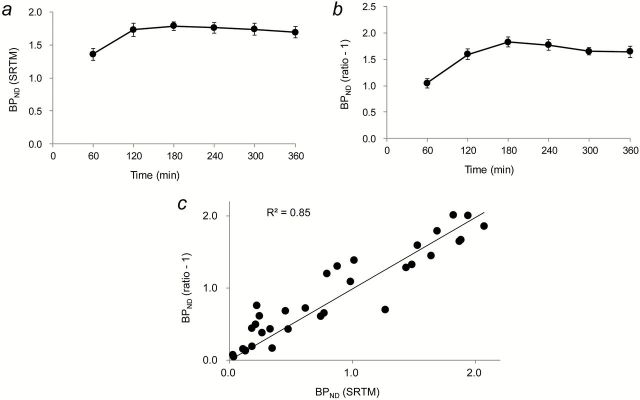
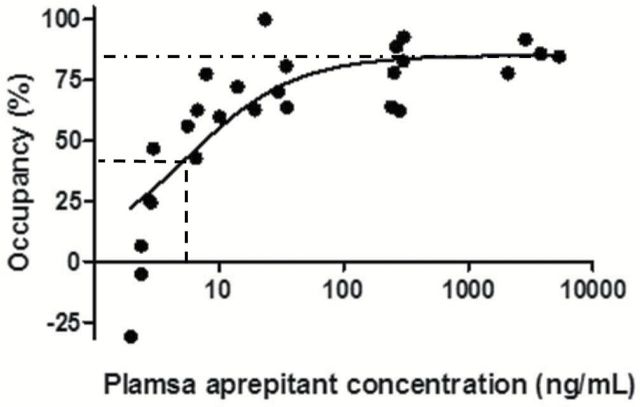
Results: PET in gerbils depicted high uptake in the striatum and dose-dependent displacement with increasing doses of aprepitant. Occupancies increased as a function of aprepitant plasma concentrations according to a one-site competition model, which agrees with reported occupancy-concentration relationships in clinical studies after correction for species differences in plasma protein-unbound aprepitant fractions. These occupancy data were further supported by ex vivo autoradiography of brain samples from aprepitant-treated gerbils. In a pilot study of a marmoset, we obtained more accurate determinations of NK-1 receptor occupancy, less affected by spillover of signals from extracranial tissues than in gerbil experiments.
Conclusions: These findings support the utility of small animals and quantitative PET in the development of drugs targeting NK-1 receptors.
Keywords: NK-1 receptor; receptor occupancy; small-animal PET; substance P.
© The Author 2015. Published by Oxford University Press on behalf of CINP.
Figures


Similar articles
-
Human positron emission tomography studies of brain neurokinin 1 receptor occupancy by aprepitant.Biol Psychiatry. 2004 May 15;55(10):1007-12. doi: 10.1016/j.biopsych.2004.02.007. Biol Psychiatry. 2004. PMID: 15121485 Clinical Trial.
-
Imaging substance P receptors (NK1) in the living human brain using positron emission tomography.J Clin Psychiatry. 2002;63 Suppl 11:18-24. J Clin Psychiatry. 2002. PMID: 12562139 Review.
-
S41744, a dual neurokinin (NK)1 receptor antagonist and serotonin (5-HT) reuptake inhibitor with potential antidepressant properties: a comparison to aprepitant (MK869) and paroxetine.Eur Neuropsychopharmacol. 2010 Sep;20(9):599-621. doi: 10.1016/j.euroneuro.2010.04.003. Epub 2010 May 18. Eur Neuropsychopharmacol. 2010. PMID: 20483567
-
Equivalent dynamic human brain NK1-receptor occupancy following single-dose i.v. fosaprepitant vs. oral aprepitant as assessed by PET imaging.Clin Pharmacol Ther. 2012 Aug;92(2):243-50. doi: 10.1038/clpt.2012.62. Epub 2012 Jun 27. Clin Pharmacol Ther. 2012. PMID: 22739139
-
NK1 receptor antagonists for depression: Why a validated concept was abandoned.J Affect Disord. 2017 Dec 1;223:121-125. doi: 10.1016/j.jad.2017.07.042. Epub 2017 Jul 20. J Affect Disord. 2017. PMID: 28753469 Review.
Cited by
-
Effectiveness of aprepitant in post-acute COVID19 syndrome.Clin Case Rep. 2021 Sep 18;9(9):e04646. doi: 10.1002/ccr3.4646. eCollection 2021 Sep. Clin Case Rep. 2021. PMID: 34567551 Free PMC article.
-
Antitumor action of temozolomide, ritonavir and aprepitant against human glioma cells.J Neurooncol. 2016 Feb;126(3):425-31. doi: 10.1007/s11060-015-1996-6. Epub 2015 Nov 24. J Neurooncol. 2016. PMID: 26603162
References
-
- Bergstrom M, Hargreaves RJ, Burns HD, Goldberg MR, Sciberras D, Reines SA, Petty KJ, Ogren M, Antoni G, Langstrom B, Eskola O, Scheinin M, Solin O, Majumdar AK, Constanzer ML, Battisti WP, Bradstreet TE, Gargano C, Hietala J. (2004). Human positron emission tomography studies of brain neurokinin 1 receptor occupancy by aprepitant. Biol Psychiatry 55:1007–1012. - PubMed
-
- Fong TM, Yu H, Strader CD. (1992). Molecular basis for the species selectivity of the neurokinin-1 receptor antagonists CP-96,345 and RP67580. J Biol Chem 267:25668–25671. - PubMed
-
- George DT, Gilman J, Hersh J, Thorsell A, Herion D, Geyer C, Peng X, Kielbasa W, Rawlings R, Brandt JE, Gehlert DR, Tauscher JT, Hunt SP, Hommer D, Heilig M. (2008). Neurokinin 1 receptor antagonism as a possible therapy for alcoholism. Science 319:1536–1539. - PubMed
Publication types
MeSH terms
Substances
LinkOut - more resources
Full Text Sources
Other Literature Sources
