. 2015 Jan 21;35(3):1052-67.
doi: 10.1523/JNEUROSCI.2953-14.2015.

Role of parafacial nuclei in control of breathing in adult rats

Affiliations

Role of parafacial nuclei in control of breathing in adult rats

Robert T R Huckstepp et al. J Neurosci. .

Abstract

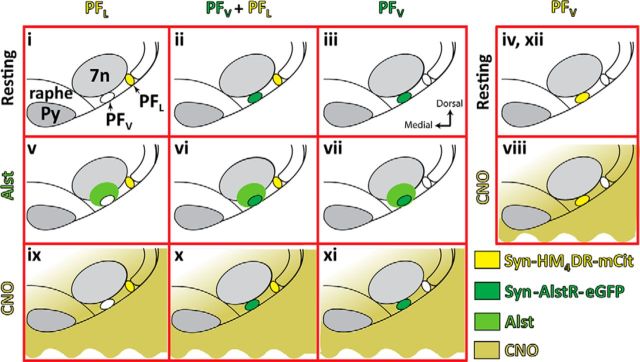
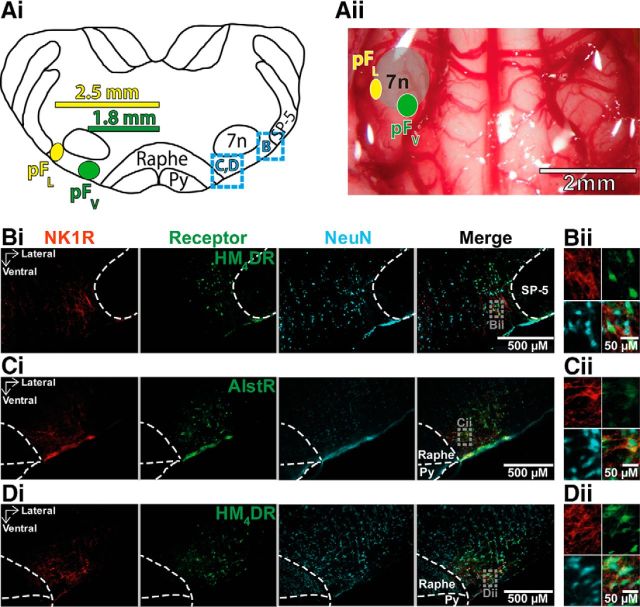
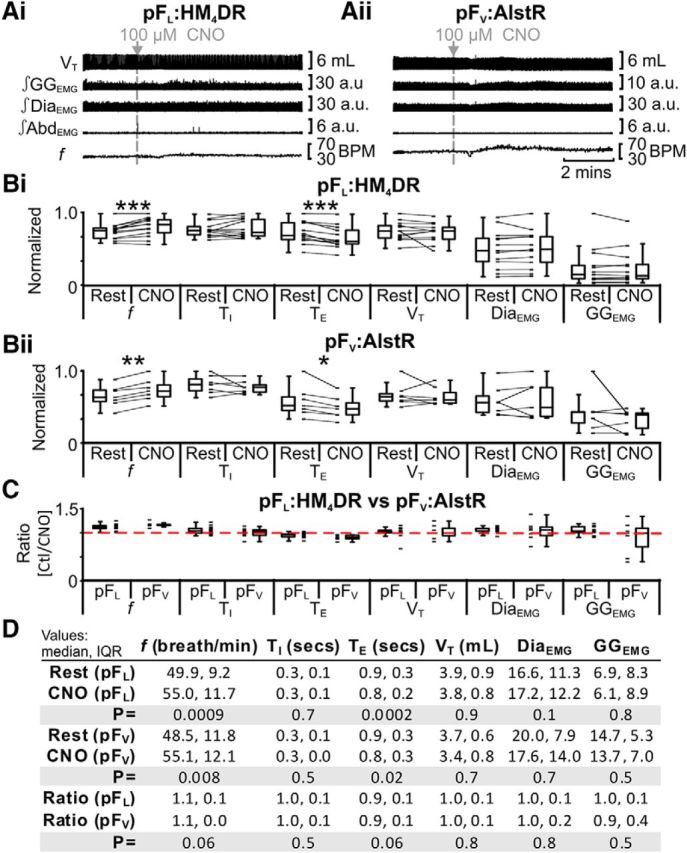
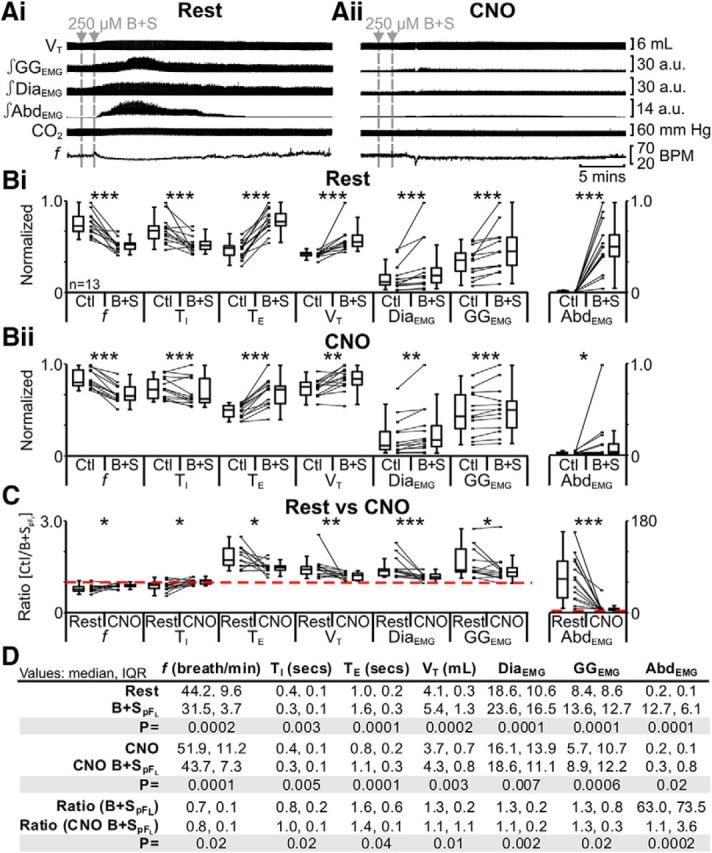
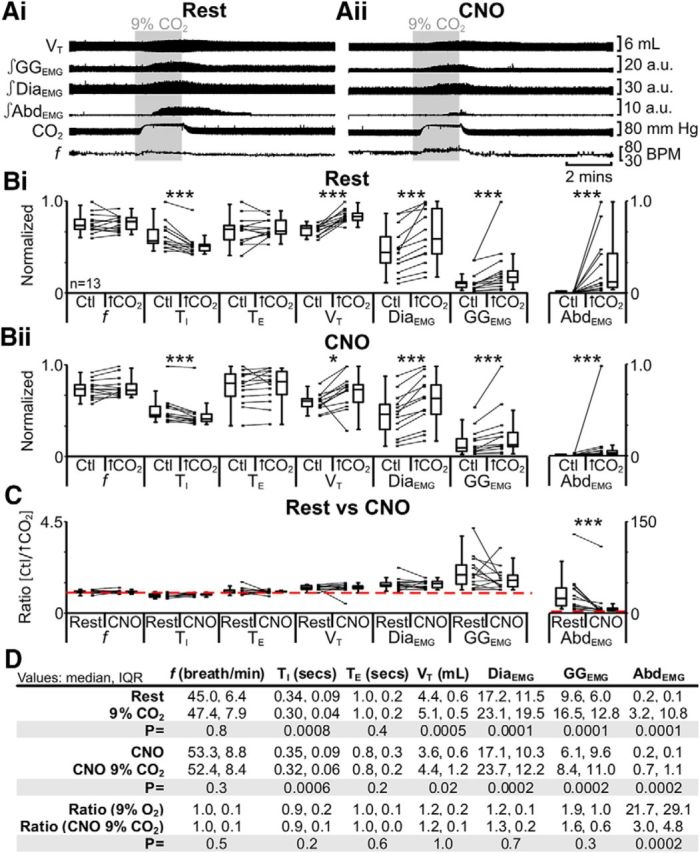
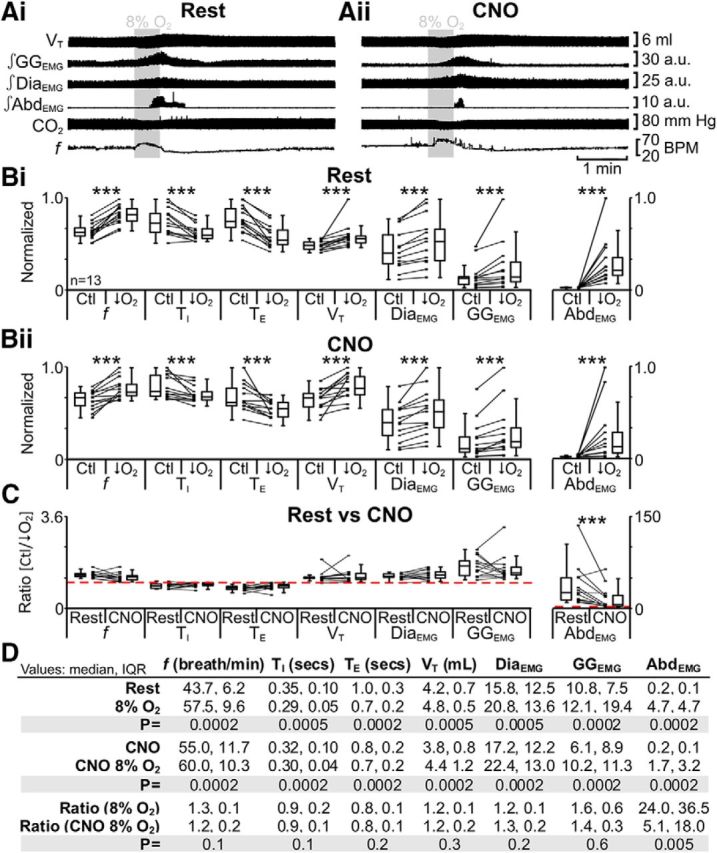
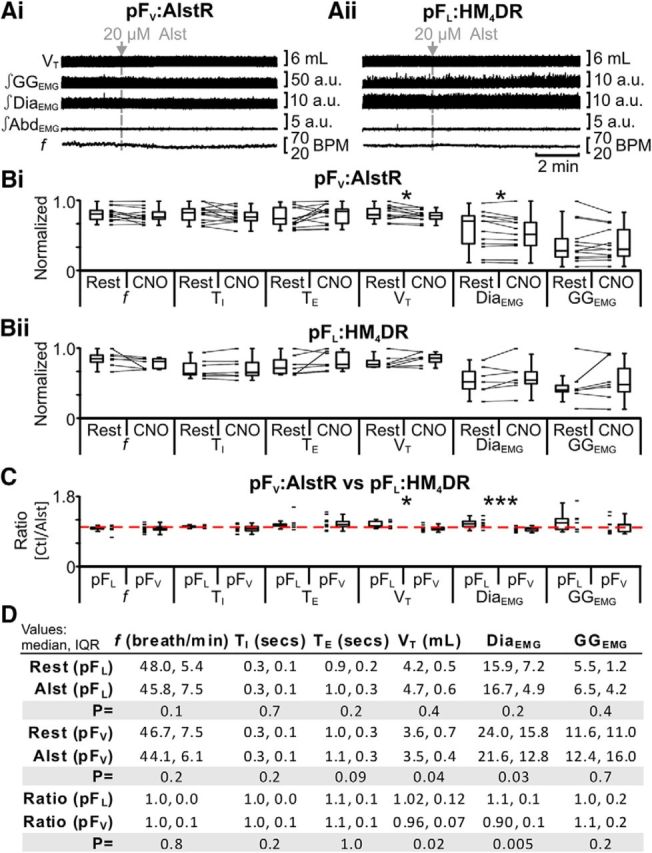
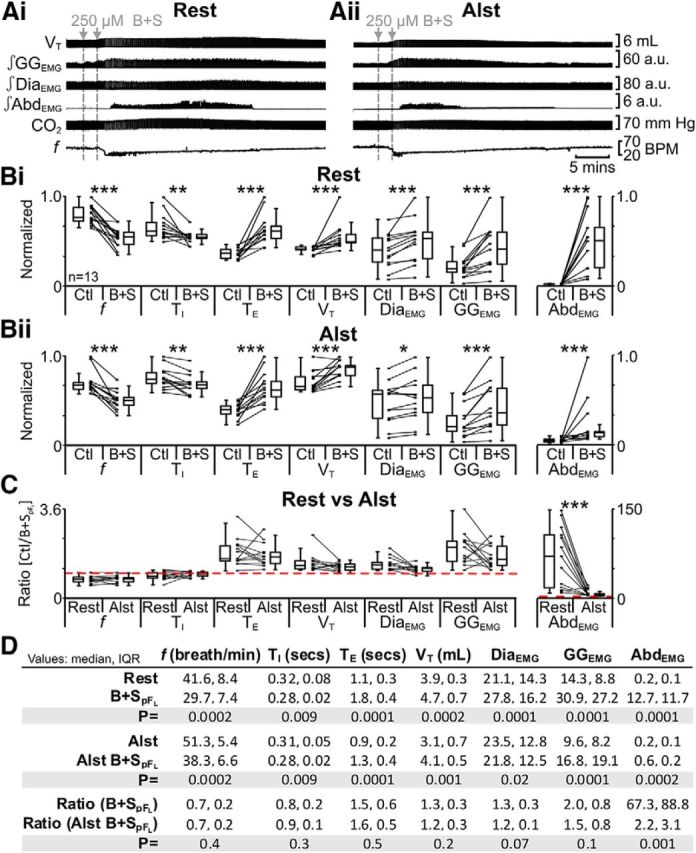
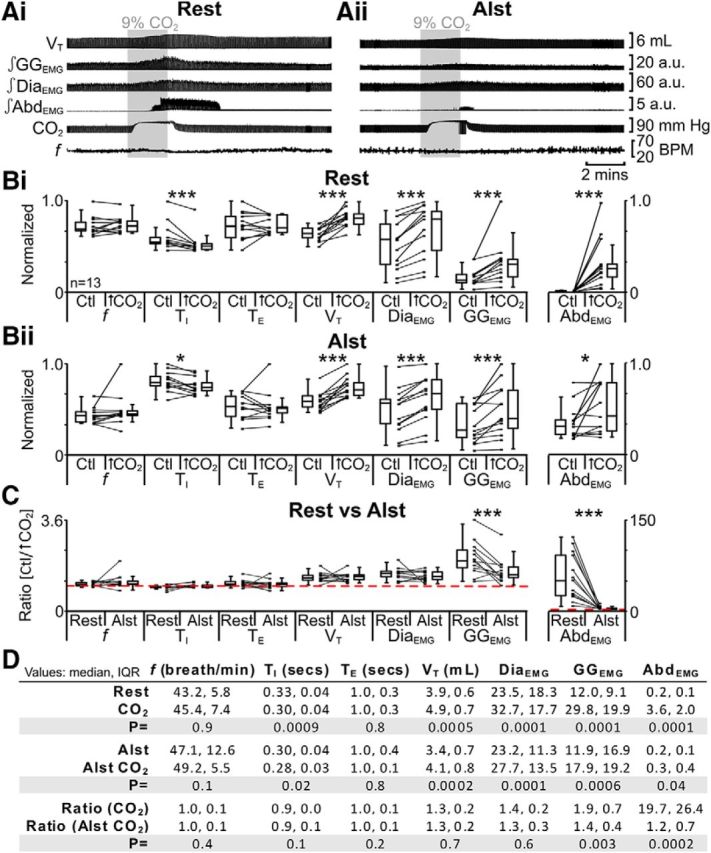
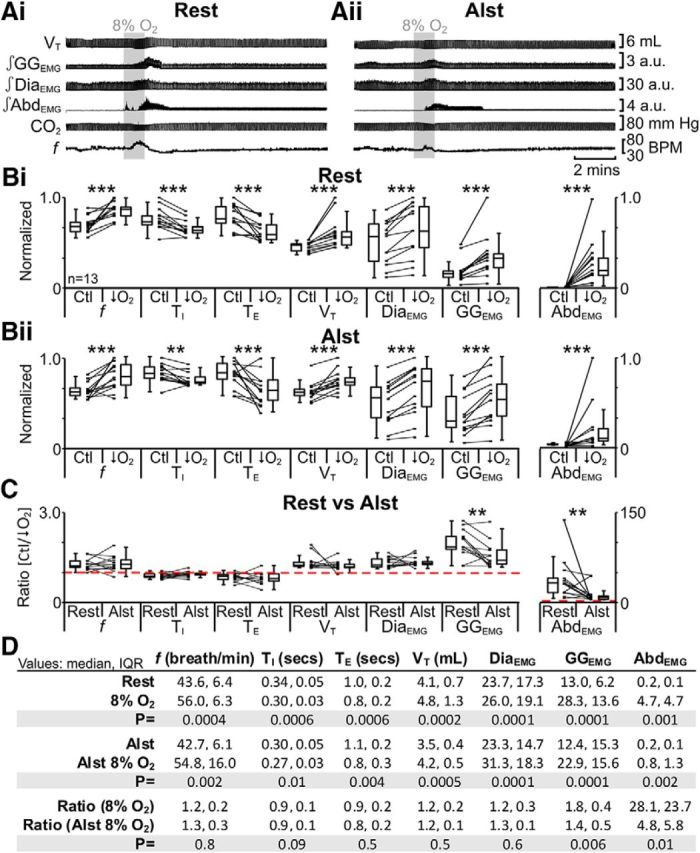
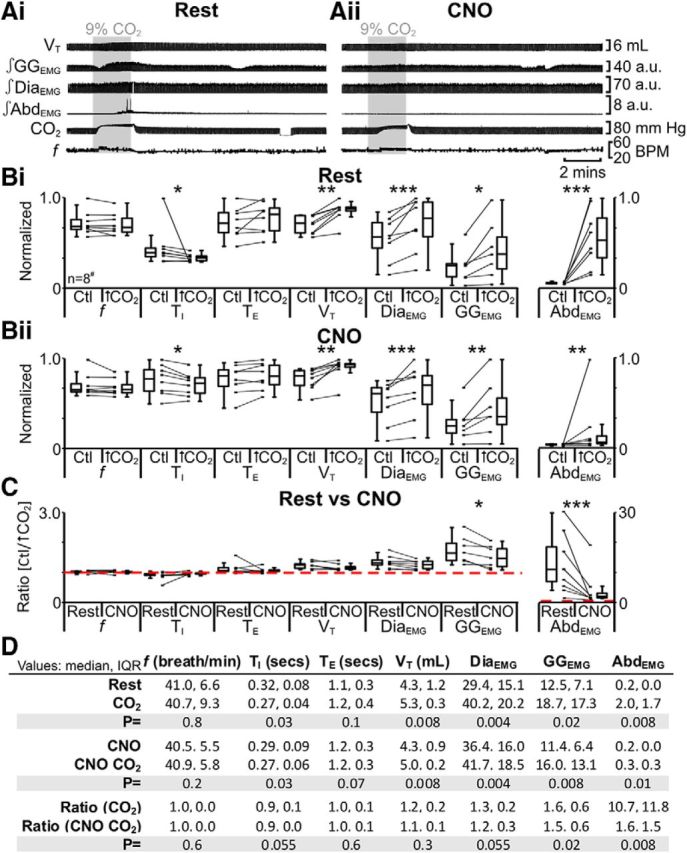
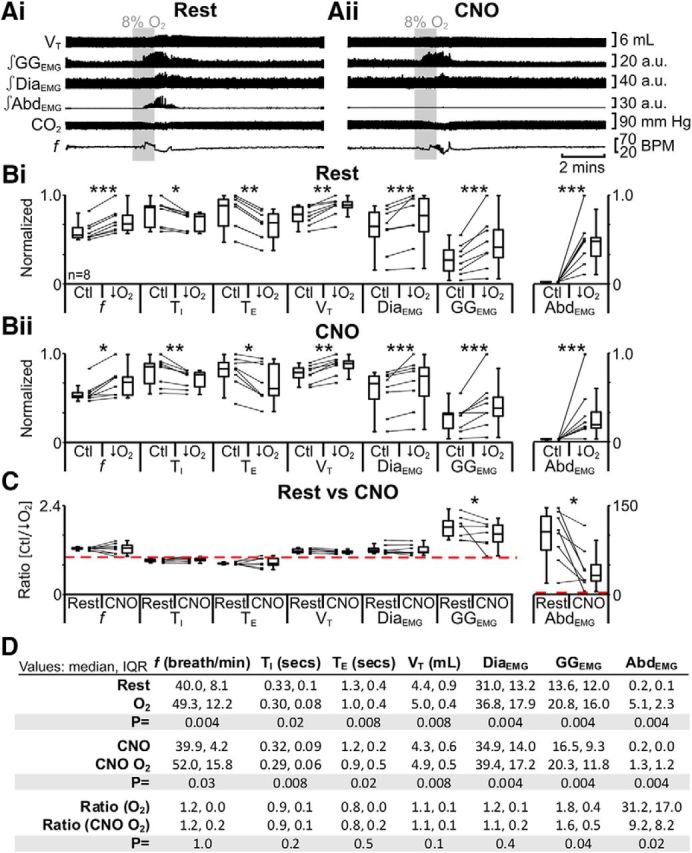
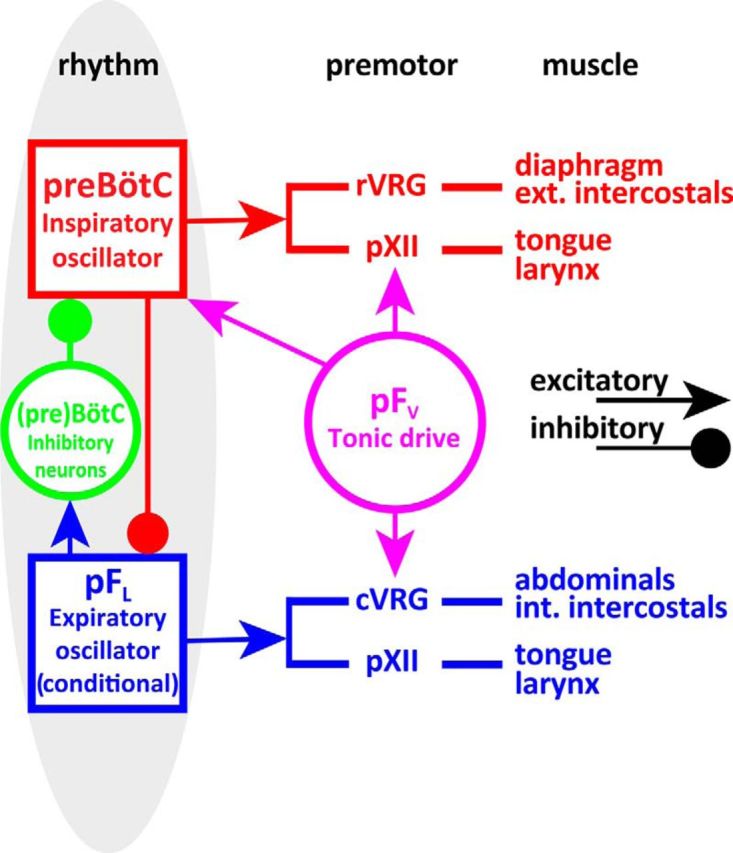
Contiguous brain regions associated with a given behavior are increasingly being divided into subregions associated with distinct aspects of that behavior. Using recently developed neuronal hyperpolarizing technologies, we functionally dissect the parafacial region in the medulla, which contains key elements of the central pattern generator for breathing that are important in central CO2-chemoreception and for gating active expiration. By transfecting different populations of neighboring neurons with allatostatin or HM4D Gi/o-coupled receptors, we analyzed the effect of their hyperpolarization on respiration in spontaneously breathing vagotomized urethane-anesthetized rats. We identify two functionally separate parafacial nuclei: ventral (pFV) and lateral (pFL). Disinhibition of the pFL with bicuculline and strychnine led to active expiration. Hyperpolarizing pFL neurons had no effect on breathing at rest, or changes in inspiratory activity induced by hypoxia and hypercapnia; however, hyperpolarizing pFL neurons attenuated active expiration when it was induced by hypercapnia, hypoxia, or disinhibition of the pFL. In contrast, hyperpolarizing pFV neurons affected breathing at rest by decreasing inspiratory-related activity, attenuating the hypoxia- and hypercapnia-induced increase in inspiratory activity, and when present, reducing expiratory-related abdominal activity. Together with previous observations, we conclude that the pFV provides a generic excitatory drive to breathe, even at rest, whereas the pFL is a conditional oscillator quiet at rest that, when activated, e.g., during exercise, drives active expiration.

Keywords: active expiration; control of breathing; expiratory oscillator; parafacial respiratory group; respiration; retrotrapezoid nucleus.


Figures

Figure 1.
Figure 1.
Overall experimental design. Rats were transfected with: syn-HM4DR-mCit (light yellow) in ventral parafacial region (pFV:HM4DR) or into lateral parafacial region (pFL:HM4DR), or synapsin-AlstR-GFP (dark green) into pFV (pFV:AlstR), or both pFL:HM4DR and pFV:AlstR. All rats were subject to the same triad of experimental challenges, i.e., hypoxia, hypercapnia, and disinhibition of pFL. For rats transfected with pFL:HM4DR, pFV:AlstR, or pFL:HM4DR and pFV:AlstR, these challenges were performed under control conditions (i–iii), following injections of Alst (light green) into pFV (v–vii), and following application of CNO (dark yellow) to medullary surface (ix–xi). Rats transfected with pFV:HM4DR underwent the same triad of experimental challenges, i.e., hypoxia, hypercapnia, and disinhibition of pFL. These challenges were performed under control conditions (iv, before CNO; xii, after CNO), and following application of CNO to medullary surface (viii). Data for different conditions were compared. Since Alst did not affect HM4DR-transfected neurons and since CNO did not affect AlstR-transfected neurons, data for similar conditions were combined for analysis and comparisons. Thus we compared i + ii versus ix + x, iii versus xi, ii + iii versus vi + vii, i versus v, and iv + xii versus viii.
Figure 2.
Figure 2.
Neuronal transfection in parafacial regions. A, Localization of injections into pFV and pFL. Ai, Transverse view of medulla at bregma −11.25 mm. Dashed squared blue boxes identify location of sections illustrating immunocytochemistry shown in B–D. Aii, Ventral view of medullary surface. Ai, Aii, Green circle shows location of AlstR injection sites for pFV (Ci),yellow circle shows location of HM4DR injection sites for pFL (Bi) and pFV (Di). Bi–Di, Micrographs of injection sites: neurons (blue) transfected with AlstR (in Ci) expressing GFP, or HM4DR (in Bi, Di) expressing mCitrine, colocalized with NK1R (red). Bii–Dii, Expanded micrographs from merged figures in Bi–Di (dashed gray boxes): NeuN (blue), GFP, or mCitrine (green), and NK1R (red). Py, pyramidal tract; SP-5, spinal trigeminal tract; 7n, facial nucleus.
Figure 3.
Figure 3.
Measurement of respiratory variables. Gray traces are raw data (not shown in Figs. 4–13). Black traces are integrated data, end-tidal CO2, and frequency (shown in Figs. 4–13). Maximum and minimum values for each variable were measured from integrated traces (red dashed lines) and the differences, along with frequency (blue line + dots), were used to calculate f, TI, TE, VT, GGEMG, DiaEMG, and AbdEMG.
Figure 4.
Figure 4.
Effect of CNO in rats with and without HM4DRs. A, Integrated traces: gray arrows and vertical dashed lines indicate application of CNO in pFL:HM4DR rats (Ai) or in rats lacking HM4DRs, i.e., pFV:AlstR rats (Aii). B, Comparison of respiratory variables before and after CNO in pFL:HM4DR rats (Bi) and pFV:AlstR rats (Bii). Lines connect data from individual experiments, and box-and-whisker plots show combined data. Data in Bi and Bii are normalized to highest value for that parameter, i.e., f, TI, TE, VT, GGEMG, DiaEMG, or AbdEMG, regardless of whether it belonged to control or CNO group. C, Comparison of ratio changes between effects of CNO on pFL:HM4DR and pFV:AlstR rats. Box-and-whisker plots show combined data, with data points from individual experiments. Data in C are expressed as ratios of resting values, and red horizontal dashed line represents a ratio of 1. D, Table containing median, IQR, and p values, from data represented in A. *p < 0.05, **p < 0.01, ***p < 0.005.
Figure 5.
Figure 5.
Hyperpolarizing pFL neurons significantly reduced effects of disinhibition of pFL (B + SpFL). A, Integrated traces from a single experiment: gray arrows and vertical dashed lines represent pipette placement for unilateral and bilateral B + SpFL. Ai, Rest. Aii, During application of CNO to medullary surface (present for entire trace). B, Comparison of respiratory variables before and after B + SpFL in pFL:HM4DR rats at rest (Bi) and in the presence of CNO (Bii). Lines connect data from individual experiments, and box-and-whisker plots show combined data. Data in Bi and Bii are normalized to highest value for that parameter, i.e., f, TI, TE, VT, GGEMG, DiaEMG, or AbdEMG, regardless of whether it belonged to control or B + SpFL group. C, Comparison between ratio changes induced by B + SpFL in pFL:HM4DR rats at rest and in the presence of CNO. Data in C are expressed as ratios of resting values, and red horizontal dashed line represents ratio of 1. D, Table containing median, IQR, and p values, from data represented in B. *p < 0.05, **p < 0.01, ***p < 0.005.
Figure 6.
Figure 6.
Hyperpolarizing pFL neurons reduced effects of hypercapnia (9% CO2) on AbdEMG only. A, Integrated traces from a single experiment: shaded area shows period of hypercapnia. Ai, Rest. Aii, During application of CNO to medullary surface (present for entire trace). B, Comparison of respiratory variables before and after hypercapnia in pFL:HM4DR rats at rest (Bi) and in the presence of CNO (Bii). Lines connect data from individual experiments, and box-and-whisker plots show combined data. Data in Bi and Bii are normalized to highest value for that parameter, i.e., f, TI, TE, VT, GGEMG, DiaEMG, or AbdEMG, regardless of whether it belonged to control or 9% CO2 group. C, Comparison between ratio changes induced by hypercapnia in pFL:HM4DR rats at rest and in the presence of CNO. Data in C are expressed as ratios of resting values, and red horizontal dashed line represents a ratio of 1. D, Table containing median, IQR, and p values, from data represented in B. *p < 0.05, **p < 0.01, ***p < 0.005.
Figure 7.
Figure 7.
Hyperpolarizing pFL neurons reduced effects of hypoxia (8% O2) on AbdEMG only. A, Integrated traces from a single experiment: shaded area shows period of hypoxia. Ai, Rest. Aii, During application of CNO to medullary surface (present for entire trace). B, Comparison of respiratory variables before and after hypoxia in pFL:HM4DR rats at rest (Bi) and in the presence of CNO (Bii). Lines connect data from individual experiments, and box-and-whisker plots show combined data. Data in Bi and Bii are normalized to highest value for that parameter, i.e., f, TI, TE, VT, GGEMG, DiaEMG, or AbdEMG, regardless of whether it belonged to control or 8% O2 group. C, Comparison between ratio changes induced by hypoxia in pFL:HM4DR rats at rest and in the presence of CNO. Data in C are expressed as ratios of resting values, and red horizontal dashed line represents a ratio of 1. D, Table containing median, IQR, and p values, from data represented in B. *p < 0.05, **p < 0.01, ***p < 0.005.
Figure 8.
Figure 8.
pFV provides facilitative drive to respiration at rest. A, Integrated traces from a single experiment: gray arrows and vertical dashed lines show the beginning of Alst injection in pFV:AlstR rats (Ai), or in rats lacking AlstRs, i.e., pFL:HM4DR rats (Aii). B, Comparison of respiratory variables before and after Alst in pFV:AlstR rats (Bi) and pFL:HM4DR rats (Bii). Lines connect data from individual experiments, and box-and-whisker plots show combined data. Data in Bi and Bii are normalized to highest value for that parameter, i.e., f, TI, TE, VT, GGEMG, DiaEMG, or AbdEMG, regardless of whether it belonged to control or Alst group. C, Comparison of ratio changes between effects of Alst on pFL:HM4DR and pFV:AlstR rats. Box-and-whisker plots show combined data, with data points from individual experiments. Data in C are expressed as ratios of resting values, and red horizontal dashed line represents a ratio of 1. D, Table containing median, IQR, and p values, from data represented in A. *p < 0.05, **p < 0.01, ***p < 0.005.
Figure 9.
Figure 9.
Hyperpolarizing pFV neurons reduced effects of disinhibition of pFL (B + SpFL) on AbdEMG only. A, Integrated traces from a single experiment: gray arrows and vertical dashed lines represent pipette placement for unilateral and bilateral B + SpFL. Ai, Rest. Aii, After Alst in pFV (present for entire trace). B, Comparison of respiratory variables before and after B + SpFL in pFV:AlstR rats at rest (Bi) and in the presence of Alst (Bii). Lines connect data from individual experiments, and box-and-whisker plots show combined data. Data in Bi and Bii are normalized to highest value for that parameter, i.e., f, TI, TE, VT, GGEMG, DiaEMG, or AbdEMG, regardless of whether it belonged to control or B + SpFL group. C, Comparison between ratio changes induced by B + SpFL in pFV:AlstR rats at rest and in the presence of Alst. Data in C are expressed as ratios of resting values, and red horizontal dashed line represents a ratio of 1. D, Table containing median, IQR, and p values, from data represented in B. *p < 0.05, **p < 0.01, ***p < 0.005.
Figure 10.
Figure 10.
Hyperpolarizing pFV neurons reduced effects of hypercapnia (9% CO2) on AbdEMG and GGEMG. A, Integrated traces from a single experiment: shaded area shows period of hypercapnia. Ai, Rest. Aii, After addition of Alst into pFV (present for entire trace). B, Comparison of respiratory variables before and after hypercapnia in pFV:AlstR rats at rest (Bi) and in the presence of Alst (Bii). Lines connect data from individual experiments, and box-and-whisker plots show combined data. Data in Bi and Bii are normalized to highest value for that parameter, i.e., f, TI, TE, VT, GGEMG, DiaEMG, or AbdEMG, regardless of whether it belonged to control or 9% CO2 group. C, Comparison between ratio changes induced by hypercapnia in pFV:AlstR rats at rest and in the presence of Alst. Data in C are expressed as ratios of resting values, and red horizontal dashed line represents a ratio of 1. D, Table containing median, IQR, and p values, from data represented in B. *p < 0.05, **p < 0.01, ***p < 0.005.
Figure 11.
Figure 11.
Hyperpolarizing pFV neurons reduced effects of hypoxia (8% O2) on AbdEMG and GGEMG. A, Integrated traces from a single experiment: shaded area shows period of hypoxia. Ai, Rest. Aii, After addition of Alst into pFV (present for entire trace). B, Comparison of respiratory variables before and after hypoxia in pFV:AlstR rats at rest (Bi) and in the presence of Alst (Bii). Lines connect data from individual experiments, and box-and-whisker plots show combined data. Data in Bi and Bii are normalized to highest value for that parameter, i.e., f, TI, TE, VT, GGEMG, DiaEMG, or AbdEMG, regardless of whether it belonged to control or 8% O2 group. C, Comparison between ratio changes induced by hypoxia in pFV:AlstR rats at rest and in the presence of Alst. Data in C are expressed as ratios of resting values, and red horizontal dashed line represents a ratio of 1. D, Table containing median, IQR, and p values, from data represented in B. *p < 0.05, **p < 0.01, ***p < 0.005.
Figure 12.
Figure 12.
Hyperpolarizing pFV neurons during hypercapnia (9% CO2) with HM4DR only affects GGEMG and AbdEMG. A, Integrated traces from a single experiment: shaded area shows period of hypercapnia. Ai, Rest. Aii, During application of CNO to medullary surface (present for entire trace). B, Comparison of respiratory variables before and after hypercapnia in pFV:HM4DR rats at rest (Bi) and in the presence of CNO (Bii). Lines connect data from individual experiments, and box-and-whisker plots show combined data. Data in Bi and Bii are normalized to highest value for that parameter, i.e., f, TI, TE, VT, GGEMG, DiaEMG, or AbdEMG, regardless of whether it belonged to control or 9% CO2 group. C, Comparison between ratio changes induced by hypercapnia in pFV:HM4DR rats at rest and in presence of CNO. Data in C are expressed as ratios of resting values, and red horizontal dashed line represents a ratio of 1. D, Table containing median, IQR, and p values, from data represented in B. *p < 0.05, **p < 0.01, ***p < 0.005. #n = 7 for GGEMG.
Figure 13.
Figure 13.
Hyperpolarizing pFV neurons during hypoxia (8%) with HM4DR only affects GGEMG and AbdEMG. A, Integrated traces from a single experiment: shaded area shows period of hypoxia. Ai, Rest. Aii, During application of CNO to medullary surface (present for entire trace). B, Comparison of respiratory variables before and after hypoxia in pFV:HM4DR rats at rest (Bi) and in the presence of CNO (Bii). Lines connect data from individual experiments, and box-and-whisker plots show combined data. Data in Bi and Bii are normalized to highest value for that parameter, i.e., f, TI, TE, VT, GGEMG, DiaEMG, or AbdEMG, regardless of whether it belonged to control or 8% O2 group. C, Comparison between ratio changes induced by hypoxia in pFV:HM4DR rats at rest and in presence of CNO. Data in C are expressed as ratios of resting values, and red horizontal dashed line represents a ratio of 1. D, Table containing median, IQR, and p values, from data represented in B. *p < 0.05, **p < 0.01, ***p < 0.005.
Figure 14.
Figure 14.
Schematic of minimal respiratory central pattern generator, which at its core consists of three essential components: (1) an inspiratory oscillator in preBötC that drives inspiration by exciting inspiratory premotor neuronal populations, e.g., rVRG and parahypoglossal region (pXII), and inhibits pFL; (2) a (conditional) expiratory oscillator in pFL that gates and drives expiration by exciting expiratory premotor neuronal populations, i.e., cVRG (Janczewski et al., 2002) and pXII, and assures alteration of phases by exciting neurons that inhibit preBötC, e.g., inhibitory neurons in either the preBötC or BötC; and (3) a source of tonic drive in pFV that is responsive to CO2/pH and integrates other sensory afferents affecting respiratory drive, via excitatory connections to preBötC, BötC, and respiratory premotor neurons, e.g., rVRG, cVRG, and pXII.

References

    1. Abbott SB, Stornetta RL, Socolovsky CS, West GH, Guyenet PG. Photostimulation of channelrhodopsin-2 expressing ventrolateral medullary neurons increases sympathetic nerve activity and blood pressure in rats. J Physiol. 2009;587:5613–5631. doi: 10.1113/jphysiol.2009.177535. - DOI - PMC - PubMed
    1. Abbott SB, Stornetta RL, Coates MB, Guyenet PG. Phox2b-expressing neurons of the parafacial region regulate breathing rate, inspiration, and expiration in conscious rats. J Neurosci. 2011;31:16410–16422. doi: 10.1523/JNEUROSCI.3280-11.2011. - DOI - PMC - PubMed
    1. Birgül N, Weise C, Kreienkamp HJ, Richter D. Reverse physiology in drosophila: identification of a novel allatostatin-like neuropeptide and its cognate receptor structurally related to the mammalian somatostatin/galanin/opioid receptor family. EMBO J. 1999;18:5892–5900. doi: 10.1093/emboj/18.21.5892. - DOI - PMC - PubMed
    1. Callaway EM. A molecular and genetic arsenal for systems neuroscience. Trends Neurosci. 2005;28:196–201. doi: 10.1016/j.tins.2005.01.007. - DOI - PubMed
    1. Chamberlin NL, Eikermann M, Fassbender P, White DP, Malhotra A. Genioglossus premotoneurons and the negative pressure reflex in rats. J Physiol. 2007;579:515–526. doi: 10.1113/jphysiol.2006.121889. - DOI - PMC - PubMed

Publication types