. 2015 Jan 21;35(3):1089-105.
doi: 10.1523/JNEUROSCI.2279-14.2015.

Contributions of diverse excitatory and inhibitory neurons to recurrent network activity in cerebral cortex

Affiliations

Contributions of diverse excitatory and inhibitory neurons to recurrent network activity in cerebral cortex

Garrett T Neske et al. J Neurosci. .

Abstract

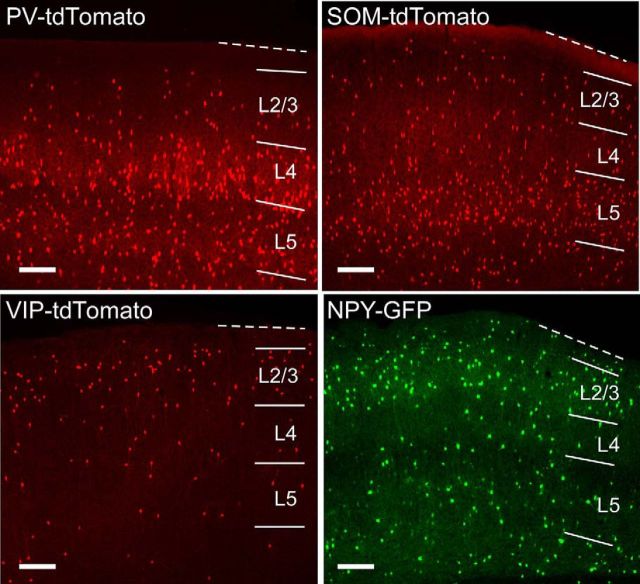
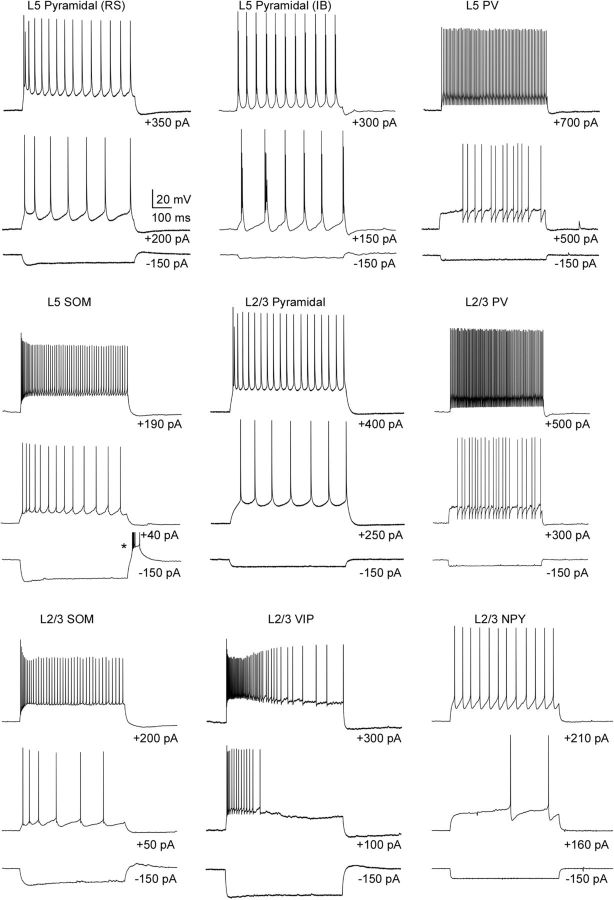
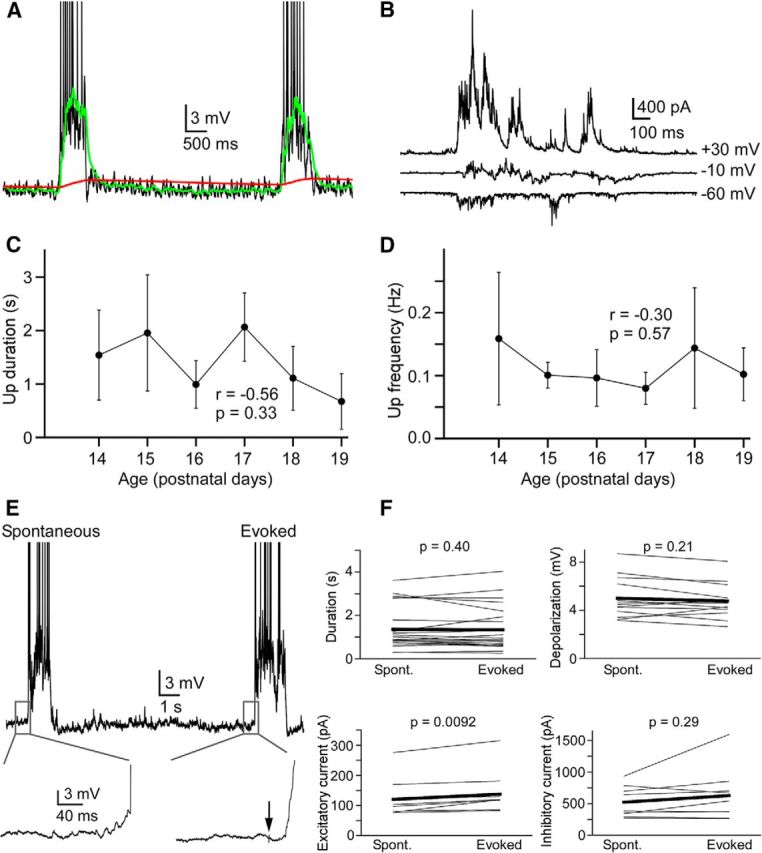
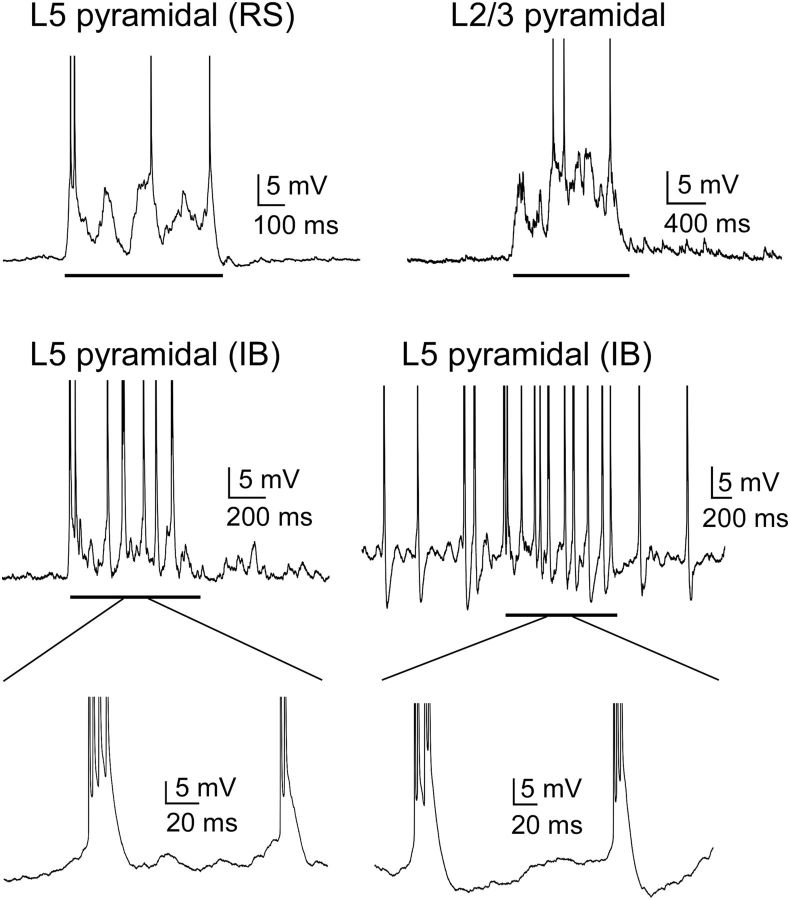
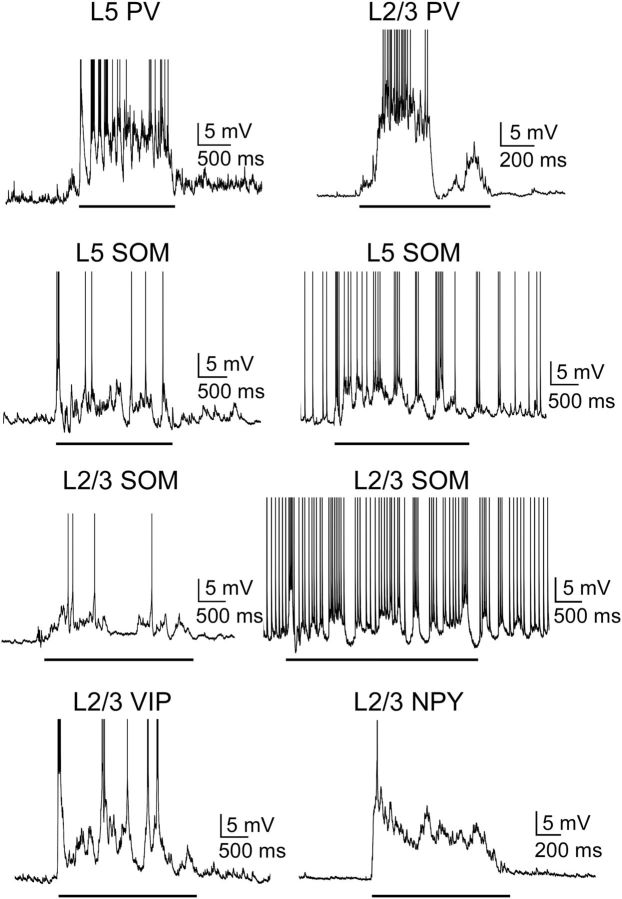
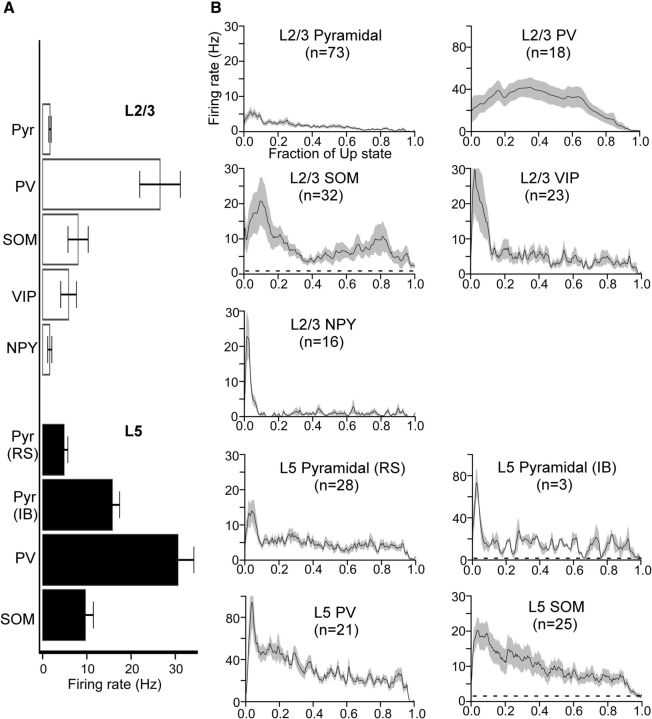
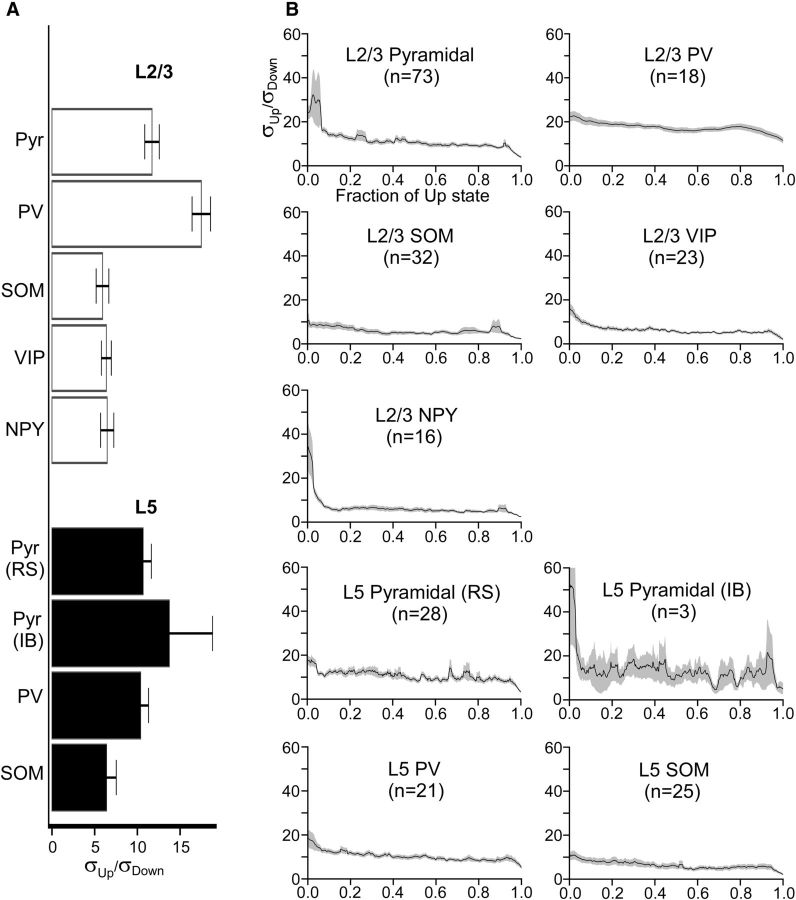
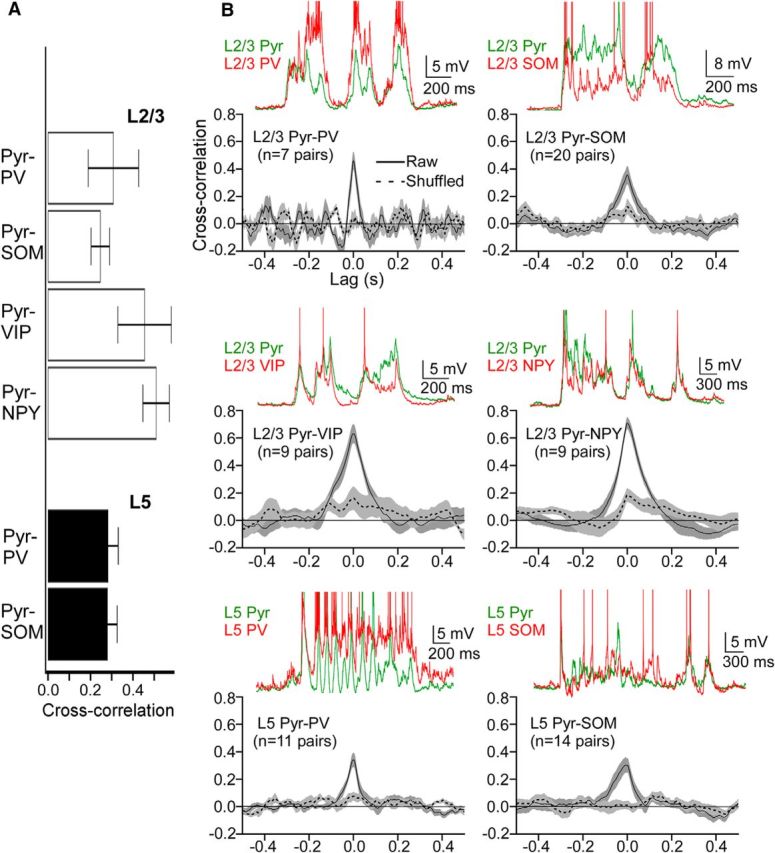
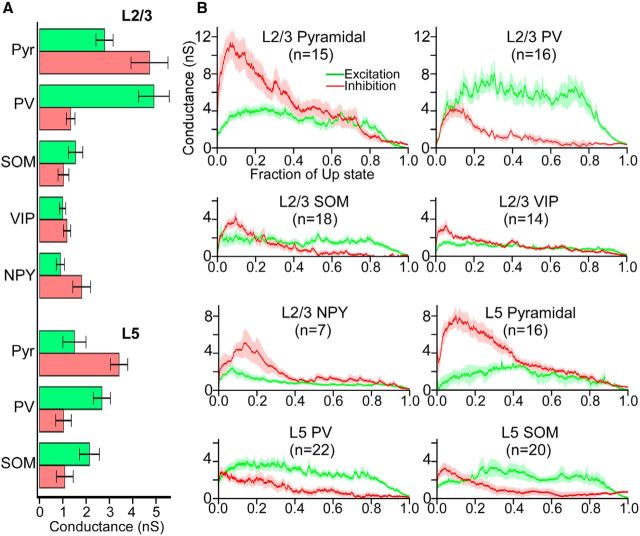
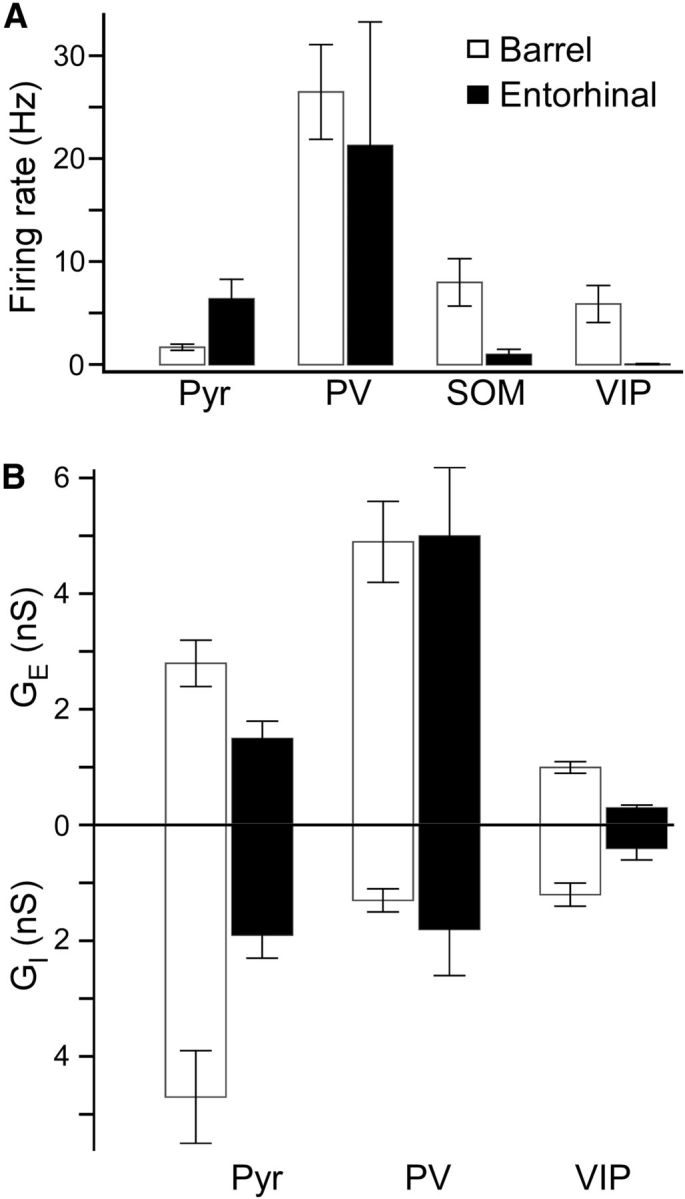
The recurrent synaptic architecture of neocortex allows for self-generated network activity. One form of such activity is the Up state, in which neurons transiently receive barrages of excitatory and inhibitory synaptic inputs that depolarize many neurons to spike threshold before returning to a relatively quiescent Down state. The extent to which different cell types participate in Up states is still unclear. Inhibitory interneurons have particularly diverse intrinsic properties and synaptic connections with the local network, suggesting that different interneurons might play different roles in activated network states. We have studied the firing, subthreshold behavior, and synaptic conductances of identified cell types during Up and Down states in layers 5 and 2/3 in mouse barrel cortex in vitro. We recorded from pyramidal cells and interneurons expressing parvalbumin (PV), somatostatin (SOM), vasoactive intestinal peptide (VIP), or neuropeptide Y. PV cells were the most active interneuron subtype during the Up state, yet the other subtypes also received substantial synaptic conductances and often generated spikes. In all cell types except PV cells, the beginning of the Up state was dominated by synaptic inhibition, which decreased thereafter; excitation was more persistent, suggesting that inhibition is not the dominant force in terminating Up states. Compared with barrel cortex, SOM and VIP cells were much less active in entorhinal cortex during Up states. Our results provide a measure of functional connectivity of various neuron types in barrel cortex and suggest differential roles for interneuron types in the generation and control of persistent network activity.

Keywords: Up state; barrel cortex; entorhinal cortex; inhibition; interneuron; slice.


Figures

Figure 1.
Figure 1.
Distribution of interneuron subtypes in mouse barrel cortex. Fluorescent images are of slices made in the thalamocortical plane from PV- tdTomato, SOM-tdTomato, VIP-tdTomato, and NPY-GFP mice. Lines indicate cortical layers. Dotted line indicates pia. Scale bars, 200 μm.
Figure 2.
Figure 2.
Intrinsic properties of pyramidal cells and interneurons in barrel cortex. Representative voltage traces represent responses to hyperpolarizing and two levels of depolarizing suprathreshold current pulses. Spikes in the rebound burst in the L5 SOM cell are truncated (indicated by an asterisk).
Figure 3.
Figure 3.
Properties of spontaneous and evoked Up states. A, Implementation of the offline algorithm for detecting Up and Down state transitions in a L5 pyramidal cell. Green trace represents a “fast” exponential moving average. Red trace represents a “slow” exponential moving average. The points of intersection of these two traces are considered the Up state initiation and termination times. Action potentials are truncated. B, Up states recorded in voltage clamp at different holding potentials from an L5 pyramidal cell. C, Up state duration was not correlated with age (n = 20, P14; n = 20, P15; n = 18, P16; n = 7, P17; n = 15, P18; n = 13, P19). Error bars indicate SD. D, Up state frequency was not correlated with age (n = 10, P14; n = 9, P15; n = 9, P16; n = 8, P17; n = 8, P18; n = 10, P19). Error bars indicate SD. E, Examples of spontaneous and electrically evoked Up states recorded in the same L5 pyramidal cell. Insets, Magnification of traces near the Up state onset. Action potentials are truncated. F, Comparisons of spontaneous and electrically evoked Up states in L5 and L2/3 pyramidal cells. Data from single cells are paired. The only significant difference between spontaneous and evoked Up states was in the excitatory current (n = 22, duration; n = 13, depolarization; n = 13, firing rate; n = 9 excitatory current; n = 9, inhibitory current).
Figure 4.
Figure 4.
Properties of Up states in pyramidal cells. Representative voltage traces show the subthreshold and spiking responses of pyramidal cells in layers 5 and 2/3. Two different IB cells are shown: one did not spike during the Down state, and the other did spike during the Down state. Solid black line underneath traces indicates Up states. RS, Regular spiking; IB, intrinsic bursting. Action potentials are truncated to show subthreshold behavior. Insets under IB traces, Spiking behavior during Up states.
Figure 5.
Figure 5.
Properties of Up states in interneurons. Representative voltage traces show the subthreshold and spiking responses of PV and SOM cells in layers 5 and 2/3 and VIP and NPY cells in layer 2/3. For the L5 and L2/3 SOM cells, two different SOM cells are shown: one did not spike during the Down state, and one did spike during the Down state. Solid black line indicates Up states. Action potentials are truncated to show subthreshold behavior.
Figure 6.
Figure 6.
Firing rates of pyramidal cells and interneurons during Up states A, Mean total firing rates of pyramidal cells and interneurons. Error bars indicate SEM. B, Mean time-dependent firing rates of pyramidal cells and interneurons. Firing rates are plotted as a function of the fraction of the Up state (i.e., the time axis is normalized from 0 to 1 to average across recordings with different Up-state durations). Dashed lines underneath waveforms for SOM cells and L5 IB pyramidal cells indicate mean Down state firing rates (Down state firing rates for all other cell types are zero). Note the different firing-rate axis for PV cells and L5 IB cells. Shading represents SEM. The following comparisons were significant (Kruskal–Wallis test, Bonferroni correction): RL5 Pyr, RS > RL2/3 Pyr (p = 7.6 × 10⁻⁵), RL5 Pyr, RS < RL5 PV (p = 8.8 × 10⁻¹¹), RL5 Pyr, RS < RL2/3 PV (p = 2.3 × 10⁻⁴), RL5 Pyr, RS > RL2/3 NPY (p = 0.032), RL2/3 Pyr < RL5 PV (p = 2.5 × 10⁻¹⁵), RL2/3 Pyr < RL2/3 PV (p = 8.5 × 10⁻⁸), RL2/3 Pyr < RL5 SOM (p = 1.1 × 10⁻⁶), RL2/3 Pyr < RL2/3 SOM (p = 4.1 × 10⁻⁷), RL5 PV > RL5 SOM (p = 9.3 × 10⁻⁶), RL5 PV > RL2/3 SOM (p = 1.2 × 10⁻⁸), RL5 PV > RL2/3 VIP (p = 6.9 × 10⁻⁸), RL5 PV > RL2/3 NPY (p = 6.7 × 10⁻¹⁰), RL2/3 PV > RL5 SOM (p = 0.038), RL2/3 PV > RL2/3 SOM (p = 0.0011), RL2/3 PV > RL2/3 VIP (p = 0.0036), RL2/3 PV > RL2/3 NPY (p = 2.0 × 10⁻⁴), RL5 SOM > RL2/3 NPY (p = 0.0019), RL2/3 SOM > RL2/3 NPY (p = 0.0060).
Figure 7.
Figure 7.
Membrane potential dynamics of pyramidal cells and interneurons during Up states. A, Mean total membrane potential SDs of pyramidal cells and interneurons. Up-state membrane potential SDs are expressed as multiples of Down-state membrane potential SDs (e.g., a value of σUpDown = 5 indicates that the membrane potential SD was 5 times higher during the Up state than during the Down state). Error bars indicate SEM. B, Mean time-dependent SDs of the membrane potential of pyramidal cells and interneurons. SDs are plotted as a function of the fraction of the Up state (i.e., the time axis is normalized from 0 to 1 to average across recordings with different Up-state durations). Shading represents SEM. The following comparisons were significant (Kruskal–Wallis test, Bonferroni correction): σL5 Pyr, RS < σL2/3 PV (p = 0.0018), σL5 Pyr, RS > σL2/3 SOM (0.0030), σL5 Pyr, RS > σL2/3 VIP (0.011), σL2/3 Pyr > σL2/3 PV (3.0 × 10⁻⁴), σL2/3 Pyr > σL5 SOM (0.0030), σL2/3 Pyr > σL2/3 SOM (2.9 × 10⁻⁴), σL2/3 Pyr > σL2/3 VIP (3.9 × 10⁻⁵), σL2/3 Pyr > σL2/3 NPY (0.017), σL5 PV > σL2/3 PV (7.3 × 10⁻⁴), σL5 PV > σL2/3 SOM (0.0037), σL5 PV > σL2/3 VIP (0.015), σL2/3 PV > σL5 SOM (2.3 × 10⁻⁶), σL2/3 PV > σL2/3 SOM (4.8 × 10⁻⁹), σL2/3 PV > σL2/3 VIP (7.0 × 10⁻¹⁰), σL2/3 PV > σL2/3 NPY (1.7 × 10⁻⁸).
Figure 8.
Figure 8.
Membrane potential correlations between pyramidal cells and interneurons. A, Mean, peak shuffle-corrected cross-correlations for pyramidal–interneuron pairs (i.e., the mean shuffled peak cross-correlation value subtracted from the mean raw peak cross-correlation value). Error bars indicate SEM. B, Cross-correlograms of membrane potential fluctuations from paired recordings of pyramidal cells and interneurons. Solid black line indicates raw cross-correlations. Dashed black line indicates shuffled cross-correlations. Green and red traces above correlograms are representative voltage traces from paired recordings of the indicated pyramidal cells and interneurons. Action potentials are truncated, and traces are aligned to their baseline voltage. Shading represents SEM. The following comparisons were significant (Kruskal–Wallis test, Bonferroni correction): CCL2/3 Pyr-SOM < CCL2/3 Pyr-NPY (p = 0.047).
Figure 9.
Figure 9.
Excitatory and inhibitory conductances in pyramidal cells and interneurons during Up states. A, Mean total excitatory and inhibitory conductances of pyramidal cells and interneurons. Error bars indicate SEM. B, Mean time-dependent excitatory (green) and inhibitory (red) conductances, calculated from voltage-clamp recordings. Conductances are plotted as a function of the fraction of the Up state (i.e., the time axis is normalized from 0 to 1 to average across recordings with different Up-state durations). Shading represents SEM. The following comparisons of excitatory and inhibitory conductances within cell types were significant (Mann–Whitney test): GeL5 Pyr < GiL5 Pyr (p = 0.0019), GeL2/3 Pyr < GiL2/3 Pyr (p = 0.036), GeL5 PV > GiL5 PV (p = 0.0020), GeL2/3 PV > GiL2/3 PV (p = 6.3 × 10⁻⁵), GeL5 SOM > GiL5 SOM (p = 0.0013), GeL2/3 NPY < GiL2/3 NPY (p = 0.05). The following comparisons of excitatory conductances among cell types were significant (Kruskal–Wallis test, Bonferroni correction): GeL5 Pyr < GeL2/3 PV (p = 7.6 × 10⁻⁴), GeL2/3 Pyr > GeL2/3 VIP (p = 0.017), GeL2/3 Pyr > GeL2/3 NPY (p = 0.039), GeL5 PV > GeL2/3 VIP (p = 0.0020), GeL2/3 PV > GeL5 SOM (p = 0.013), GeL2/3 PV > GeL2/3 SOM (p = 9.3 × 10⁻⁴), GeL2/3 PV > GeL2/3 VIP (p = 6.5 × 10⁻⁵), GeL2/3 PV > GeL2/3 NPY (p = 0.0060). The following comparisons of inhibitory conductances among cell types were significant (Kruskal–Wallis test, Bonferroni correction): GiL5 Pyr > GiL5 PV (p = 0.0010), GiL5 Pyr > GiL2/3 PV (p = 1.1 × 10⁻⁴), GiL5 Pyr > GiL5 SOM (p = 5.6 × 10⁻⁷), GiL5 Pyr > GiL2/3 SOM (p = 1.7 × 10⁻⁵), GiL5 Pyr > GiL2/3 VIP (p = 5.4 × 10⁻⁴), GiL2/3 Pyr > GiL5 PV (p = 0.0013), GiL2/3 Pyr > GiL2/3 PV (p = 5.8 × 10⁻⁴), GiL2/3 Pyr > GiL5 SOM (p = 1.60 × 10⁻⁶), GiL2/3 Pyr > GiL2/3 SOM (p = 2.2 × 10⁻⁵), GiL2/3 Pyr > GiL2/3 VIP (p = 4.6 × 10⁻⁴).
Figure 10.
Figure 10.
Comparisons of Up states in pyramidal cells and interneurons between barrel cortex and entorhinal cortex. A, Comparisons of mean total firing rates in pyramidal cells, PV cells, SOM cells, and VIP cells in L2/3 between barrel cortex and entorhinal cortex. Error bars indicate SEM. The following comparisons were significant (Mann–Whitney test): RPyr, entorhinal > RPyr, barrel (p = 0.032), RSOM, entorhinal < RSOM, barrel (p = 0.0070), RVIP, entorhinal < RVIP, barrel (p = 0.00029). B, Comparisons of mean total excitatory and inhibitory conductances in pyramidal cells, PV cells, and VIP cells in L2/3 between barrel cortex and entorhinal cortex. Error bars indicate SEM. The following comparisons were significant (Mann–Whitney test): Ge, Pyr, entorhinal < Ge, Pyr, barrel (p = 0.034), Ge, VIP, entorhinal < Ge, VIP, barrel (p = 0.00023), Gi, Pyr, entorhinal < Gi, Pyr, barrel (p = 0.0067), Gi, VIP, entorhinal < Gi, VIP, barrel (p = 0.013).
Figure 11.
Figure 11.
Analysis of fluorescent FS cells in the SOM-tdTomato animal. A, B, Voltage traces of non-FS and FS SOM cells (i.e., fluorescent cells in the SOM- tdTomato animal) as evidenced by intrinsic properties and behavior during Up states (9 of15 recorded fluorescent cells had a FS phenotype). Action potentials during the Up state in B are truncated. C, Representative PV-immunostained slices from barrel cortex and entorhinal cortex from the SOM-tdTomato animal. White arrowheads indicate colabeled cells. Note the substantial overlap of PV (green) and tdTomato (red) in entorhinal cortex but minimal overlap in barrel cortex. Scale bars, 200 μm. D, Percentage colocalization of PV with tdTomato in the SOM-tdTomato animal in barrel cortex and entorhinal cortex (n = 2 animals, 21 slices, 549 counted PV cells, 460 counted tdTomato cells, P19, for barrel cortex; n = 2 animals, 25 slices, 654 counted PV cells, 1441 counted tdTomato cells P19, for entorhinal cortex).

References

    1. Agmon A, Connors BW. Thalmocortical responses of mouse somatosensory (barrel) cortex in vitro. Neuroscience. 1991;41:365–379. doi: 10.1016/0306-4522(91)90333-J. - DOI - PubMed
    1. Avermann M, Tomm C, Mateo C, Gerstner W, Petersen CC. Microcircuits of excitatory and inhibitory neurons in layer 2/3 of mouse barrel cortex. J Neurophysiol. 2012;107:3116–3134. doi: 10.1152/jn.00917.2011. - DOI - PubMed
    1. Beierlein M, Gibson JR, Connors BW. Two dynamically distinct inhibitory networks in layer 4 of the neocortex. J Neurophysiol. 2003;90:2987–3000. doi: 10.1152/jn.00283.2003. - DOI - PubMed
    1. Beltramo R, D'Urso G, Dal Maschio M, Farisello P, Bovetti S, Clovis Y, Lassi G, Tucci V, De Pietri Tonelli D, Fellin T. Layer-specific excitatory circuits differentially control recurrent network dynamics in the neocortex. Nat Neurosci. 2013;16:227–234. doi: 10.1038/nn.3306. - DOI - PubMed
    1. Borg-Graham LJ, Monier C, Frégnac Y. Visual input evokes transient and strong shunting inhibition in visual cortical neurons. Nature. 1998;393:369–373. doi: 10.1038/30735. - DOI - PubMed

Publication types

LinkOut - more resources