. 2015 Jan 21;11(1):773.
doi: 10.15252/msb.20145264.

Essential gene disruptions reveal complex relationships between phenotypic robustness, pleiotropy, and fitness

Affiliations

Essential gene disruptions reveal complex relationships between phenotypic robustness, pleiotropy, and fitness

Christopher R Bauer et al. Mol Syst Biol. .

Abstract

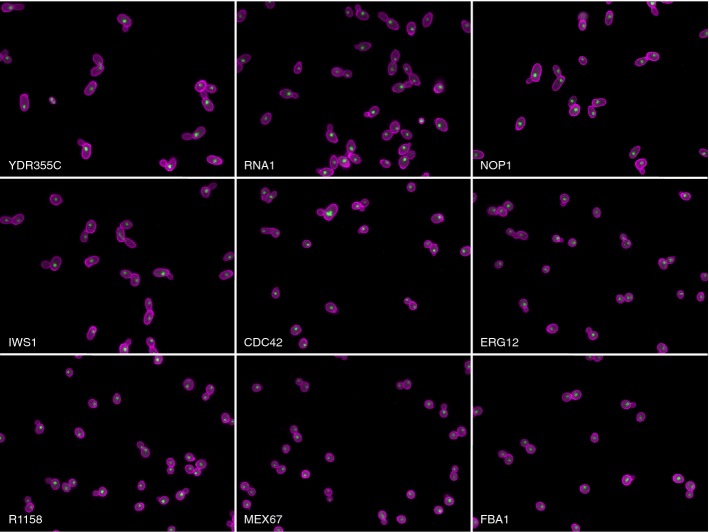
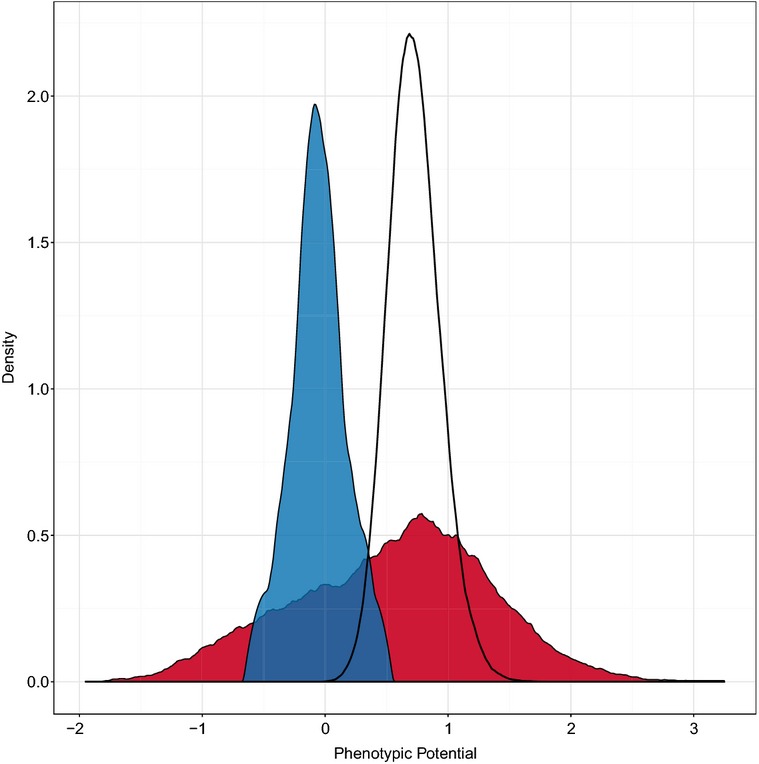
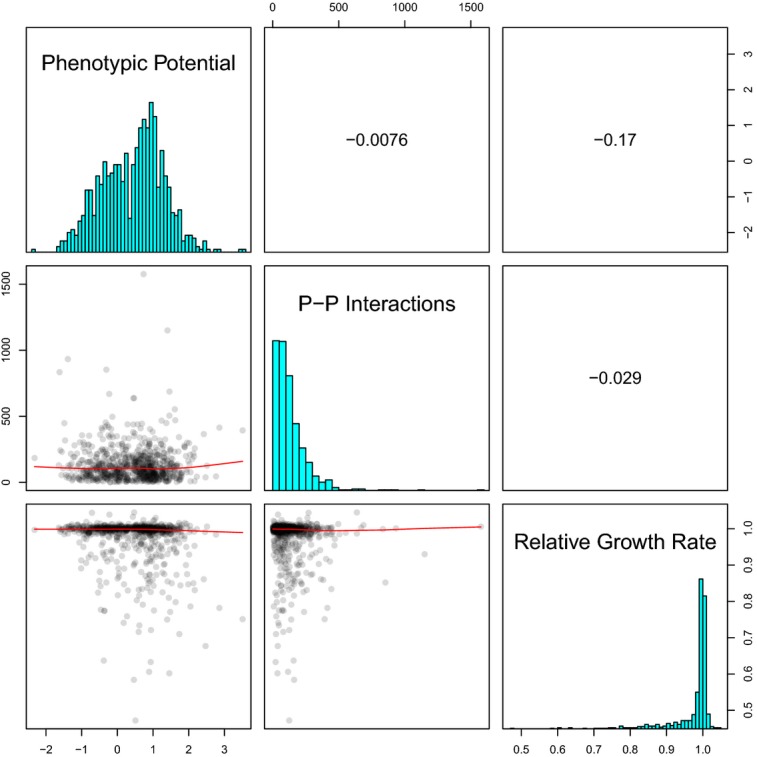
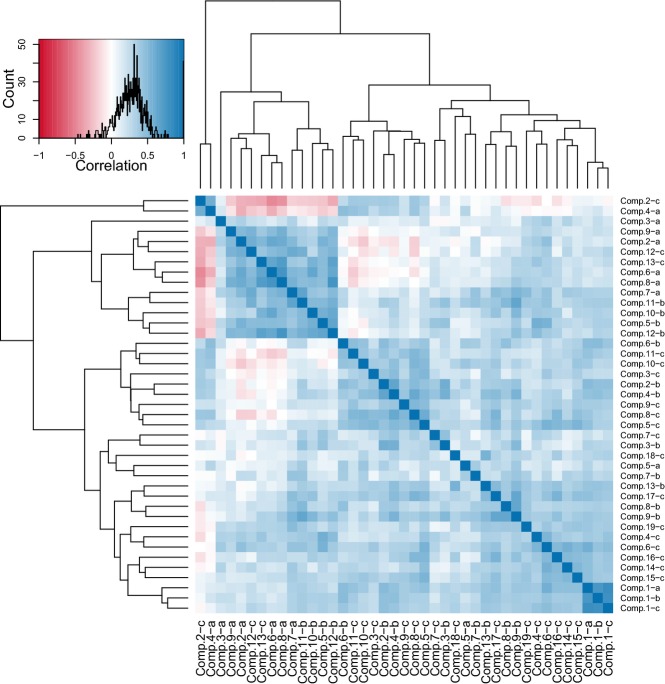
The concept of robustness in biology has gained much attention recently, but a mechanistic understanding of how genetic networks regulate phenotypic variation has remained elusive. One approach to understand the genetic architecture of variability has been to analyze dispensable gene deletions in model organisms; however, the most important genes cannot be deleted. Here, we have utilized two systems in yeast whereby essential genes have been altered to reduce expression. Using high-throughput microscopy and image analysis, we have characterized a large number of morphological phenotypes, and their associated variation, for the majority of essential genes in yeast. Our results indicate that phenotypic robustness is more highly dependent upon the expression of essential genes than on the presence of dispensable genes. Morphological robustness appears to be a general property of a genotype that is closely related to pleiotropy. While the fitness profile across a range of expression levels is idiosyncratic to each gene, the global pattern indicates that there is a window in which phenotypic variation can be released before fitness effects are observable.

Keywords: heterogeneity; pleiotropy; robustness; variation.


Figures

Figure 1
Figure 1
Example images of mutants with high or low levels of phenotypic variation Cell walls are labeled with FITC-conjugated concanavalin A (magenta) and nuclei are labeled with DAPI (green). DAmP-YDR355C (phenotypic potential = 3.25), DAmP-RNA1 (phenotypic potential = 1.81), DAmP-NOP1 (phenotypic potential = 3.07), DAmP-IWS1 (phenotypic potential = 2.14), DAmP-CDC42 (phenotypic potential = 2.54), and DAmP-ERG12 (phenotypic potential = 1.61) are all high-confidence phenotypic stabilizers. R1158 (phenotypic potential = −0.05) does not contain any essential gene mutations. DAmP-MEX67 (phenotypic potential = −1.42) and DAmP-FBA1 (phenotypic potential = −1.01) are DAmP strains that display low phenotypic variation.
Figure 2
Figure 2
Distribution of phenotypic potential scores A kernel density plot of the phenotypic potential scores from all DAmP strains is shown in red. Random permutation of the same dataset yields the probability density of phenotypic potentials shown as the black curve. In blue is the distribution of phenotypic potentials from a wild-type control strain.
Figure 3
Figure 3
Correlations between phenotypic potential, the number of protein–protein interactions from BioGRID, and the published relative growth rates The lower-left panels show the pairs of variables plotted against each other with the red lines indicating loess regressions. The diagonal panels display the underlying distributions of each metric. The upper right panels show the Pearson correlation coefficients for each comparison.
Figure 4
Figure 4
Pairwise correlations between phenotype standard deviations Each strain in the DAmP collection was assigned a mean adjusted standard deviation for each of the top 41 principal components. The distribution of correlation coefficient values between the standard deviations of each pair of phenotypes, across all strains, is shown in the upper left panel. The intensity of the blue shading in the heat map indicates the degree of positive correlation, while that of red shading indicates the degree of negative correlation. The dark blue cluster in the bottom right corner are the first principal components from unbudded (a) small budded (b) and large budded (c) cell categories, which all correlate strongly with cell size. Components 2-c and 4-a are measures of the position of the nucleus within the cell and are the only two phenotypes with standard deviations that tend to correlate negatively with other phenotype standard deviations. The dendrograms were determined by hierarchical clustering.
Figure 5
Figure 5
Relationship between pleiotropy and phenotypic potential For each DAmP strain, the number of phenotypes that differ from the wild-type reference by at least one standard deviation are plotted on the x-axis. A small amount of noise was added to prevent overplotting. Phenotypic potential scores are plotted along the y-axis. The blue line indicates the result of a loess regression.
Figure 6
Figure 6
Relationship between phenotypic potential and fitness Within each panel, the 48 DAmP strains with the lowest phenotypic potentials were grouped on the left and compared to the 48 DAmP strains with the highest phenotypic potentials, grouped on the right. Microcolony-based measurement of mean growth rate is plotted in the left panel. Standard deviation of growth rate is plotted in the middle panel. The percentage of dead cells in the population is plotted in the right panel.
Figure 7
Figure 7
Phenotypic variation and growth rates in Tet-repressible strains In the top panel, all phenotypic potential scores are plotted against microcolony growth rates for all Tet strains across all concentrations of doxycycline. The points are shaded to indicate the concentration of doxycycline ranging from zero (purple) to 20 μg/ml (green). The lower panels show the dynamics of eight individual genes. In each case, the levels of doxycycline range from zero on the far left to 20 μg/ml on the far right. Box plots show the distributions of growth rates observed with color shading to indicate the observed phenotypic potential (blue = low variation, red = high variation, white boxes indicate too few cells to calculate a phenotypic potential, and the absence of a box indicates fewer than 10 colonies observed).

References

    1. Aldridge BB, Fernandez-Suarez M, Heller D, Ambravaneswaran V, Irimia D, Toner M, Fortune SM. Asymmetry and aging of mycobacterial cells lead to variable growth and antibiotic susceptibility. Science. 2012;335:100–104. - PMC - PubMed
    1. Balaban NQ, Merrin J, Chait R, Kowalik L, Leibler S. Bacterial persistence as a phenotypic switch. Science. 2004;305:1622–1625. - PubMed
    1. Bergman A, Siegal ML. Evolutionary capacitance as a general feature of complex gene networks. Nature. 2003;424:549–552. - PubMed
    1. Boeger H, Griesenbeck J, Kornberg RD. Nucleosome retention and the stochastic nature of promoter chromatin remodeling for transcription. Cell. 2008;133:716–726. - PMC - PubMed
    1. Breslow DK, Cameron DM, Collins SR, Schuldiner M, Stewart-Ornstein J, Newman HW, Braun S, Madhani HD, Krogan NJ, Weissman JS. A comprehensive strategy enabling high-resolution functional analysis of the yeast genome. Nat Methods. 2008;5:711–718. - PMC - PubMed

Publication types