

Wnt activity and basal niche position sensitize intestinal stem and progenitor cells to DNA damage
- PMID: 25609789
- PMCID: PMC4365032
- DOI: 10.15252/embj.201490700
Wnt activity and basal niche position sensitize intestinal stem and progenitor cells to DNA damage
Erratum in
-
Wnt activity and basal niche position sensitize intestinal stem and progenitor cells to DNA damage.EMBO J. 2017 Oct 2;36(19):2920-2921. doi: 10.15252/embj.201797813. EMBO J. 2017. PMID: 28971845 Free PMC article.
Abstract
Aging and carcinogenesis coincide with the accumulation of DNA damage and mutations in stem and progenitor cells. Molecular mechanisms that influence responses of stem and progenitor cells to DNA damage remain to be delineated. Here, we show that niche positioning and Wnt signaling activity modulate the sensitivity of intestinal stem and progenitor cells (ISPCs) to DNA damage. ISPCs at the crypt bottom with high Wnt/β-catenin activity are more sensitive to DNA damage compared to ISPCs in position 4 with low Wnt activity. These differences are not induced by differences in cell cycle activity but relate to DNA damage-dependent activation of Wnt signaling, which in turn amplifies DNA damage checkpoint activation. The study shows that instructed enhancement of Wnt signaling increases radio-sensitivity of ISPCs, while inhibition of Wnt signaling decreases it. These results provide a proof of concept that cell intrinsic levels of Wnt signaling modulate the sensitivity of ISPCs to DNA damage and heterogeneity in Wnt activation in the stem cell niche contributes to the selection of ISPCs in the context of DNA damage.
Keywords: DNA damage; Wnt; intestinal progenitor cells; intestinal stem cells; telomeres.
© 2015 The Authors. Published under the terms of the CC BY NC ND 4.0 license.
Figures
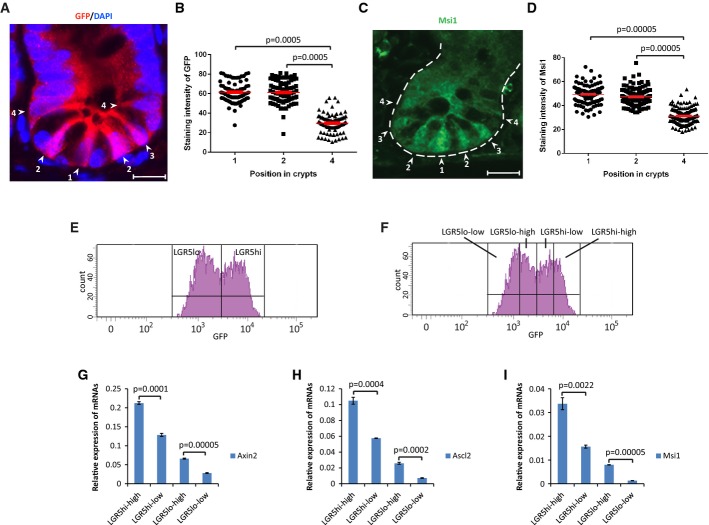
A Representative immunofluorescence staining of GFP of small intestinal tissue of LGR5-GFP knock-in (LGR5-GFPki) mice. Arrowheads and numbers indicate ISPC positions in the crypts. Scale bar: 20 μm.
B Quantification of GFP staining intensity of intestinal stem and progenitor cells (ISPCs) at indicated positions in basal crypts of LGR5-GFPki mice (n = 80 crypts from four mice). Each dot presents one cell. Red lines: mean values ± SEM. Unpaired two-tailed Student's t-test.
C Representative immunofluorescence staining of Msi1 of small intestinal tissue of young mTerc+/+ mice. Dashed line outlines a crypt. Arrowheads and numbers indicate ISPC positions in the crypts. Scale bar: 20 μm.
D Quantification of Msi1 staining intensity of ISPCs at indicated positions in basal crypts of young mTerc+/+ mice (n = 150 crypts from three mice). Each dot presents one cell. Red lines: mean values ± SEM. Unpaired two-tailed Student's t-test.
E Representative FACS plots showing gating of LGR5hi and LGR5lo populations within the LGR5+ (GFP-positive) cell gating.
F Representative FACS plots showing gating of LGR5hi-high, LGR5hi-low, LGR5lo-high, and LGR5lo-low populations within the LGR5hi gating.
G-I mRNA expression of indicated genes relative to GAPDH in LGR5hi-high, LGR5hi-low, LGR5lo-high, and LGR5lo-low populations (n = 3 mice). Mean values ± SEM are given. Unpaired two-tailed Student's t-test.

A mRNA expression of indicated components of the canonical Wnt/β-catenin pathway in freshly isolated small intestinal crypts of 12- to 16-month-old G3 mTerc−/− mice and age-matched mTerc+/+ mice (n = 5 mice per group).
B Axin2 mRNA expression in LGR5+ cells of 12- to 16-month-old G3 mTerc−/− mice and mTerc+/+ mice (n = 3 mice per group).
C mRNA expression of indicated components of the canonical Wnt/β-catenin pathway and of the p53 target gene p21 in cultured crypts of 2-month-old G3 mTerc−/− mice and mTerc+/+ mice (n = 3 mice per group).
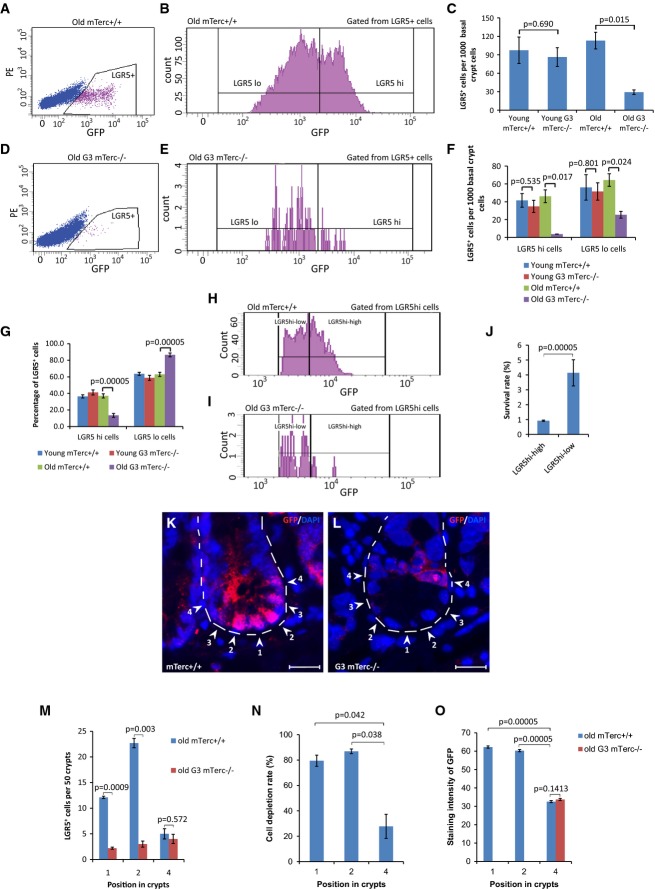
A-J Flow cytometry analysis of freshly isolated crypt cells from the small intestine of young (2–3 month) and old (12–16 month) LGR5-GFPki, mTerc+/+ mice and LGR5-GFPki, G3 mTerc−/− mice (n = 4 mice per group). (A, B, D, E, H, I) Representative FACS plots depicting the analysis of LGR5+ cells. Note the reduction in LGR5+ cells in G3 mTerc−/− mice with the remaining cells showing almost exclusively weak expression of GFP (LGR5lo) and that within the fraction of LGR5hi cells, the cells with high LGR5-reporter activity (LGR5hi-high) are preferentially depleted in response to IR. (C, F) Quantification of (C) the number of LGR5+ cells and (F) the number of LGR5hi and LGR5lo cells. (G) Quantification of the percentage of LGR5hi cells and LGR5lo cells within the fraction of LGR5+ cells. (J) Quantification of the survival rate of LGR5hi-high cells and LGR5hi-low cells within the fraction of LGR5hi cells comparing old G3 mTerc−/− mice to mTerc+/+ mice.
K-O Immunofluorescence staining of GFP in basal crypts of 9-month-old LGR5-GFPki, G3 mTerc−/− mice and age-matched LGR5-GFPki, mTerc+/+ mice (n = 2 mice per group). (K, L) Representative pictures are given. Dashed lines outline the crypts. Arrowheads and numbers indicate ISPC positions in the crypts. Scale bar: 20 μm. (M) Quantification of absolute number of GFP+ ISPCs at indicated positions at the crypt base per 50 crypts. (N) The histogram depicts the depletion rate (%) of LGR5+ cells in LGR5-GFPki, G3 mTerc−/− mice compared to age-matched LGR5-GFPki, mTerc+/+ mice at indicated positions in the basal crypts. (O) Quantification of GFP staining intensity of ISPCs at indicated positions in positively stained basal crypts. Note that the staining intensity of position 4 cells is equal in mTerc+/+ mice and G3 mTerc−/− mice and is significantly lower than position 1 and 2 cells of mTerc+/+ mice.
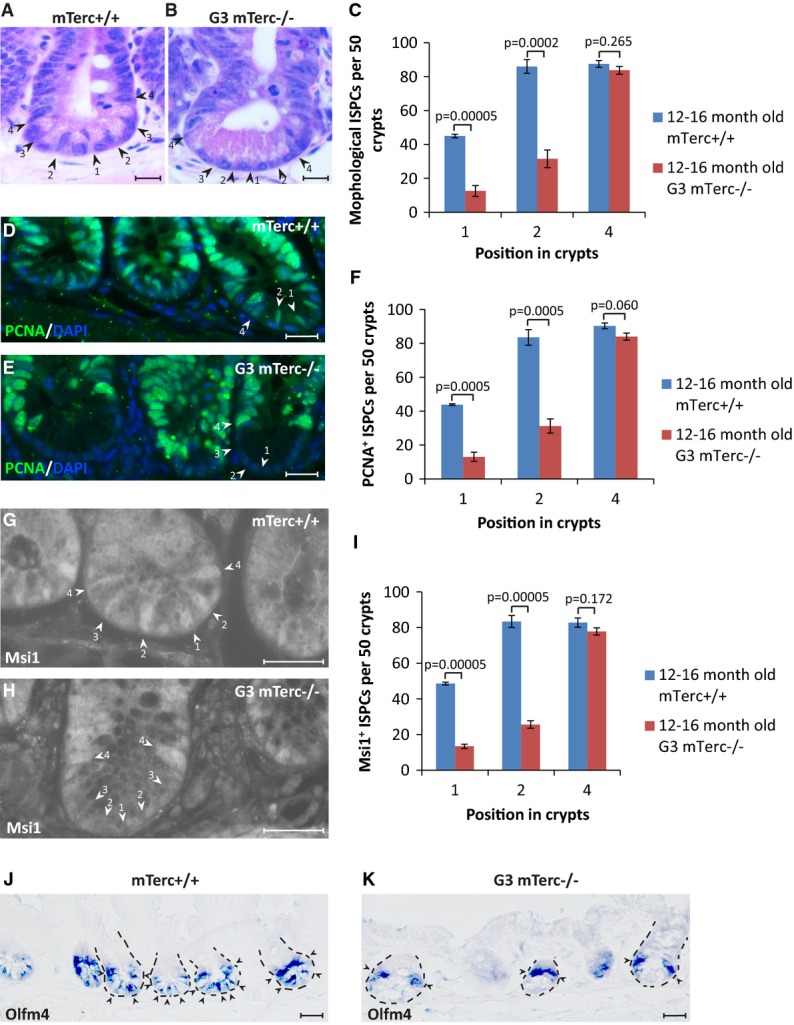
A-I Staining of small intestinal tissue sections of 12- to 16-month-old G3 mTerc−/− mice and age-matched mTerc+/+ mice (n = 4–5 mice per group). Representative pictures of (A, B) H&E staining, (D, E) PCNA staining, and (G, H) Msi1 staining are given. Arrowheads and numbers indicate the position of ISPCs in the basal crypts. Scale bars: 20 μm. (C, F, I) Quantification of the absolute numbers of ISPCs at the indicated positions in the crypt base per 50 crypts as determined by counting of (C) spindle-shaped cells in between and adjacent to the Paneth cells, cells staining positive for (F) PCNA or (I) Msi1. Mean values ± SEM are given. Unpaired two-tailed Student's t-test.
J-K Representative pictures of Olfm4 in situ hybridization on small intestinal sections of 9-month-old G3 mTerc−/− mice (K) and age-matched mTerc+/+ (J) mice. Arrowheads point to positive cells. Dashed lines outline the crypts. Note that the remaining ISPCs in G3 mTerc−/− mice were mostly located in position 4 above the Paneth cells. Scale bar: 20 μm.
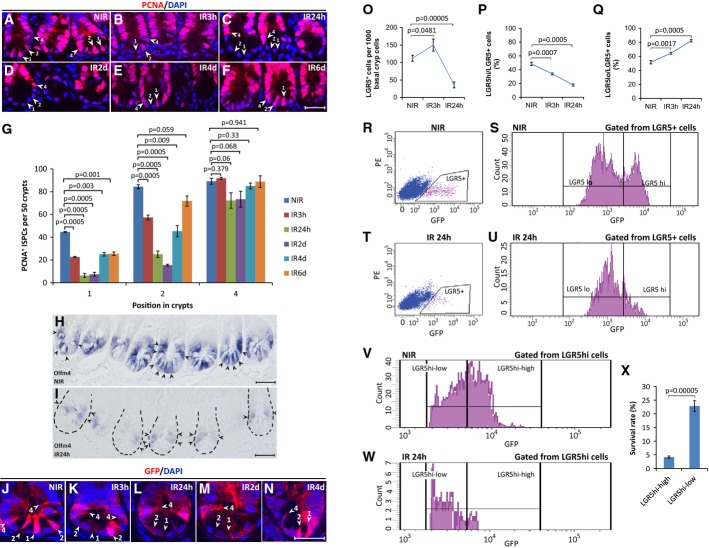
A-I Three-month-old mTerc+/+ mice were exposed to 12 Gy γ-irradiation. Small intestinal tissue was collected at indicated time points after IR (n = 5 mice per group). (A–F) Representative pictures of PCNA staining. Arrowheads and numbers indicate ISPC positions in the crypts. Scale bar: 20 μm. Note the depletion of PCNA+ CBC cells in position 1 and 2 in between the Paneth cells at 3–48 h after IR and the regeneration of these cells at 4–6 days after IR. (G) Quantification of PCNA+ ISPCs at the indicated positions in basal crypts at the indicated time points after IR. Mean values ± SEM are given. (H, I) Representative pictures of Olfm4 in situ hybridization. Arrowheads point to positive cells. Dashed lines outline the crypts in irradiated samples. Scale bar: 20 μm. Note the selective survival of ISPCs above the Paneth cells at 24 h after IR.
J-X Three-month-old LGR5-GFPki, mTerc+/+ mice were exposed to 12 Gy γ-irradiation. Small intestinal tissue was collected at indicated time points after IR. (J–N) Representative pictures of GFP staining at indicated time points after irradiation. Arrowheads and numbers indicate ISPC positions in the crypts. Scale bar: 20 μm. (O–X) Flow cytometry analysis of freshly isolated basal crypt cells at the indicated time points after IR (n = 4–10 mice per group). (O) The histogram depicts the number of LGR5+ cells in freshly isolated basal crypts at the indicated time point after IR. (P, Q) Flow cytometry analysis was used to determine the percentage of (P) LGR5hi cells and (Q) LGR5lo cells within the fraction of LGR5+ cells. (R-W) Representative FACS plots of small intestinal crypt cells of non-irradiated mice, 24 h after irradiation. Note the reduction in LGR5+ cell in irradiated mice with the remaining cells showing almost exclusively weak expression of GFP (LGR5lo). (X) Quantification of the survival rate of LGR5hi-high cells and LGR5hi-low cells within the fraction of LGR5hi cells comparing irradiated mice to non-irradiated mice. Note the preferential depletion of LGR5hi-high cells within LGR5hi cell population upon IR. Mean values ± SEM are given. NIR, non-irradiated; IR, irradiated.

A mRNA gene expression analysis by microarray. The figure shows the number of differentially expressed genes (#dg) and the median absolute fold change (med. Abs. FC) for genes that are regulated in both LGR5hi cells and LGR5lo cells in response to IR (n = 4–5 samples per group). NIR, non-irradiated; IR, irradiated. Wilcoxon test.
B, C LGR5hi and LGR5lo cells were freshly isolated from 3-month-old LGR5-GFPki mice 6 h after 12 Gy γ-irradiation (IR) or from non-irradiated (NIR) mice (n = 3 mice per group). (B) qPCR analysis of relative mRNA expression of apoptosis-related genes compared to GAPDH. Mean values ± SEM are given. Unpaired two-tailed Student's t-test. (C) Representative Western blot analysis of cell lysates for the expression of phospho-p53 and cleaved caspase-3.
D, E Three-month-old mTerc+/+ mice were γ-irradiated with 12 Gy. Small intestinal tissue was collected at 3 h after IR (n = 3 mice per group). (D) Representative picture of TUNEL staining. Arrowheads and numbers indicate ISPC positions in the crypts. Scale bar: 20 μm. (E) Percentage of TUNEL-positive ISPCs at indicated positions in basal crypts. Mean values ± SEM are given. Unpaired two-tailed Student's t-test.
F, P Two-month-old LGR5-GFPki, p53+/+ mice and LGR5-GFPki, p53−/− mice were exposed to 12 Gy γ-irradiation (n = 4 mice per group). Basal crypts were isolated at 24 h after IR. (F–H) Flow cytometry analysis of the survival rate of LGR5+ cells (F), LGR5hi and LGR5lo cells (G), and LGR5hi-high and LGR5hi-low cells (H) of irradiated mice (24 h after IR) compared to non-irradiated mice (NIR). Mean values ± SEM are given. Unpaired two-tailed Student's t-test. (I–P) Representative FACS plots of LGR5+ cells in freshly isolated basal crypts from irradiated and non-irradiated mice of indicated genotypes. Note the stronger rescue of survival rate of LGR5hi-high than the LGR5hi-low cells upon p53 deletion. NIR, non-irradiated; IR, irradiated.

A-J Representative FACS plots of indicated treatments are given. NIR, non-irradiated; IR, irradiated.
K-P Flow cytometry analysis of the percentage of LGR5+, LGR5hi, and LGR5lo cells of irradiated cultures (24 h after IR) compared to the percentage in non-irradiated controls (NIR) set to 100%. (K–M) Note that inhibition of Wnt signaling by DKK1 treatment or R-spondin reduction (50% Rspo) partially rescued the decrease in LGR5+ cells in irradiated cultures. (N–P) Note that activation of Wnt signaling by 6-BIO treatment aggravated the decrease in LGR5+ cells in irradiated cultures. Mean values ± SEM are given. Unpaired two-tailed Student's t-test.

A-G Two-month-old LGR5-GFPki, mTerc+/+ mice were i.v. injected with LRP6 neutralization antibody, and IgG serves as a negative control. Thirty-six hours after injection, small intestinal tissue was collected for GFP immunofluorescence staining. (A–F) Representative pictures are given. Dashed lines outline the crypts. Arrowheads and numbers indicate cell positions in the crypts. Scale bar: 20 μm. (G) Quantification of GFP staining intensity of cells at indicated positions in basal crypts (n = 3 mice per group, fifty positively stained cells were measured per mouse). Note the GFP staining intensity was substantially reduced in anti-LRP6 antibody-injected group with intact maintenance of ISPCs at the crypt bottom as shown by DAPI staining.
H-L Two-month-old mTerc+/+ mice were i.v. injected with anti-LRP6 antibody 12 h before γ-irradiation. Small intestinal tissue was collected at 24 h after IR (n = 3–4 mice per group). IgG serves as a negative control. (H–K) Representative pictures of PCNA staining of small intestine of non-irradiated mice (H, I) or 6 Gy-irradiated mice (J, K). Note the anti-LRP6 antibody injection did not induce loss of CBC cells at position 1 and 2 in non-irradiated mice. Arrowheads and numbers indicate ISPC positions in the crypts. Scale bar: 20 μm. (L) Quantification of PCNA+ ISPCs at the indicated positions in basal crypts 24 h after IR with indicated doses or non-irradiated mice.
M-R Two-month-old LGR5-GFPki, mTerc+/+ mice were i.v. injected with LRP6 neutralization antibody 12 h before 12 Gy γ-irradiation. IgG serves as a negative control. Small intestinal tissue was collected at 24 h after IR (n = 4 mice per group). (M–P) Representative FACS plots of indicated treatments. (Q) Flow cytometry analysis of the number of LGR5+ ISPCs of irradiated mice compared to the number in non-irradiated mice (NIR) set to 100%. (R) Quantification of the number of LGR5+, LGR5hi, and LGR5lo cells of mice with indicated treatment by flow cytometry. Note that the total LGR5+ cell frequency was not significantly different between anti-LRP6 antibody-injected and control IgG-injected mice, though the LGR5hi fraction was reduced in the LRP6 antibody-injected group.

A-C GFP immunofluorescence staining of small intestine from 2-month-old LGR5-GFPki, APC+/+ mice and LGR5-GFPki, APCmin/+ mice. (A) Quantification of GFP staining intensity of cells at indicated positions in basal crypts (n = 3 mice per group, 50 positively stained cells were measured per mouse). Note the GFP staining intensity was increased in APCmin/+ mice, particularly in position 4 and 5 cells. (B, C) Representative pictures are given. Dashed lines outline the crypts. Arrowheads and numbers indicate cell positions in the crypts. Scale bar: 20 μm.
D-F Two-month-old APC+/+ mice and APCmin/+ mice were exposed to 6 Gy γ-irradiation. Small intestinal tissue was collected at 24 h after IR (n = 3 mice per group). (D) Quantification of PCNA+ ISPCs at the indicated positions in basal crypts 24 h after IR. IR, irradiated. (E, F) Representative pictures of PCNA staining are given. Arrowheads and numbers indicate cell positions in the crypts. Scale bar: 20 μm.
G-K Two-month-old LGR5-GFPki, APC+/+ mice and LGR5-GFPki, APCmin/+ mice were exposed to 6 Gy γ-irradiation. Small intestinal tissue was collected at 24 h after IR (n = 4 mice per group). (G) Flow cytometry analysis of the number of LGR5+ ISPCs of irradiated mice compared to the number in non-irradiated mice (NIR) set to 100%. (H–K) Representative FACS plots of indicated groups are given.
References
-
- van Amerongen R, Bowman AN, Nusse R. Developmental stage and time dictate the fate of Wnt/beta-catenin-responsive stem cells in the mammary gland. Cell Stem Cell. 2012;11:387–400. - PubMed
-
- Armanios MY, Chen JJ, Cogan JD, Alder JK, Ingersoll RG, Markin C, Lawson WE, Xie M, Vulto I, Phillips JA, III, Lansdorp PM, Greider CW, Loyd JE. Telomerase mutations in families with idiopathic pulmonary fibrosis. N Engl J Med. 2007;356:1317–1326. - PubMed
-
- Barker N, van Es JH, Kuipers J, Kujala P, van den Born M, Cozijnsen M, Haegebarth A, Korving J, Begthel H, Peters PJ, Clevers H. Identification of stem cells in small intestine and colon by marker gene Lgr5. Nature. 2007;449:1003–1007. - PubMed
-
- Barker N, Ridgway RA, van Es JH, van de Wetering M, Begthel H, van den Born M, Danenberg E, Clarke AR, Sansom OJ, Clevers H. Crypt stem cells as the cells-of-origin of intestinal cancer. Nature. 2009;457:608–611. - PubMed
-
- Barker N, van Oudenaarden A, Clevers H. Identifying the stem cell of the intestinal crypt: strategies and pitfalls. Cell Stem Cell. 2012;11:452–460. - PubMed
Publication types
MeSH terms
LinkOut - more resources
Full Text Sources
Other Literature Sources
Medical
Molecular Biology Databases
