. 2015 Apr;89(7):3846-58.
doi: 10.1128/JVI.03647-14. Epub 2015 Jan 21.

Characterization of hepatitis C virus interaction with heparan sulfate proteoglycans

Affiliations

Characterization of hepatitis C virus interaction with heparan sulfate proteoglycans

Yan Xu et al. J Virol. 2015 Apr.

Abstract

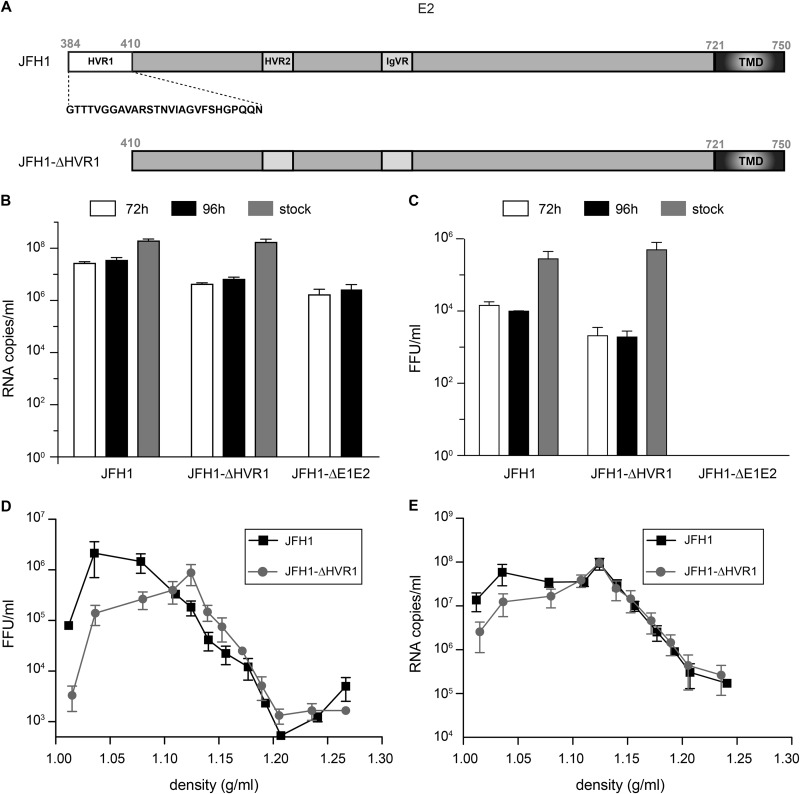
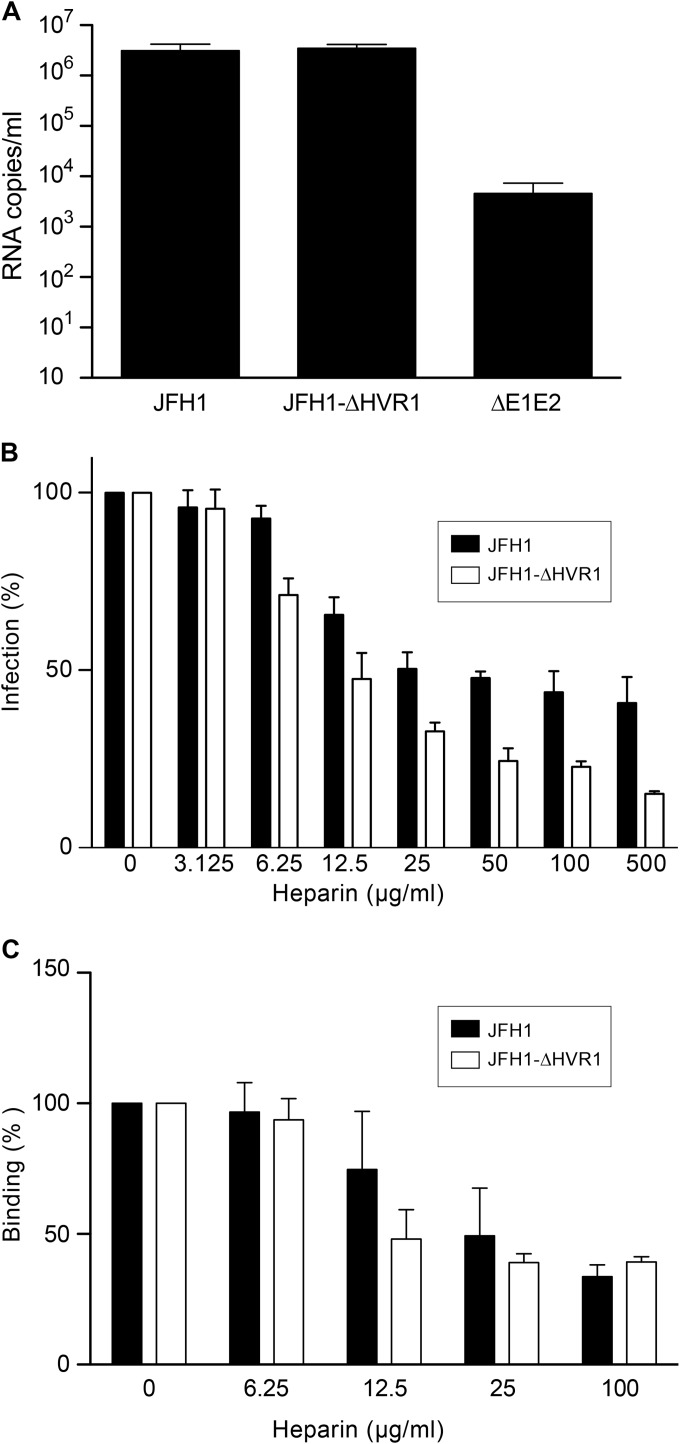
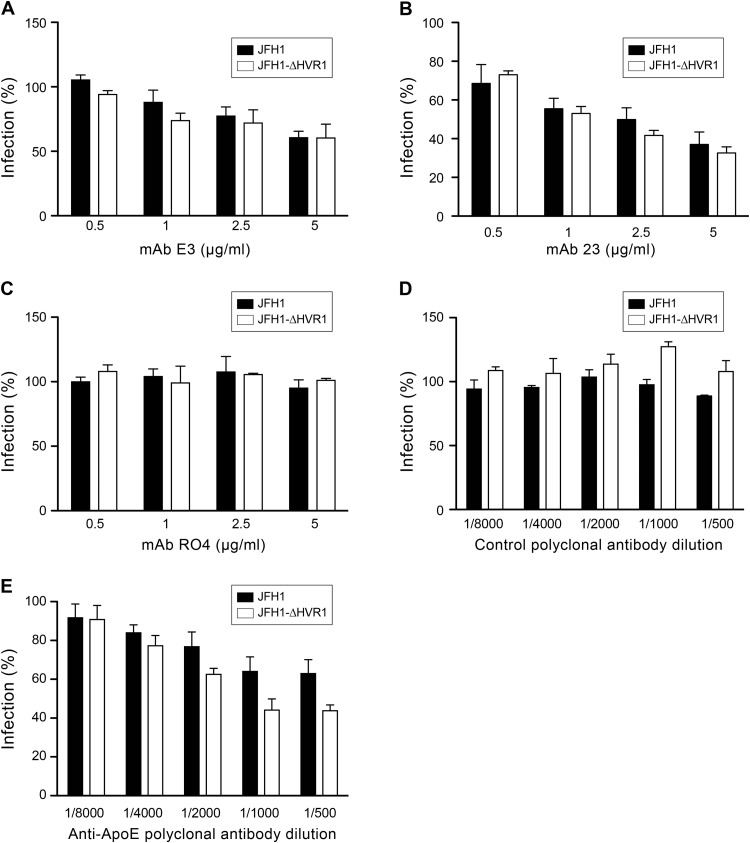
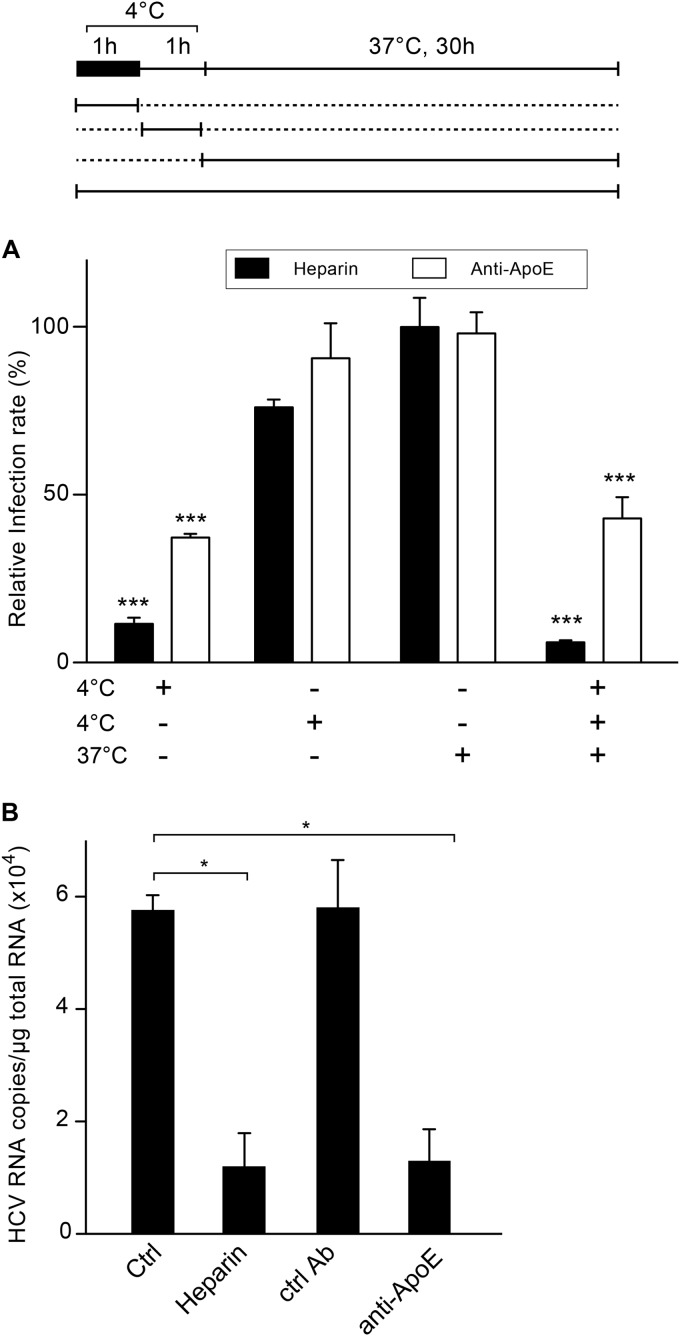
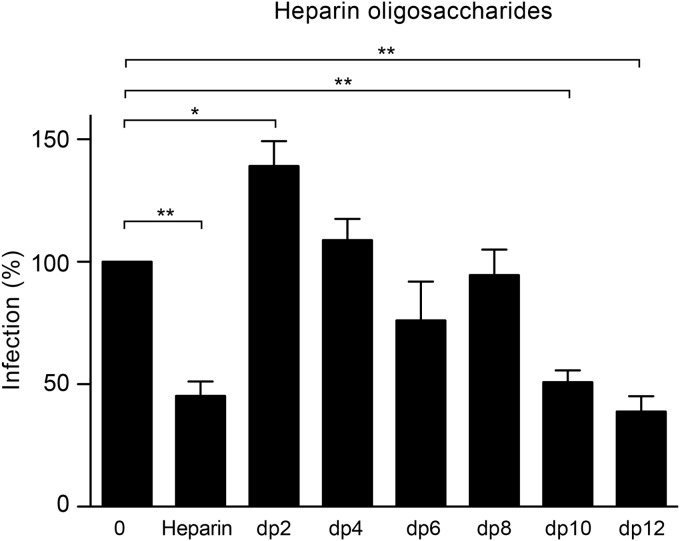
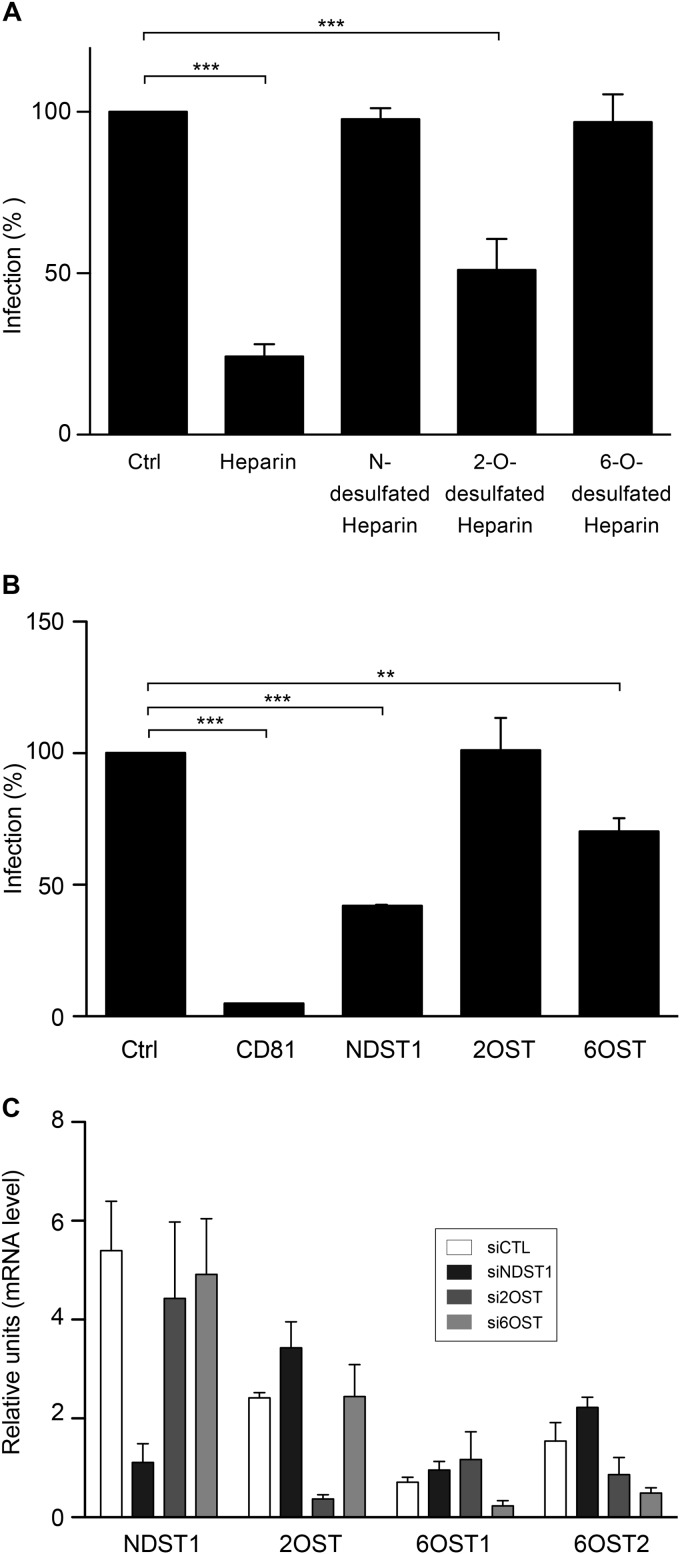
Hepatitis C virus (HCV) entry involves binding to cell surface heparan sulfate (HS) structures. However, due to the lipoprotein-like structure of HCV, the exact contribution of virion components to this interaction remains controversial. Here, we investigated the relative contribution of HCV envelope proteins and apolipoprotein E in the HS-binding step. Deletion of hypervariable region 1, a region previously proposed to be involved in HS binding, did not alter HCV virion binding to HS, indicating that this region is not involved in this interaction in the context of a viral infection. Patient sera and monoclonal antibodies recognizing different regions of HCV envelope glycoproteins were also used in a pulldown assay with beads coated with heparin, a close HS structural homologue. Although isolated HCV envelope glycoproteins could interact with heparin, none of these antibodies was able to interfere with the virion-heparin interaction, strongly suggesting that at the virion surface, HCV envelope glycoproteins are not accessible for HS binding. In contrast, results from kinetic studies, heparin pulldown experiments, and inhibition experiments with anti-apolipoprotein E antibodies indicated that this apolipoprotein plays a major role in HCV-HS interaction. Finally, characterization of the HS structural determinants required for HCV infection by silencing of the enzymes involved in the HS biosynthesis pathway and by competition with modified heparin indicated that N- and 6-O-sulfation but not 2-O-sulfation is required for HCV infection and that the minimum HS oligosaccharide length required for HCV infection is a decasaccharide. Together, these data indicate that HCV hijacks apolipoprotein E to initiate its interaction with specific HS structures.

Importance: Hepatitis C is a global health problem. Hepatitis C virus (HCV) infects approximately 130 million individuals worldwide, with the majority of cases remaining undiagnosed and untreated. In most infected individuals, the virus evades the immune system and establishes a chronic infection. As a consequence, hepatitis C is the leading cause of cirrhosis, end-stage liver disease, hepatocellular carcinoma, and liver transplantation. Virus infection is initiated by entry of the virus into the host cell. In this study, we provide new insights into the viral and cellular determinants involved in the first step of HCV entry, the binding of the virus to host cells. We show that apolipoprotein E is likely responsible for virus binding to heparan sulfate and that N- and 6-O-sulfation of the heparan sulfate proteoglycans is required for HCV infection. In addition, the minimal HS length unit required for HCV infection is a decasaccharide.


Figures

FIG 1
FIG 1
(A) Schematic representation of the HVR1 deletion in E2. TMD, transmembrane domain. (B to E) Characterization of the JFH1-ΔHVR1 mutant. Huh-7 cells were electroporated with in vitro-transcribed JFH1 or JFH1-ΔHVR1 RNA, and cell supernatants were collected either 72 h or 96 h later. Viral stocks were produced after further amplification. Amplified virus stocks were precipitated and loaded on a 10 to 50% iodixanol gradient. The HCV genomes were quantified by quantitative RT-PCR (B), and HCV titers were determined (C). Results are expressed as the means from three independent experiments, and error bars represent the standard deviations of the means. Amplified virus stocks were precipitated and loaded on a 10 to 50% iodixanol gradient. After ultracentrifugation, 12 fractions were collected and the HCV genome copies (D) and titers (E) were quantified for each fraction. Results are expressed as the means from three independent experiments, and error bars represent the standard deviations of the means.
FIG 2
FIG 2
HCV with the HVR1 deletion relies on HS for attachment. (A) Huh-7 cells were inoculated with purified JFH1 or JFH1-ΔHVR1 viruses at an MOI of 5 at 4°C for 2 h. Then, the cells were washed with PBS to remove unbound viruses and lysed to extract RNAs. HCV genomes were measured by quantitative RT-PCR. Results are expressed as the means from three independent experiments, and error bars represent the standard deviations of the means. (B) Purified viruses were preincubated with increasing concentrations of heparin for 1 h at 37°C, and then the virus-heparin mixes were chilled and incubated with Huh-7 cells at 4°C for 2 h. The inoculum was removed, and the cells were washed and incubated for another 30 h at 37°C. Infected cells were quantified by indirect immunofluorescence with anti-E1 MAb A4. Results are expressed as the percentage of the value for the control infection without heparin and represent the means from three independent experiments. (C) Purified viruses were preincubated with increasing concentrations of heparin for 1 h at 37°C, and then the virus-heparin mixes were chilled and incubated with Huh-7 cells at 4°C for 2 h. The inoculum was removed, and the cells were washed and lysed to extract RNAs. HCV genomes were measured by quantitative RT-PCR. Results are expressed as the percentage of the control binding without heparin and represent the means from three independent experiments.
FIG 3
FIG 3
Interaction between heparin and HCV envelope proteins. Different volumes of lysates (200 μl, 100 μl, or 50 μl) obtained from cells infected with JFH1 or JFH1-ΔHVR1 were preincubated in the presence or absence of 500 μg/ml heparin for 1 h at 4°C and then precipitated with heparin-conjugated beads. Proteins were eluted with Laemmli buffer, and samples were separated on SDS-polyacrylamide gels. (A) HCV envelope proteins were detected by immunoblotting with A4 (anti-E1) and A11 (anti-E2) antibodies. (B) The quantities of E1 and E2 precipitated under each condition are presented. Results are expressed as the percentage of the total protein input. Data were analyzed by using Student's t test (*, P < 0.01). Mean values from three independent experiments are given. Error bars represent the standard deviations of the means. (C) HCV envelope proteins precipitated with heparin-conjugated beads from purified virus JFH1 or JFH1-ΔHVR1 lysates were detected by immunoblotting with A4 (anti-E1) and A11 (anti-E2) antibodies. (D) Purified JFH1 or JFH1-ΔHVR1 viruses were precipitated with heparin-coated beads, anti-apoE-coated protein G beads, or protein G beads. The amount of virus that bound to the beads was measured by quantitative RT-PCR. Mean values from three independent experiments are given. Error bars represent the standard deviations of the means.
FIG 4
FIG 4
Anti-apoE antibody neutralization. Wild-type JFH1 and JFH1-ΔHVR1 viruses were preincubated with either control MAb RO4 (C), polyclonal antibody (E), or different anti-apoE antibodies, MAb E3 (A), MAb 23 (B), or polyclonal antibody 947 (D), at 37°C for 1 h and then added to the cells for 2 h. The inoculum was removed, and the cells were washed and incubated for another 30 h. Infected cells were detected by indirect immunofluorescence. Results are expressed as the percentage of HCVcc infectivity in the absence of antibodies. Mean values from three independent experiments are given. Error bars represent the standard deviations of the means.
FIG 5
FIG 5
Anti-apoE antibodies inhibit HCV binding to the cell surface. (A) Kinetics of HCV entry inhibition by heparin or anti-apoE antibodies. Infection of the cells with purified JFH1 was divided into 3 steps. The schematic at the top shows that virus was inoculated into Huh-7 cells at 4°C for 1 h (black box). Then, the cells were rinsed and incubated at 4°C for an additional hour. Subsequently, the cells were washed and the temperature was shifted to 37°C for an additional hour. For each step, the presence of 500 μg/ml of heparin or 5 μg/ml of anti-apoE MAb 23 is depicted under the x axis. Thirty hours later, the cells were fixed and processed for immunofluorescence. Results are expressed as the percentage of the value for control infections without inhibitors. Mean values from three independent experiments are given. Error bars represent the standard deviations of the means. Statistical analyses were performed by using a Bonferroni test (***, P < 0.001). (B) Cells were inoculated at 4°C for 2 h with purified virus with or without heparin (500 μg/ml) or with either anti-apoE MAb 23 or an irrelevant control (Ctrl) antibody (5 μg/ml). Cells were washed, and the amount of virus that bound to the cell surface was measured by quantitative RT-PCR. Mean values from three independent experiments are given. Error bars represent the standard deviations of the means. Data were analyzed by using Student's t test (*, P < 0.05).
FIG 6
FIG 6
apoE mediates HCV binding to HS. (A) Purified H77/JFH1 chimera was preincubated for 1 h at 37°C with 25 μg/ml heparin, antibodies (5 μg/ml MAb AR3A, 10 μg/ml MAb AR5A, 10 μg/ml MAb RO4, 10 μg/ml MAb 6/16, 20 μl MAb 9/27, 100 μg/ml purified IgG from a control patient [patient 5] or four different gt1a-infected patients [patients 1 to 4], 1/200-diluted anti-apoE polyclonal antibodies, or irrelevant [control] polyclonal antibodies [Ctrl pAb]), 20 μg/ml apoE-derived peptides, or 3× Flag-tagged control peptides before heparin-coated beads were added. The amount of virus that bound to the beads was measured by quantitative RT-PCR. The quantity of virus bound to the beads in the absence of any competitor was arbitrarily set equal to 100%. Mean values from three independent experiments are given. Data were analyzed by using a Dunnett's multiple-comparison test (***, P < 0.001). (B) Purified JFH1 or JFH1-ΔHVR1 viruses were incubated for 1 h at 37°C in the absence or presence of 25 μg/ml heparin and then precipitated with anti-apoE antibody-coated beads. Virus bound to the beads was measured by quantitative RT-PCR. Mean values from three independent experiments are given. Error bars represent the standard deviations of the means.
FIG 7
FIG 7
HCV infection in the presence of heparin oligosaccharides of defined length. Purified viruses were preincubated with 1 mg/ml of heparin-derived oligosaccharides with different chain length (from dp2 to dp12) at 37°C for 1 h. Heparin was used as a positive control. Then, an equal volume of medium was added to the mixtures before they were chilled. Huh-7 cells were inoculated at 4°C for 2 h. The inoculum was removed, and the cells were washed and incubated for another 30 h at 37°C. Cells were processed for immunofluorescence to quantify the infection. Mean values from three independent experiments are given. Error bars represent the standard deviations of the means. Data were analyzed by using Dunnett's multiple-comparison test (*, P < 0.05; **, P < 0.01).
FIG 8
FIG 8
HS biosynthetic enzyme expression profile. Total RNAs were extracted from Huh-7 cells, and the mRNA levels of enzymes involved in HS sulfation were quantified by quantitative RT-PCR. Mean values from three independent experiments are given. Error bars represent the standard deviations of the means.
FIG 9
FIG 9
Role of specific sulfation in HCV infection. (A) Purified virus was preincubated with heparin or its derivatives (100 μg/ml) for 1 h at 37°C, and then the mix was chilled to inoculate Huh-7 cells. After 2 h at 4°C, the cells were washed and incubated at 37°C for another 30 h. Infection was analyzed by immunofluorescence. Results are expressed as the percentage of the value for control infections without heparin. Mean values from three independent experiments are given. Error bars represent the standard deviations of the means. Data were analyzed by using Dunnett's multiple-comparison test (***, P < 0.001). (B) Huh-7 cells were transfected with siRNA specific for CD81, NDST1, and 2-OST or a combination of siRNAs specific for 6-OST1 and 6-OST2. Five days later, the cells were inoculated with JFH1 virus for 1 h at 37°C. The cells were washed and further incubated for 30 h. HCV infection was quantified by immunofluorescence assay. Mean values from three independent experiments are given. Data were analyzed by using Dunnett's multiple-comparison test (**, P < 0.01; ***, P < 0.001). (C) Silencing of the different enzymes was measured by quantification of their mRNA levels 5 days after the transfection of the different siRNAs. Mean values from three independent experiments are given. Error bars represent the standard deviations of the means. siCTL, siNDST1, si2OST, and si6OST, siRNAs specific for the control, NDST1, 2-OST, and 6-OST, respectively.

References

    1. Ray SC, Bailey JR, Thomas DL. 2013. Hepatitis C virus. InKnipe DM, Howley PM, Cohen JI, Griffin DE, Lamb RA, Martin MA, Racaniello VR, Roizman B (ed), Fields virology, 6th ed (electronic) Lippincott Wilkins & Williams, Philadelphia, PA.
    1. Lindenbach BD, Evans MJ, Syder AJ, Wolk B, Tellinghuisen TL, Liu CC, Maruyama T, Hynes RO, Burton DR, McKeating JA, Rice CM. 2005. Complete replication of hepatitis C virus in cell culture. Science 309:623–626. doi: 10.1126/science.1114016. - DOI - PubMed
    1. Bartosch B, Vitelli A, Granier C, Goujon C, Dubuisson J, Pascale S, Scarselli E, Cortese R, Nicosia A, Cosset FL. 2003. Cell entry of hepatitis C virus requires a set of co-receptors that include the CD81 tetraspanin and the SR-B1 scavenger receptor. J Biol Chem 278:41624–41630. doi: 10.1074/jbc.M305289200. - DOI - PubMed
    1. Hsu M, Zhang J, Flint M, Logvinoff C, Cheng-Mayer C, Rice CM, McKeating JA. 2003. Hepatitis C virus glycoproteins mediate pH-dependent cell entry of pseudotyped retroviral particles. Proc Natl Acad Sci U S A 100:7271–7276. doi: 10.1073/pnas.0832180100. - DOI - PMC - PubMed
    1. Vieyres G, Dubuisson J, Pietschmann T. 2014. Incorporation of hepatitis C virus E1 and E2 glycoproteins: the keystones on a peculiar virion. Viruses 6:1149–1187. doi: 10.3390/v6031149. - DOI - PMC - PubMed

Publication types