. 2015 Jan 6:8:426.
doi: 10.3389/fncel.2014.00426. eCollection 2014.

Polarized cellular patterns of endocannabinoid production and detection shape cannabinoid signaling in neurons

Affiliations

Polarized cellular patterns of endocannabinoid production and detection shape cannabinoid signaling in neurons

Delphine Ladarre et al. Front Cell Neurosci. .

Abstract

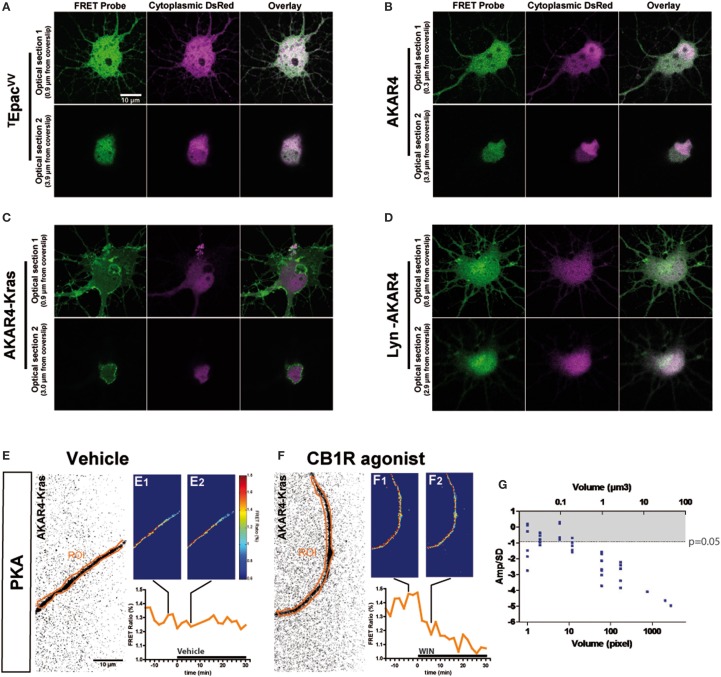
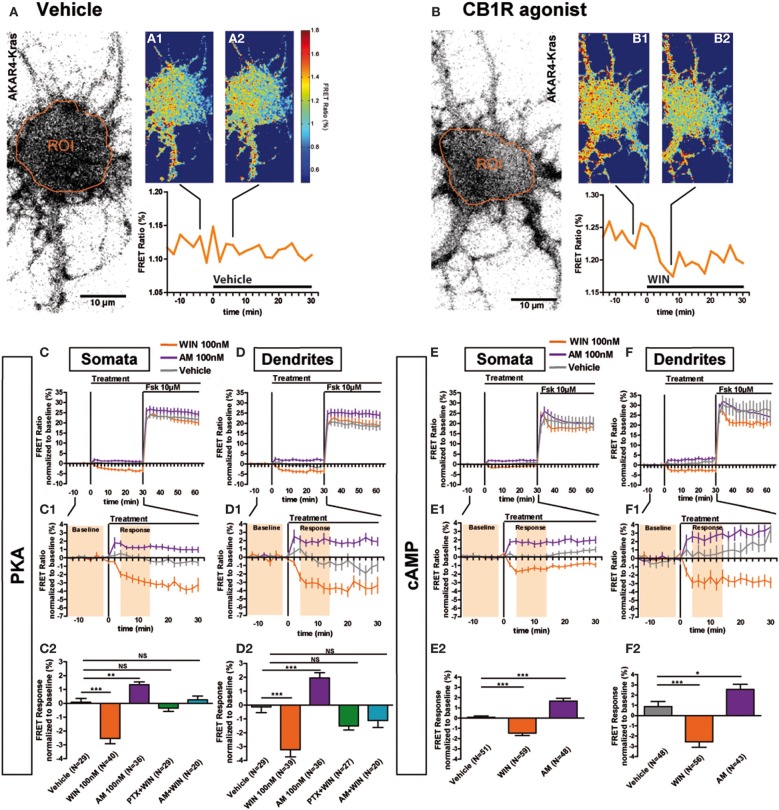
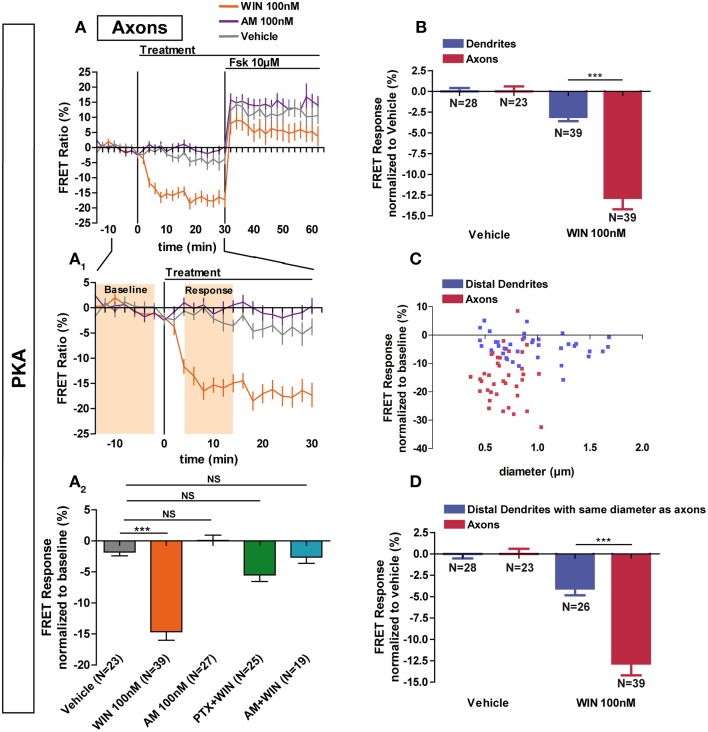
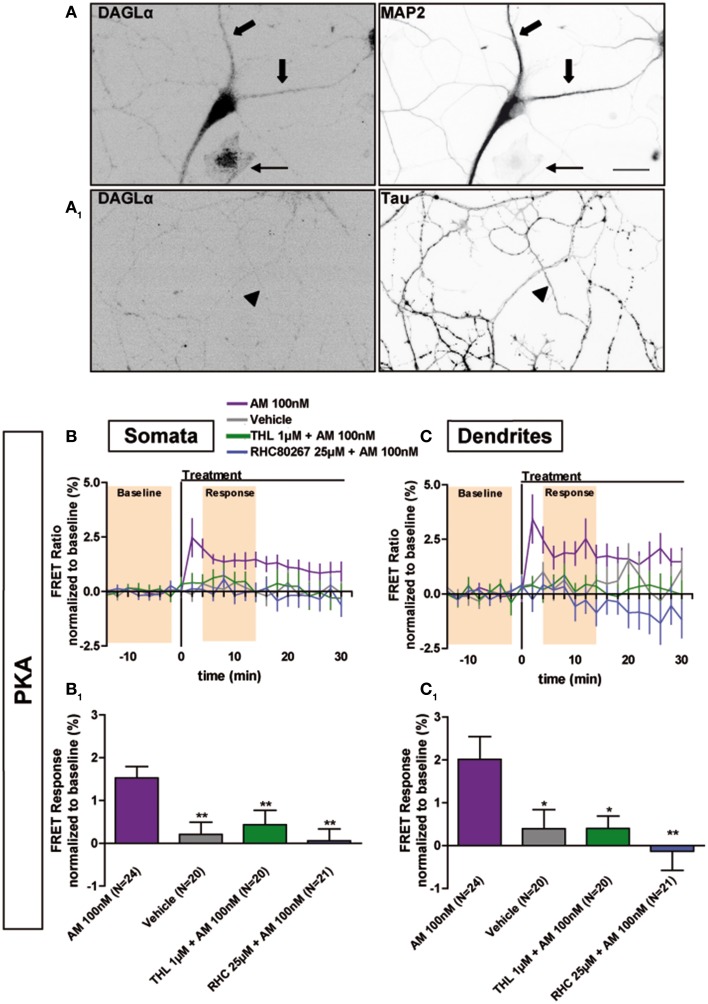
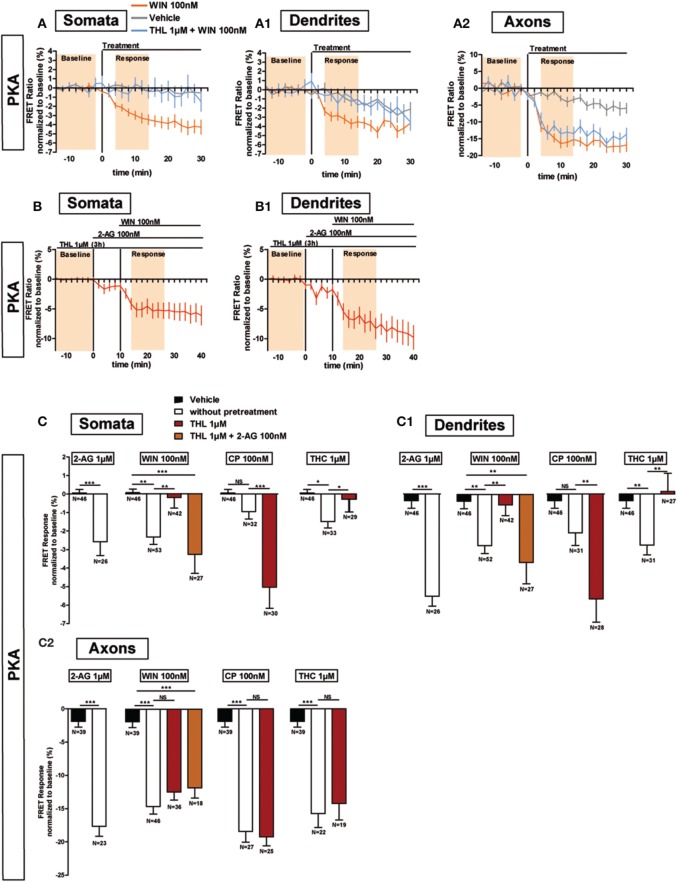
Neurons display important differences in plasma membrane composition between somatodendritic and axonal compartments, potentially leading to currently unexplored consequences in G-protein-coupled-receptor signaling. Here, by using highly-resolved biosensor imaging to measure local changes in basal levels of key signaling components, we explored features of type-1 cannabinoid receptor (CB1R) signaling in individual axons and dendrites of cultured rat hippocampal neurons. Activation of endogenous CB1Rs led to rapid, Gi/o-protein- and cAMP-mediated decrease of cyclic-AMP-dependent protein kinase (PKA) activity in the somatodendritic compartment. In axons, PKA inhibition was significantly stronger, in line with axonally-polarized distribution of CB1Rs. Conversely, inverse agonist AM281 produced marked rapid increase of basal PKA activation in somata and dendrites, but not in axons, removing constitutive activation of CB1Rs generated by local production of the endocannabinoid 2-arachidonoylglycerol (2-AG). Interestingly, somatodendritic 2-AG levels differently modified signaling responses to CB1R activation by Δ(9)-THC, the psychoactive compound of marijuana, and by the synthetic cannabinoids WIN55,212-2 and CP55,940. These highly contrasted differences in sub-neuronal signaling responses warrant caution in extrapolating pharmacological profiles, which are typically obtained in non-polarized cells, to predict in vivo responses of axonal (i.e., presynaptic) GPCRs. Therefore, our results suggest that enhanced comprehension of GPCR signaling constraints imposed by neuronal cell biology may improve the understanding of neuropharmacological action.

Keywords: CB1; DAGL; FRET; allosteric; biased agonism; cyclic nucleotide; endocannabinoid; lipid.


Figures

Figure 1
Figure 1
Quantitative measure of basal cAMP/PKA pathway modulation downstream of endogenous neuronal CB1Rs in small cytoplasmic volumes. (A–D) Cultured hippocampal neurons expressing soluble (cytoplasmic) DsRed2 and various FRET probes designed to measure cAMP concentration or PKA activity: TEpacVV (A), AKAR4 (B), AKAR4-Kras (C), LYN-AKAR4 (D). After fixation, confocal imaging at two different optical sections shows sub-cellular localization of the probes. AKAR4-Kras probes are well-localized to the plasma membrane in the somatodendritic region. (E,F) Modulation of basal PKA activity downstream of endogenous CB1Rs in axonal Regions of Interest (ROI) in AKAR4-Kras expressing neurons. The first image of the acquisition on YFP channel, inverted and with enhanced contrast for better visibility, is shown with the ROI (orange) (E,F). The mean FRET ratio is shown at 4 min (-t4) before (E1,F1) and at 6 min (t6) after (E2,F2) the addition of treatment at t0. Incubation with vehicle does not change the FRET ratio (E2) compared to baseline (E1) but addition of agonist WIN 55-212,2 (WIN) 100 nM induces a rapid FRET-ratio decrease (F2), as compared to baseline (F1). (G) Test of FRET imaging sensitivity by determining the smallest axonal cytoplasmic volume allowing the measurement of significant PKA activity decrease after WIN-induced activation of endogenous CB1Rs. We calculated the mean value of the FRET response amplitude normalized to baseline (Amp) and its standard deviation (SD), in different axonal ROIs, between t4 (4 min after drug treatment) and t14. The ratio of the FRET response amplitude to its standard deviation (Amp/SD) is represented in function of the volume (see text). The WIN effect is significantly different from control (modeled as an effect of Amp = 0 with the same standard deviation than the corresponding WIN-stimulated response) at the Amp/SD ratio equal to −0.91 (in gray, p < 0.05, Student's t-test, N = 10), which is reached starting from ~1 μm3 axonal volume. Data information: Scale bar: 10 μm (A–F).
Figure 2
Figure 2
Somatodendritic CB1Rs constitutively inhibit the cAMP/PKA pathway. (A,B) Two representative neurons expressing the membrane-targeted PKA sensor AKAR4-Kras. The first image of the acquisition on YFP channel with the ROI is shown (A,B). The mean FRET ratio in somatic ROIs (orange) is shown at 4 min (-t4) before (A1, B1) and at 6 min (t6) after the addition of treatment at t0: Vehicle (A2) or agonist WIN55-212,2 (WIN) 100 nM (B2). (C–F) Averaged responses of AKAR4-Kras (C,D) or the cAMP sensor TEpacVV expressing neurons (E,F). The FRET ratio normalized to baseline was calculated for each neuron with a time-resolution of 2 min, separately in somata and dendrites. The curves represent mean ± S.E.M. of the FRET ratio for all imaged neurons at each time point. Addition of agonist WIN 100 nM but not of vehicle at t0 results in rapid FRET ratio decrease while inverse-agonist AM281 100 nM (AM) treatment results in increased PKA-activation. At 30 min, adenylyl-cyclase activator Forskolin (Fsk) was added at 10 μM, inducing a saturating increase of the FRET ratio. C1,D1,E1,F1: Zoom between -t14 and t30 of C,D,E,F, respectively, shows significant modulation of basal PKA activity after activation or blockade of CB1Rs. C2,D2,E2,F2: FRET responses were calculated as the mean response between t4 and t14 min (shaded zone labeled “Response” on C1,D1,E1,F1), using data normalized to the baseline (shaded zone between -t14 and -t2, labeled “Baseline” on C1,D1,E1,F1), as described in the Materials and Methods Section. Implication of Gi/o-proteins was shown by the specific inhibitor pertussis toxin (PTX), applied overnight at 100 ng/mL before the beginning of the experiment. The WIN effect was CB1R-induced as shown by pre-treatment with the CB1R-specific antagonist AM281 (1 μM 3 h before the beginning of the experiment). Data information: Data are expressed as mean ± S.E.M.; Statistical analysis was realized with one-way ANOVA followed by Newmann-Keuls post-test; NS p > 0.05, *p < 0.05, **p < 0.01, ***p < 0.001. Scale bar: 10 μm (A,B).
Figure 3
Figure 3
Axonal CB1R signaling differs from dendritic signaling. (A) Averaged axonal responses of AKAR4-Kras expressing neurons, as shown on Figures 1E,F. The FRET ratio normalized to baseline was calculated for each neuron with a time-resolution of 2 min. The curves represent mean ± S.E.M. of the FRET ratio for all imaged neurons at each time point. Addition of agonist WIN 100 nM but not of vehicle or inverse-agonist AM281 100 nM (AM) at t0 results in rapid high-amplitude FRET ratio decrease. At 30 min, adenylyl-cyclase activator Forskolin (Fsk) was added at 10 μM, inducing a saturating increase of the FRET ratio. A1: Zoom between −t14 and t30 of A shows significant modulation of basal PKA activity after activation of CB1Rs. A2: FRET responses were calculated as the mean response between t4 and t14 min (shaded zone labeled “Response” on A1), using data normalized to the baseline (shaded zone between −t14 and −t2, labeled “Baseline” on A1). Implication of Gi/o-proteins was shown by the specific inhibitor pertussis toxin (PTX), applied overnight at 100 ng/mL before the beginning of the experiment. The WIN effect was CB1R-induced as shown by pre-treatment with the CB1R-specific antagonist AM281 (1 μM, 3 h before the beginning of the experiment). (B) Vehicle-normalized FRET response to WIN is significantly stronger in axons than in dendrites. (C) Individual FRET responses in axons and distal dendrites are represented in function of their respective diameter. For each group (distal dendrites and axons), a Pearson correlation test was calculated showing no correlation between FRET response and diameter (rdistal dendrites = −0.065 and raxons = 0.03649). (D) Distal dendrites having the similar diameter than axons still display significantly weaker vehicle-normalized FRET responses to WIN compared to axons. Data information: Data are expressed as means ± S.E.M.; Statistical analysis was realized with one-way ANOVA followed by Newmann-Keuls post-test (A2) or unpaired t-test (B,D); NS p > 0.05, ***p < 0.001.
Figure 4
Figure 4
Constitutive activation of somatodendritic CB1Rs requires locally synthesized endocannabinoids. (A) Simultaneous immunolabeling of fully-polarized (DIV9) neurons with anti-DAGLα antibody and either anti-MAP2 (A) or anti-Tau (A1) antibodies. Large arrows indicate dendrites, arrow-heads indicate axon and the thin arrow shows an astrocyte. (B,C) Averaged somatic and dendritic responses of AKAR4-Kras expressing neurons to inverse-agonist AM281 (AM), with or without inhibiting DAGL activity. The FRET ratio normalized to baseline was calculated for each neuron with a time-resolution of 2 min. The curves represent mean ± S.E.M. of the FRET ratio for all imaged neurons at each time point. Addition of 100 nM AM but not of vehicle at t0 results in elevated PKA activity, revealing constitutive CB1R activation, which is significantly decreased after DAGL inhibition either by tetrahydrolipstatin (THL) 1 μM or RHC80267 25 μM. Data information: Data are expressed as mean ± S.E.M.; Statistical analysis was realized with one-way ANOVA followed by Newmann-Keuls post-test; *p < 0.05, **p < 0.01. Scale bar: 20 μm (A,A1).
Figure 5
Figure 5
Endogenous 2-AG significantly modifies CB1R responses to exogenous cannabinoids. (A,B) Averaged somatic, dendritic and axonal responses of AKAR4-Kras expressing neurons to agonist WIN 55-212,2 (WIN). The FRET ratio normalized to baseline was calculated for each neuron with a time-resolution of 2 min. The curves represent mean ± S.E.M. of the FRET ratio for all imaged neurons at each time point. Addition of WIN 100 nM but not of vehicle at t0 results in decreased PKA activity, which effect is significantly inhibited after DAGL inhibition by tetrahydrolipstatin (THL) 1 μM in somata (A) and dendrites (A1) but not in axons (A2). The effect of THL pre-treatment on the WIN effect in somata (B) and dendrites (B1) can be rescued by applying 2-AG at 100 nM 10 min before WIN. (C) Variation of neuronal 2-AG levels (similarly to A,B) modifies the FRET responses to exocannabinoids WIN55-212,2 100 nM (WIN), CP55,940 100 nM (CP) and Δ9-THC 1 μM (THC), shown as the mean response between t4 and t14 min (shaded zone labeled “Response” on A,B), using data normalized to the baseline (shaded zone between −t14 and −t2, labeled “Baseline” on A,B) in somata (C), dendrites (C1) or axons (C2). 2-AG levels were reduced by THL 1 μM, applied 3 h before the beginning of the experiment and rescued by 2-AG 100 nM at 10 min before agonist treatment. Data information: Data are expressed as mean ± S.E.M.; Statistical analysis was realized with unpaired t-test (2-AG) or one-way ANOVA followed by Newmann-Keuls post-test (WIN, CP, and THC); NS p > 0.05, *p < 0.05, **p < 0.01 and ***p < 0.001.

Similar articles

Cited by

References

    1. Alger B. E., Kim J. (2011). Supply and demand for endocannabinoids. Trends Neurosci. 34, 304–315. 10.1016/j.tins.2011.03.003 - DOI - PMC - PubMed
    1. Bacci A., Huguenard J. R., Prince D. A. (2004). Long-lasting self-inhibition of neocortical interneurons mediated by endocannabinoids. Nature 431, 312–316. 10.1038/nature02913 - DOI - PubMed
    1. Bisogno T., Howell F., Williams G., Minassi A., Cascio M. G., Ligresti A., et al. . (2003). Cloning of the first sn1-DAG lipases points to the spatial and temporal regulation of endocannabinoid signaling in the brain. J. Cell Biol. 163, 463–468. 10.1083/jcb.200305129 - DOI - PMC - PubMed
    1. Bodor A. L., Katona I., Nyiri G., Mackie K., Ledent C., Hajos N., et al. . (2005). Endocannabinoid signaling in rat somatosensory cortex: laminar differences and involvement of specific interneuron types. J. Neurosci. 25, 6845–6856. 10.1523/JNEUROSCI.0442-05.2005 - DOI - PMC - PubMed
    1. Castro L. R., Gervasi N., Guiot E., Cavellini L., Nikolaev V. O., Paupardin-Tritsch D., et al. . (2010). Type 4 phosphodiesterase plays different integrating roles in different cellular domains in pyramidal cortical neurons. J. Neurosci. 30, 6143–6151. 10.1523/JNEUROSCI.5851-09.2010 - DOI - PMC - PubMed

LinkOut - more resources