

Subcortical brain segmentation of two dimensional T1-weighted data sets with FMRIB's Integrated Registration and Segmentation Tool (FIRST)
- PMID: 25610766
- PMCID: PMC4299953
- DOI: 10.1016/j.nicl.2014.11.010
Subcortical brain segmentation of two dimensional T1-weighted data sets with FMRIB's Integrated Registration and Segmentation Tool (FIRST)
Abstract
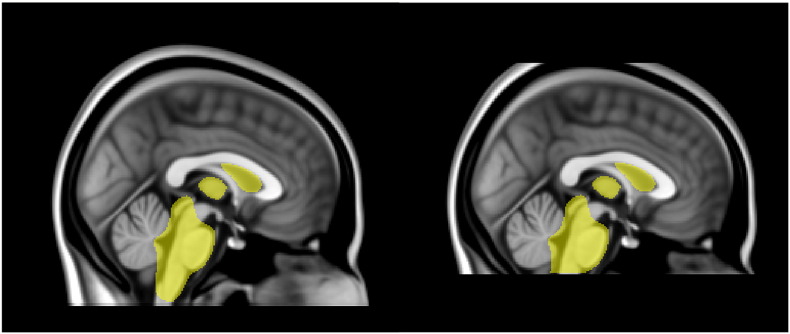
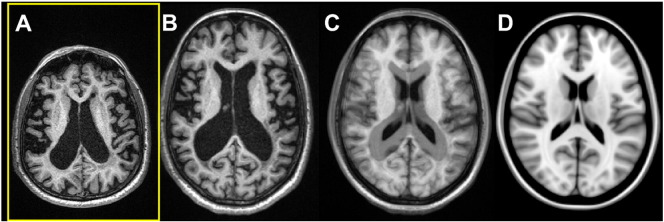
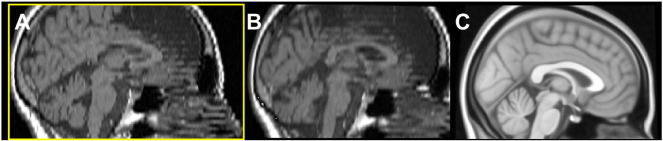
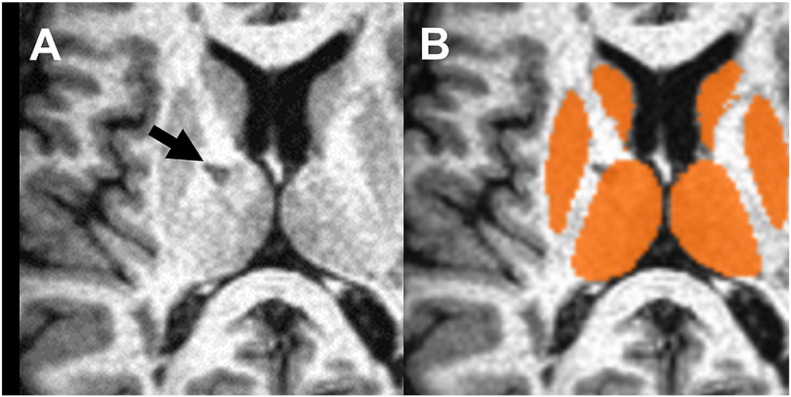
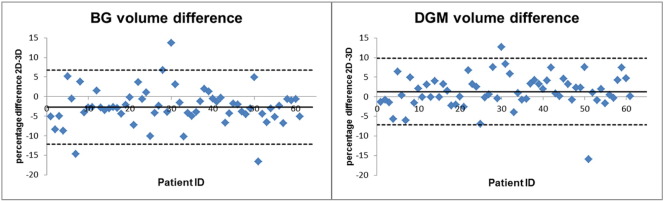
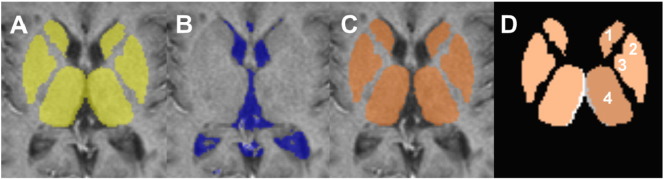
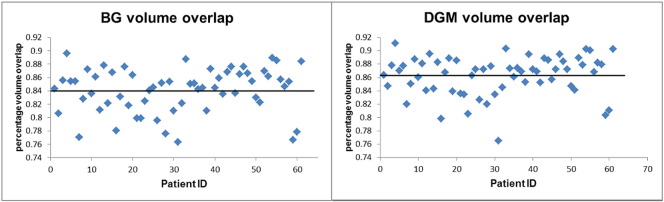
Brain atrophy has been identified as an important contributing factor to the development of disability in multiple sclerosis (MS). In this respect, more and more interest is focussing on the role of deep grey matter (DGM) areas. Novel data analysis pipelines are available for the automatic segmentation of DGM using three-dimensional (3D) MRI data. However, in clinical trials, often no such high-resolution data are acquired and hence no conclusions regarding the impact of new treatments on DGM atrophy were possible so far. In this work, we used FMRIB's Integrated Registration and Segmentation Tool (FIRST) to evaluate the possibility of segmenting DGM structures using standard two-dimensional (2D) T1-weighted MRI. In a cohort of 70 MS patients, both 2D and 3D T1-weighted data were acquired. The thalamus, putamen, pallidum, nucleus accumbens, and caudate nucleus were bilaterally segmented using FIRST. Volumes were calculated for each structure and for the sum of basal ganglia (BG) as well as for the total DGM. The accuracy and reliability of the 2D data segmentation were compared with the respective results of 3D segmentations using volume difference, volume overlap and intra-class correlation coefficients (ICCs). The mean differences for the individual substructures were between 1.3% (putamen) and -25.2% (nucleus accumbens). The respective values for the BG were -2.7% and for DGM 1.3%. Mean volume overlap was between 89.1% (thalamus) and 61.5% (nucleus accumbens); BG: 84.1%; DGM: 86.3%. Regarding ICC, all structures showed good agreement with the exception of the nucleus accumbens. The results of the segmentation were additionally validated through expert manual delineation of the caudate nucleus and putamen in a subset of the 3D data. In conclusion, we demonstrate that subcortical segmentation of 2D data are feasible using FIRST. The larger subcortical GM structures can be segmented with high consistency. This forms the basis for the application of FIRST in large 2D MRI data sets of clinical trials in order to determine the impact of therapeutic interventions on DGM atrophy in MS.
Keywords: Basal ganglia; FMRIB's Integrated Registration and Segmentation Tool; Multiple sclerosis; Segmentation; T1-weighted data; Two-dimensional data.
Figures
References
-
- Alves G.S., O'Dwyer L., Jurcoane A., Oertel-Knöchel V., Knöchel C., Prvulovic D., Sudo F., Alves C.E., Valente L., Moreira D., Fußer F., Fuβer F., Karakaya T., Pantel J., Engelhardt E. Different patterns of white matter degeneration using multiple diffusion indices and volumetric data in mild cognitive impairment and Alzheimer patients. PLoS ONE. 2012;7(12):e52859. 23300797 - PMC - PubMed
-
- Barkhof F., Polman C.H., Radue E.W., Kappos L., Freedman M.S., Edan G., Hartung H.P., Miller D.H., Montalbán X., Poppe P., de Vos M., Lasri F., Bauer L., Dahms S., Wagner K., Pohl C., Sandbrink R. Magnetic resonance imaging effects of interferon beta-1b in the BENEFIT study: integrated 2-year results. Arch. Neurol. 2007;64(9):1292–1298. 17846268 - PubMed
MeSH terms
LinkOut - more resources
Full Text Sources
Other Literature Sources
Medical
