. 2014 Aug 7:7:273-80.
doi: 10.1016/j.nicl.2014.08.002. eCollection 2015.

Thalamic functional connectivity predicts seizure laterality in individual TLE patients: application of a biomarker development strategy

Affiliations

Thalamic functional connectivity predicts seizure laterality in individual TLE patients: application of a biomarker development strategy

Daniel S Barron et al. Neuroimage Clin. .

Abstract

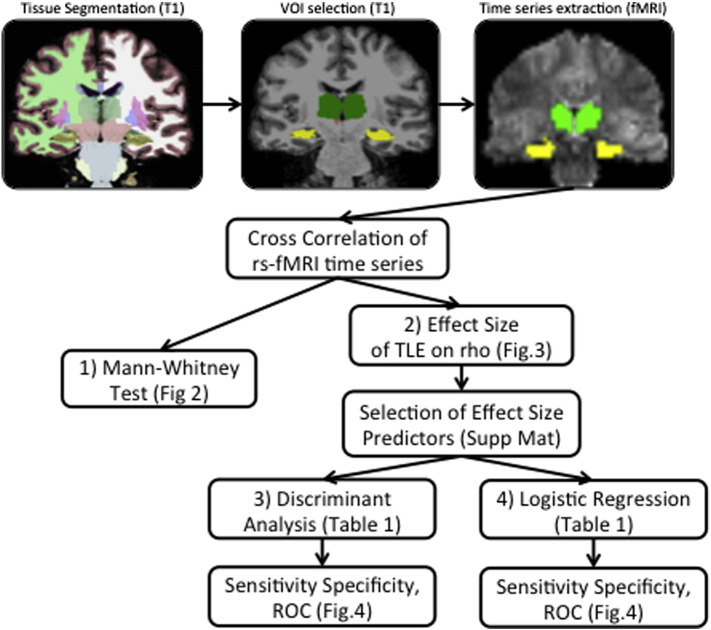
Noninvasive markers of brain function could yield biomarkers in many neurological disorders. Disease models constrained by coordinate-based meta-analysis are likely to increase this yield. Here, we evaluate a thalamic model of temporal lobe epilepsy that we proposed in a coordinate-based meta-analysis and extended in a diffusion tractography study of an independent patient population. Specifically, we evaluated whether thalamic functional connectivity (resting-state fMRI-BOLD) with temporal lobe areas can predict seizure onset laterality, as established with intracranial EEG. Twenty-four lesional and non-lesional temporal lobe epilepsy patients were studied. No significant differences in functional connection strength in patient and control groups were observed with Mann-Whitney Tests (corrected for multiple comparisons). Notwithstanding the lack of group differences, individual patient difference scores (from control mean connection strength) successfully predicted seizure onset zone as shown in ROC curves: discriminant analysis (two-dimensional) predicted seizure onset zone with 85% sensitivity and 91% specificity; logistic regression (four-dimensional) achieved 86% sensitivity and 100% specificity. The strongest markers in both analyses were left thalamo-hippocampal and right thalamo-entorhinal cortex functional connection strength. Thus, this study shows that thalamic functional connections are sensitive and specific markers of seizure onset laterality in individual temporal lobe epilepsy patients. This study also advances an overall strategy for the programmatic development of neuroimaging biomarkers in clinical and genetic populations: a disease model informed by coordinate-based meta-analysis was used to anatomically constrain individual patient analyses.

Keywords: Biomarker; Epilepsy; Lateralization; Resting-state fMRI; Temporal Lobe Epilepsy; Thalamus; fMRI.


Figures

Fig. 1
Fig. 1
Analysis overview. Individual subject structural MRI image volumes were segmented and the thalamus, hippocampus, amygdala, and entorhinal cortex volumes of interest (VOIs) were transformed to functional MRI space. Within these VOIs, mean time series were extracted and cross correlations were computed. 1) Group comparisons were performed with Mann–Whitney tests. 2) The effect size of individual patient's TLE on rho was compared to corresponding mean of healthy controls (n = 20). 3) Discriminant analysis and 4) logistic regression were performed to predict seizure onset laterality from functional connectivity effect size. Selection of effect size predictors is described in eMethods and supplementary materials.
Fig. 2
Fig. 2
Effect size of TLE laterality on functional connectivity. Left: effect size was calculated as the difference of group averaged Fischer transformed correlation coefficients for R (red) and L (blue) TLE patients subtracted from the control group mean (Cohen, 1988). Effect sizes used as predictors for discriminant analysis are denoted with * and those used for logistic regression denoted with both * and **. To improve clarity of the figure, the redundant upper triangle of the matrix has been excluded. Right: diagram of effect sizes used to predict seizure onset laterality. Red lines represent increased functional connectivity compared to control; blue lines represent decreased. Triple lines represent effect sizes used in discriminant analysis; logistic regression used both triple and single lines.
Fig. 3
Fig. 3
ROC curve of discriminant and logistic regression analysis methods. Curve is based on individual patient data reported in Table 3. Discriminant analysis probabilities were adjusted to be relative to diagnosis of RTLE, P (p = 1).

References

    1. Barron D.S., Fox P.M., Laird A.R., Robinson J.L., Fox P.T. Thalamic medial dorsal nucleus atrophy in medial temporal lobe epilepsy: a VBM meta-analysis. NeuroImage. Clinical. 2012;2:25–32. 24179755 - PMC - PubMed
    1. Barron D.S., Tandon N., Lancaster J.L., Fox P.T. Thalamic structural connectivity in medial temporal lobe epilepsy. Epilepsia. 2014;2014:e50–e55. 24802969 - PMC - PubMed
    1. Bartolomei F., Khalil M., Wendling F. Entorhinal cortex involvement in human mesial temporal lobe epilepsy: an electrophysiologic and volumetric study. Epilepsia. 2005;46(5):677–687. 15857433 - PubMed
    1. Bernhardt B.C., Chen Z., He Y., Evans A.C., Bernasconi N. Graph-theoretical analysis reveals disrupted small-world organization of cortical thickness correlation networks in temporal lobe epilepsy. Cerebral Cortex (New York, N.Y.: 1991) 2011;21(9):2147–2157. 21330467 - PubMed
    1. Bernhardt B.C., Bernasconi N., Kim H., Bernasconi A. Mapping thalamocortical network pathology in temporal lobe epilepsy. Neurology. 2012;78(2):129–136. 22205759 - PubMed

Publication types

LinkOut - more resources