

Computational analysis of fluid flow within a device for applying biaxial strain to cultured cells
- PMID: 25611013
- PMCID: PMC4370046
- DOI: 10.1115/1.4029638
Computational analysis of fluid flow within a device for applying biaxial strain to cultured cells
Abstract
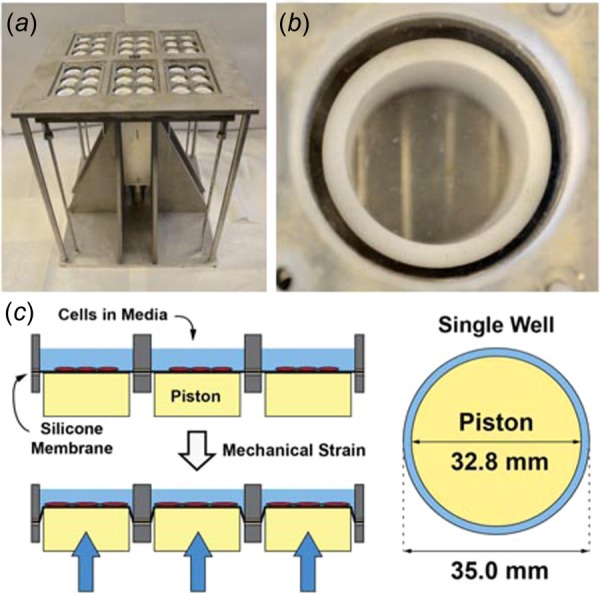
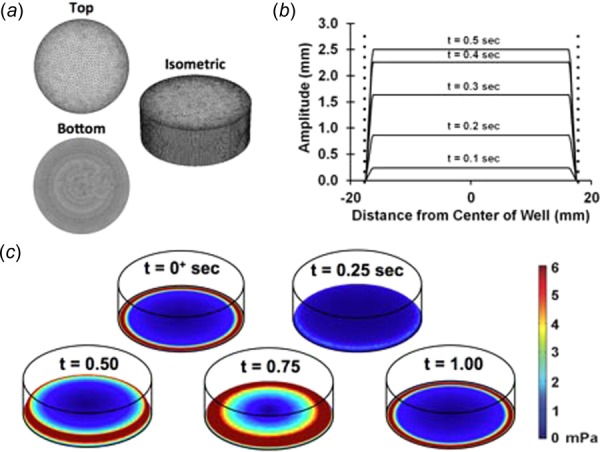
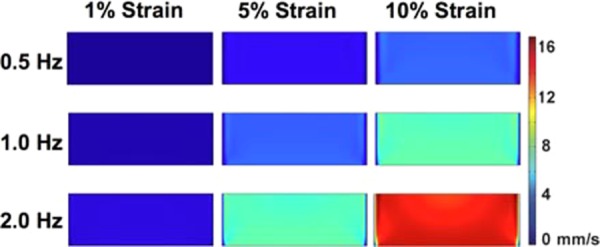
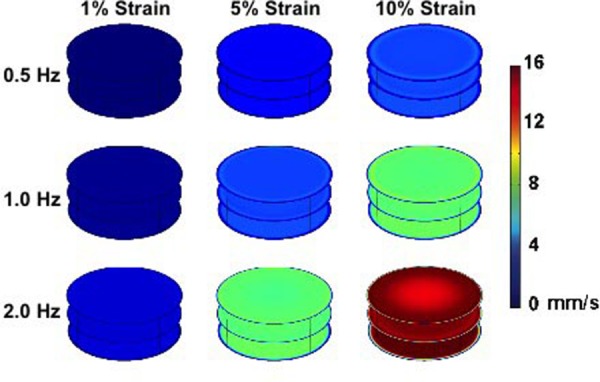
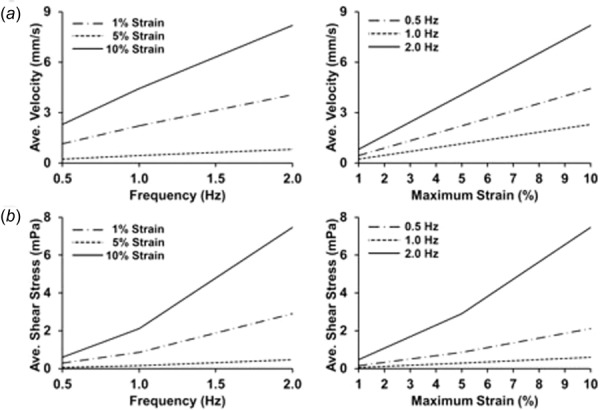
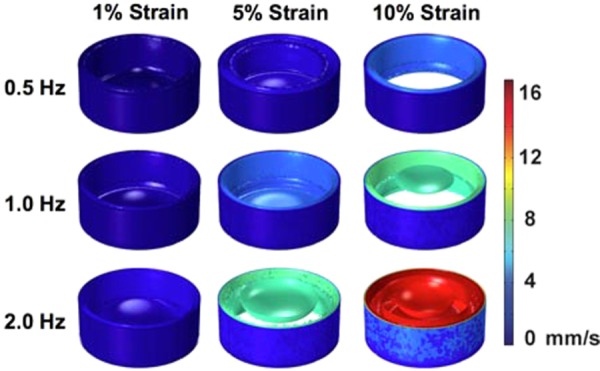
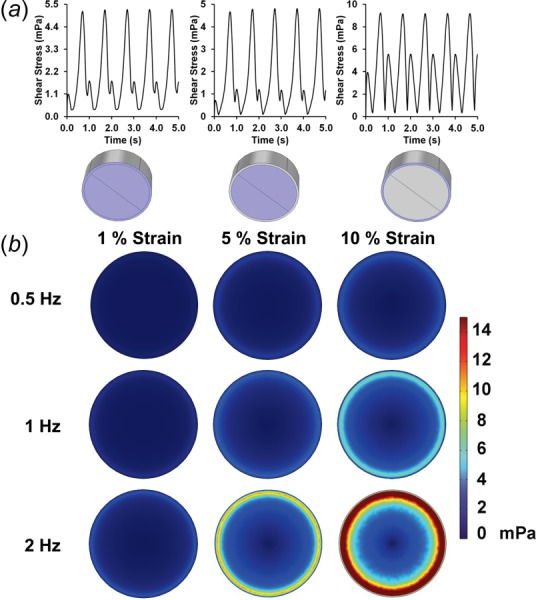
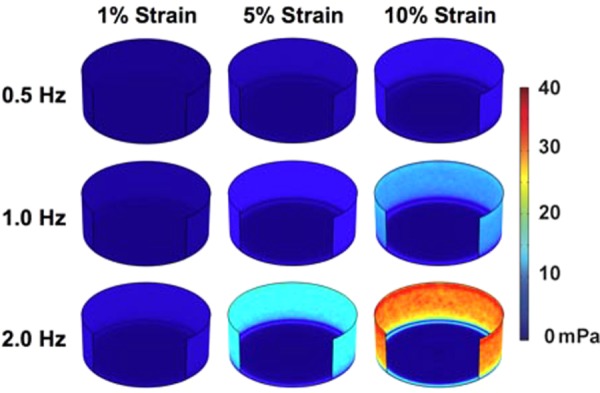
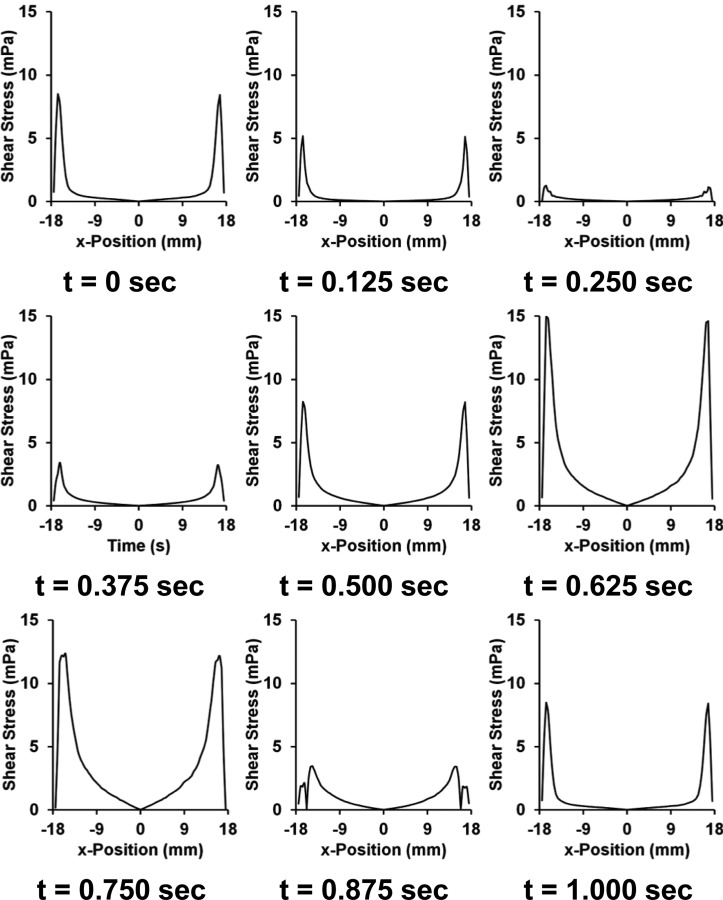
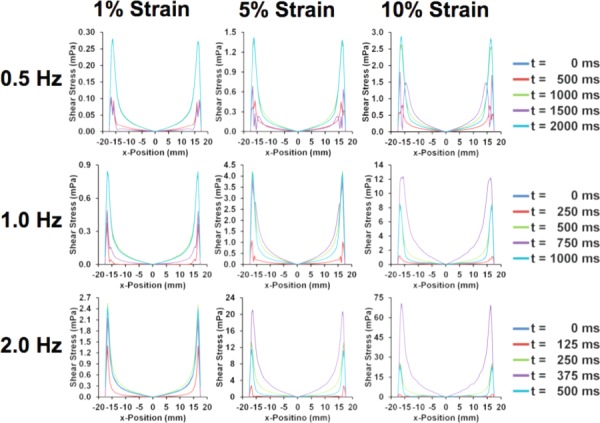
In vitro systems for applying mechanical strain to cultured cells are commonly used to investigate cellular mechanotransduction pathways in a variety of cell types. These systems often apply mechanical forces to a flexible membrane on which cells are cultured. A consequence of the motion of the membrane in these systems is the generation of flow and the unintended application of shear stress to the cells. We recently described a flexible system for applying mechanical strain to cultured cells, which uses a linear motor to drive a piston array to create biaxial strain within multiwell culture plates. To better understand the fluidic stresses generated by this system and other systems of this type, we created a computational fluid dynamics model to simulate the flow during the mechanical loading cycle. Alterations in the frequency or maximal strain magnitude led to a linear increase in the average fluid velocity within the well and a nonlinear increase in the shear stress at the culture surface over the ranges tested (0.5-2.0 Hz and 1-10% maximal strain). For all cases, the applied shear stresses were relatively low and on the order of millipascal with a dynamic waveform having a primary and secondary peak in the shear stress over a single mechanical strain cycle. These findings should be considered when interpreting experimental results using these devices, particularly in the case when the cell type used is sensitive to low magnitude, oscillatory shear stresses.
Figures
Similar articles
-
A Shearing-Stretching Device That Can Apply Physiological Fluid Shear Stress and Cyclic Stretch Concurrently to Endothelial Cells.J Biomech Eng. 2016 Mar;138(3):4032550. doi: 10.1115/1.4032550. J Biomech Eng. 2016. PMID: 26810848
-
A finite element model predicts the mechanotransduction response of tendon cells to cyclic tensile loading.Biomech Model Mechanobiol. 2008 Oct;7(5):405-16. doi: 10.1007/s10237-007-0104-z. Epub 2007 Sep 28. Biomech Model Mechanobiol. 2008. PMID: 17901992
-
Quantification and significance of fluid shear stress field in biaxial cell stretching device.Biomech Model Mechanobiol. 2011 Jul;10(4):559-64. doi: 10.1007/s10237-010-0255-1. Epub 2010 Sep 18. Biomech Model Mechanobiol. 2011. PMID: 20853016
-
Flow-induced stress on adherent cells in microfluidic devices.Lab Chip. 2015 Nov 7;15(21):4114-27. doi: 10.1039/c5lc00633c. Epub 2015 Sep 3. Lab Chip. 2015. PMID: 26334370 Review.
-
Computational fluid dynamics for improved bioreactor design and 3D culture.Trends Biotechnol. 2008 Apr;26(4):166-72. doi: 10.1016/j.tibtech.2007.11.012. Epub 2008 Feb 7. Trends Biotechnol. 2008. PMID: 18261813 Review.
Cited by
-
The effects of strain history on aortic valve interstitial cell activation in a 3D hydrogel environment.APL Bioeng. 2023 Apr 3;7(2):026101. doi: 10.1063/5.0138030. eCollection 2023 Jun. APL Bioeng. 2023. PMID: 37035541 Free PMC article.
-
A high throughput screening system for studying the effects of applied mechanical forces on reprogramming factor expression.Sci Rep. 2020 Sep 22;10(1):15469. doi: 10.1038/s41598-020-72158-5. Sci Rep. 2020. PMID: 32963285 Free PMC article.
-
Biomechanical regulation of breast cancer metastasis and progression.Sci Rep. 2021 May 10;11(1):9838. doi: 10.1038/s41598-021-89288-z. Sci Rep. 2021. PMID: 33972619 Free PMC article.
-
Using Cell and Organ Culture Models to Analyze Responses of Bone Cells to Mechanical Stimulation.Methods Mol Biol. 2025;2885:159-191. doi: 10.1007/978-1-0716-4306-8_9. Methods Mol Biol. 2025. PMID: 40448761
-
Mechanobiological conditioning of mesenchymal stem cells for enhanced vascular regeneration.Nat Biomed Eng. 2021 Jan;5(1):89-102. doi: 10.1038/s41551-020-00674-w. Epub 2021 Jan 22. Nat Biomed Eng. 2021. PMID: 33483713 Free PMC article.
References
-
- Koskinas, K. C. , Chatzizisis, Y. S. , Baker, A. B. , Edelman, E. R. , Stone, P. H. , and Feldman, C. L. , 2009, “The Role of Low Endothelial Shear Stress in the Conversion of Atherosclerotic Lesions From Stable to Unstable Plaque,” Curr. Opin. Cardiol., 24(6), pp. 580–590.10.1097/HCO.0b013e328331630b - DOI - PMC - PubMed
Publication types
MeSH terms
Substances
Grants and funding
LinkOut - more resources
Full Text Sources
Other Literature Sources
