. 2015 Jan 22;11(1):e1004603.
doi: 10.1371/journal.ppat.1004603. eCollection 2015 Jan.

Variability in tuberculosis granuloma T cell responses exists, but a balance of pro- and anti-inflammatory cytokines is associated with sterilization

Affiliations

Variability in tuberculosis granuloma T cell responses exists, but a balance of pro- and anti-inflammatory cytokines is associated with sterilization

Hannah Priyadarshini Gideon et al. PLoS Pathog. .

Abstract

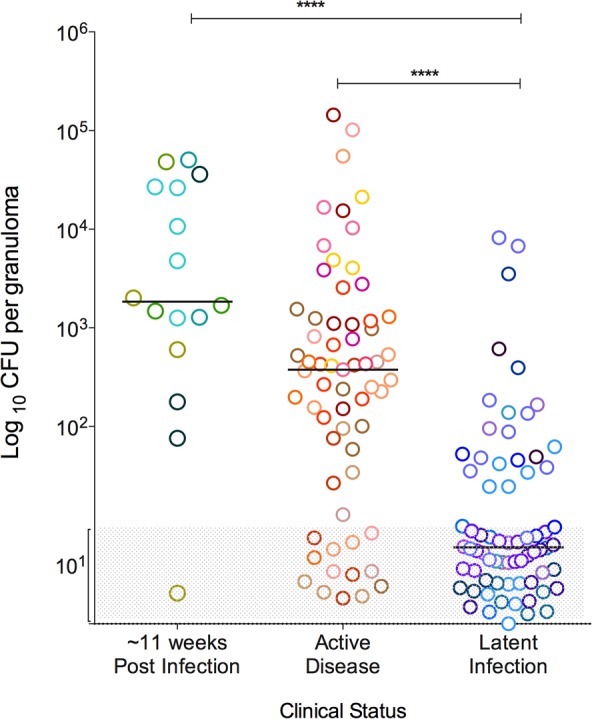
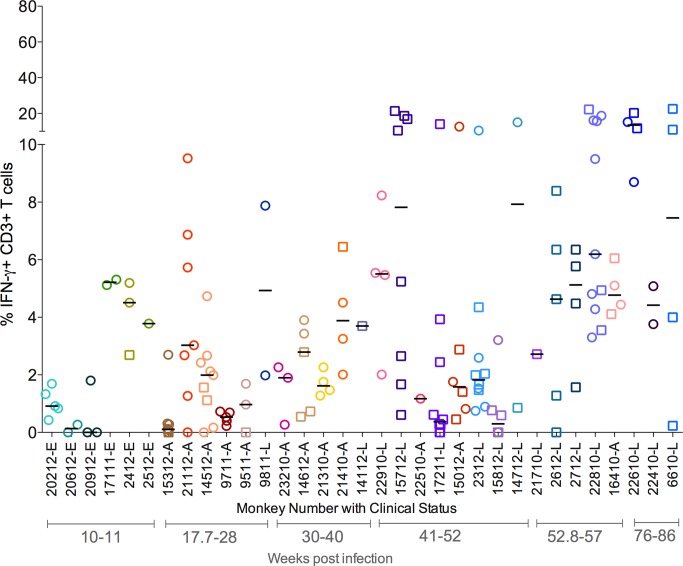
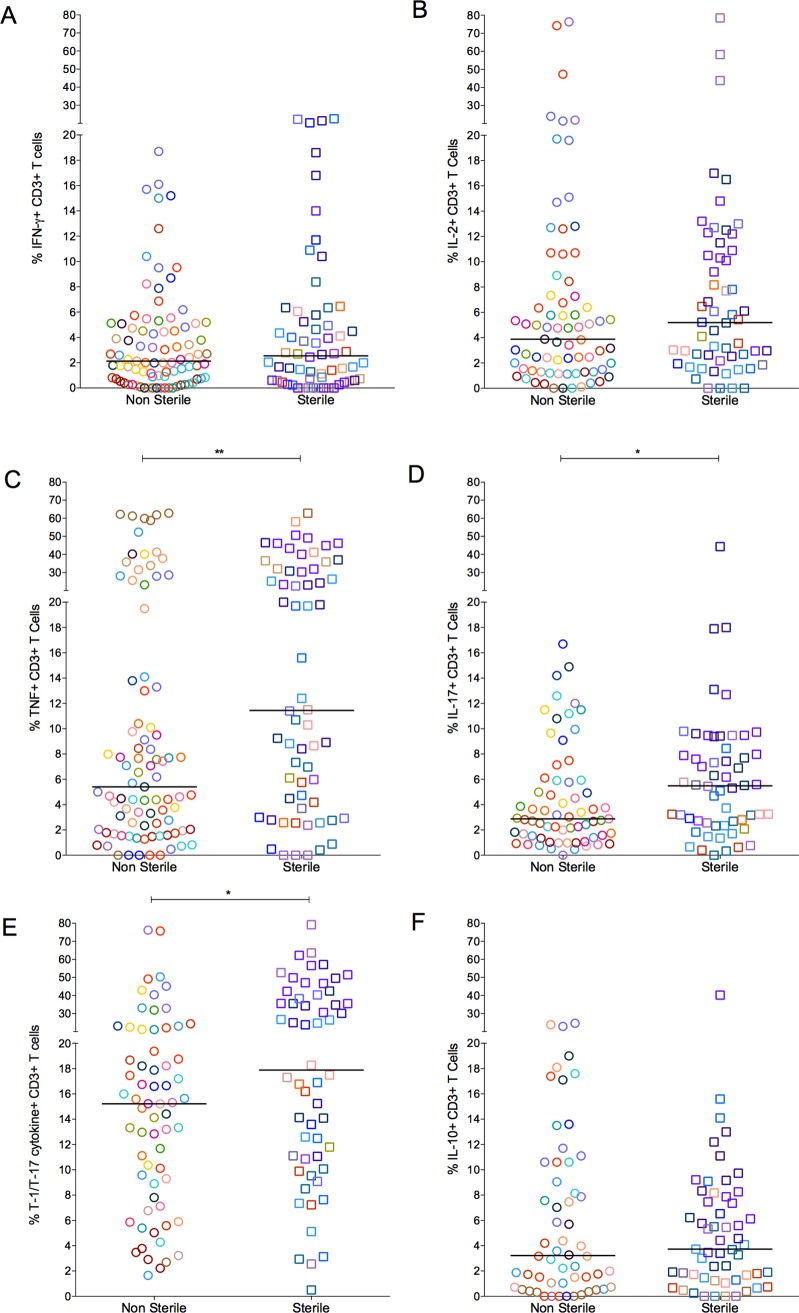
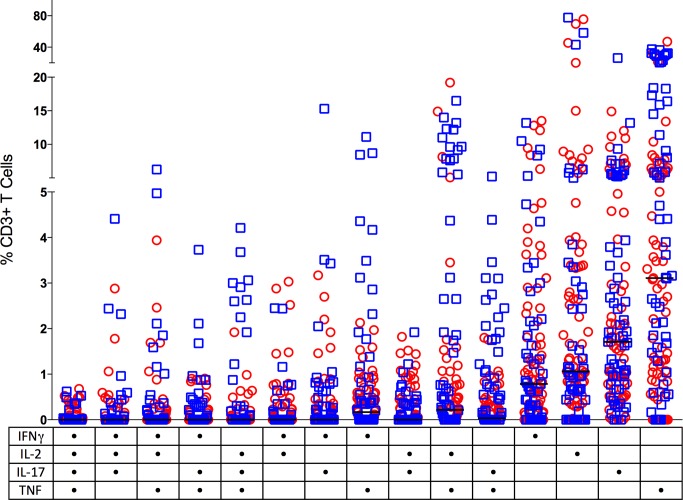
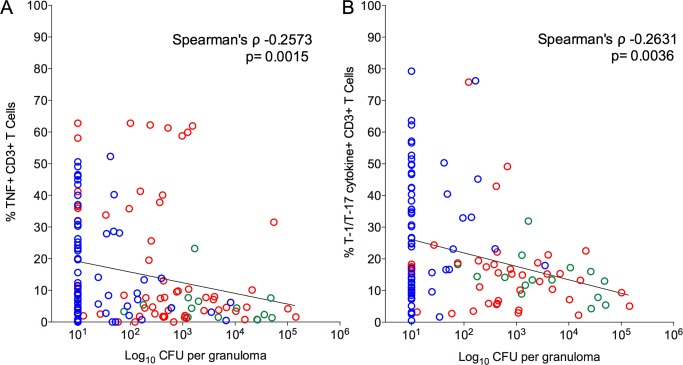
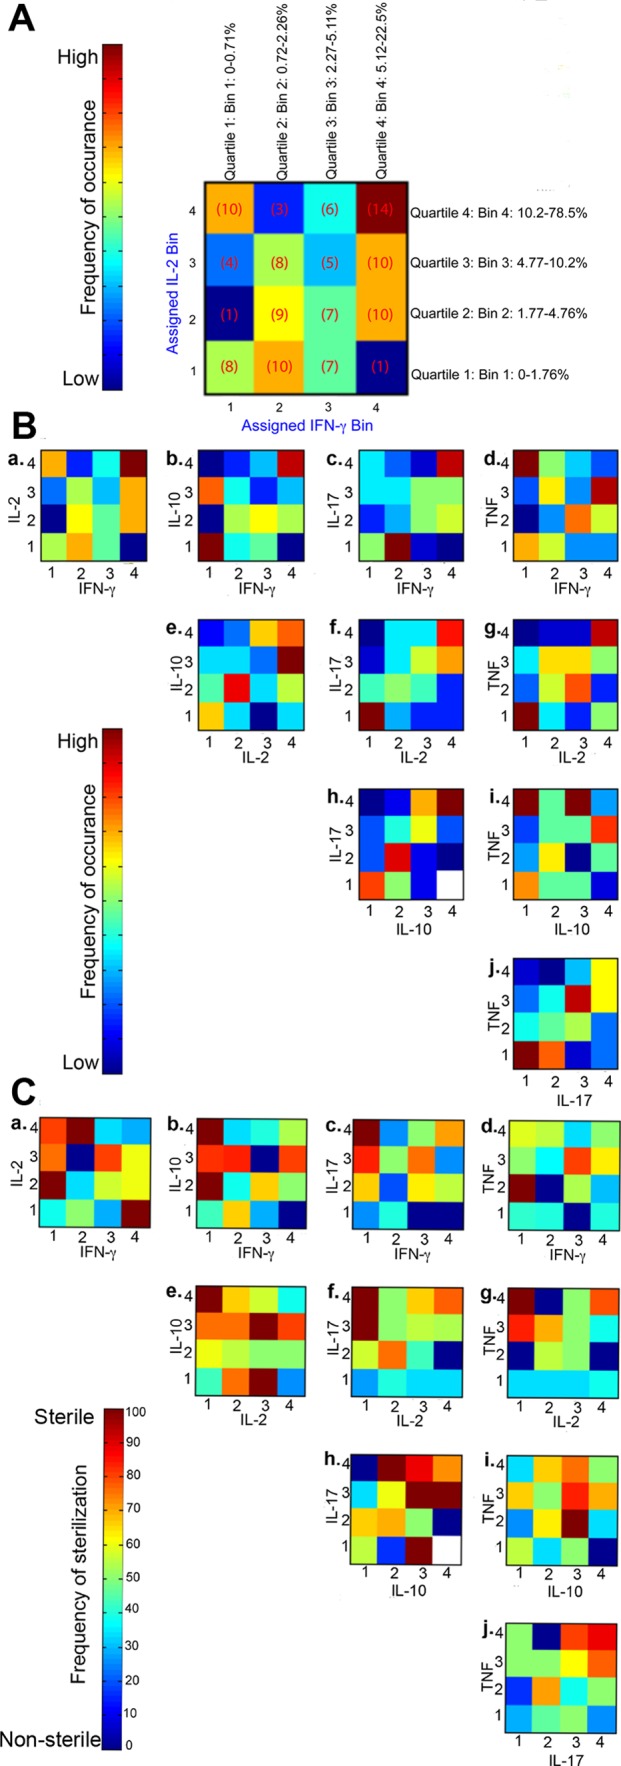
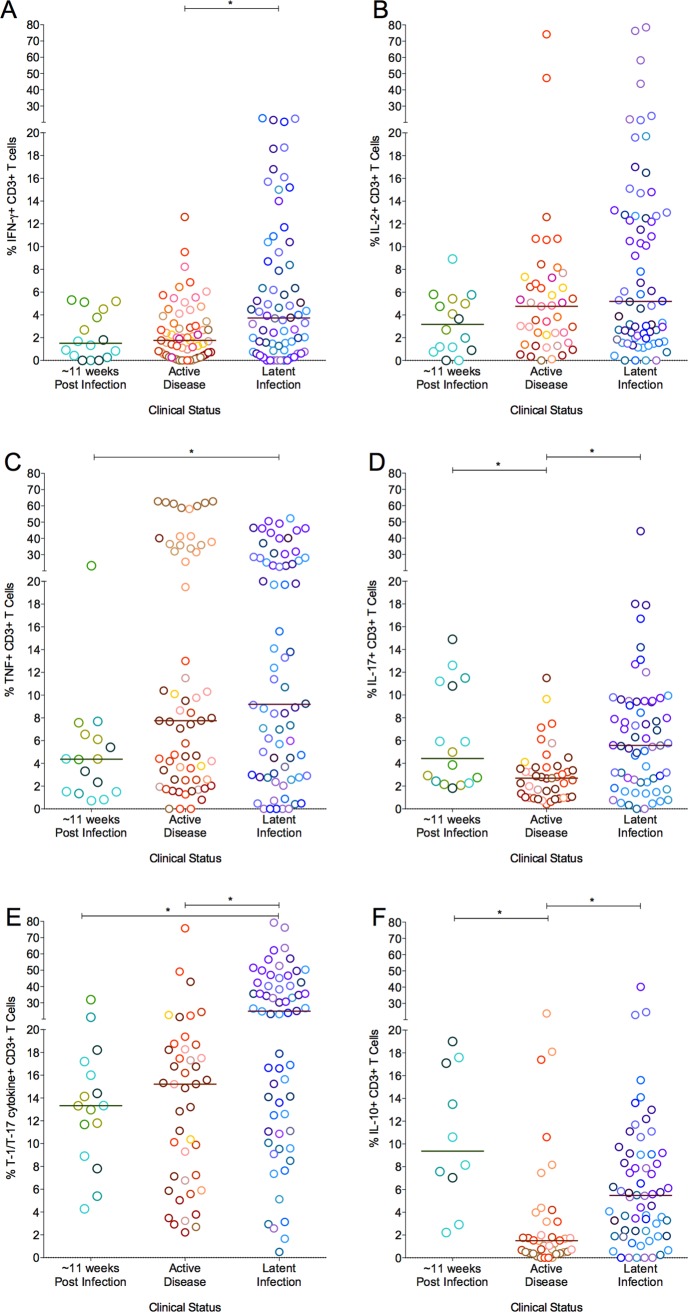
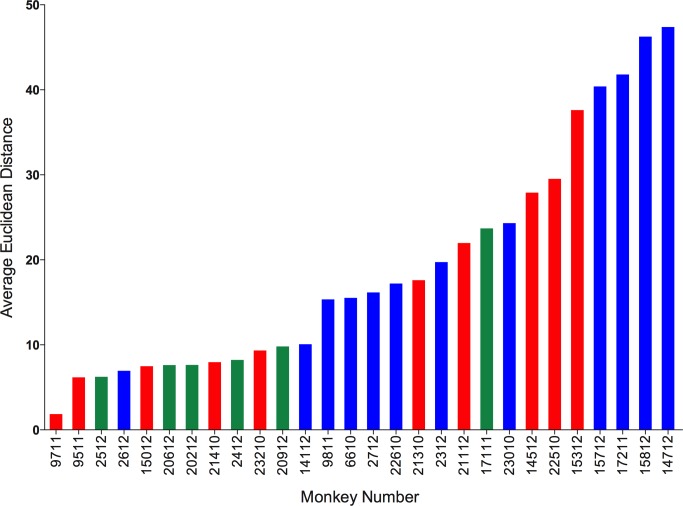
Lung granulomas are the pathologic hallmark of tuberculosis (TB). T cells are a major cellular component of TB lung granulomas and are known to play an important role in containment of Mycobacterium tuberculosis (Mtb) infection. We used cynomolgus macaques, a non-human primate model that recapitulates human TB with clinically active disease, latent infection or early infection, to understand functional characteristics and dynamics of T cells in individual granulomas. We sought to correlate T cell cytokine response and bacterial burden of each granuloma, as well as granuloma and systemic responses in individual animals. Our results support that each granuloma within an individual host is independent with respect to total cell numbers, proportion of T cells, pattern of cytokine response, and bacterial burden. The spectrum of these components overlaps greatly amongst animals with different clinical status, indicating that a diversity of granulomas exists within an individual host. On average only about 8% of T cells from granulomas respond with cytokine production after stimulation with Mtb specific antigens, and few "multi-functional" T cells were observed. However, granulomas were found to be "multi-functional" with respect to the combinations of functional T cells that were identified among lesions from individual animals. Although the responses generally overlapped, sterile granulomas had modestly higher frequencies of T cells making IL-17, TNF and any of T-1 (IFN-γ, IL-2, or TNF) and/or T-17 (IL-17) cytokines than non-sterile granulomas. An inverse correlation was observed between bacterial burden with TNF and T-1/T-17 responses in individual granulomas, and a combinatorial analysis of pair-wise cytokine responses indicated that granulomas with T cells producing both pro- and anti-inflammatory cytokines (e.g. IL-10 and IL-17) were associated with clearance of Mtb. Preliminary evaluation suggests that systemic responses in the blood do not accurately reflect local T cell responses within granulomas.


Conflict of interest statement

The authors have declared that no competing interests exist.

Figures

Figure 1
Figure 1. Bacterial burden of individual granulomas.
Bacterial burden is represented as the colony forming units (CFU) in logarithmic scale, per granuloma. Greyed area represents sterile granulomas (indicated as log10 1), which were assigned arbitrary range of values so that all granulomas can be seen in the graph. Each symbol represents a granuloma and a color represents granulomas from one animal. Granulomas are grouped as per the clinical status of the animal, where those animals that were infected for ∼11 weeks are in shades of green, active disease in shades of warm colors and latent infection in shades of cool colors. (****: p<0.0001, Dunn’s multiple test comparison).
Figure 2
Figure 2. Absolute cell counts per granuloma.
A: Total number of cells obtained from granuloma. Granulomas with a cell count less than the detection limit was assigned 9×10⁴ before the correcting for the dilution factor. B: Total number of T cell counts, defined by CD3+ per granuloma. C is the total percentage of live CD3+ cell per granulomas and was used to extrapolate the absolute T cell count per granuloma (B) from the total granuloma cell count (A). Each symbol represents a granuloma. Each color represents an animal. Granulomas are grouped based on bacterial burden of the granuloma: non-sterile (Mtb cultured, in open circles) or sterile (in open squares). Solid line indicates median in each group. Dotted line indicates the detection limit (1×10⁵) before correcting for the dilution factor. (****: p<0.0001, **: p≤0.001, Non-parametric Mann-Whitney).
Figure 3
Figure 3. Proportion of T cells with IFN-γ response from each animal included in the study.
Each symbol represents an individual granuloma. Each individual granuloma had a distinct cytokine profile and there was a range of cytokine response in each animal. Similar responses were seen for other cytokines (S2 Fig.). Each symbol represents a granuloma. Each color represents an animal. Granulomas are marked based on bacterial burden of the granuloma: non-sterile (Mtb cultured, in open circles) or sterile (in open squares). Clinical status is represented for each animal along with monkey number [“E”: ∼11 weeks post infection; “A”: Active disease; “L”: Latent Infection]. Animals are arranged in the order of increasing post-Mtb infection time.
Figure 4
Figure 4. The proportion of T cells with cytokine response of IFN-γ (A), IL-2 (B), TNF (C), IL-17 (D), T-1/T-17 (E) and IL-10 (F).
Each symbol represents a granuloma. Each color represents an animal. Granulomas are marked and grouped based on bacterial burden of the granuloma: non-sterile in open circles and sterile in open squares. The frequency of cytokine producing T cells overlapped considerably between the groups (* = <0.05; **<0.01, Nonparametric Mann-Whitney test).
Figure 5
Figure 5. CD3+ T cells making single (one) or multiple (two, three or four) cytokines from individual granulomas.
Non-sterile granulomas are in open circles (red) and sterile granulomas are represented as open squares (blue). Solid line indicates median response. The table on the X axis reflects the groups positive for each cytokine represented by a dot. There was no significant difference between the multiple cytokine pattern of response between sterile and non-sterile granulomas or between various clinical states of the animal. (n = 121).
Figure 6
Figure 6. Correlation of pro-inflammatory T cell cytokine response to the bacterial burden (CFU per granuloma) in each of the individual granulomas.
Significant inverse correlation was observed between frequencies of TNF (A) and T-1/T-17 (B) producing T cells and bacterial burden. CFU per granuloma value of zero were transformed to “1” and included in this analysis. Each symbol represents a granuloma. Line indicates the slope. The clinical status of an animal is represented by the color of the granuloma. Animals with active disease are in red, latent infection in blue and those with ∼11 weeks of infection are in green.
Figure 7
Figure 7. Pairwise occurrence matrix and sterilization frequency of T cell cytokines.
A is an example figure: For each cytokine variable of the granuloma, continuous percentage values were binned into one of four categories depending on quartile distribution (bins 1, 2, 3, or 4). Number of granulomas (number of times particular combination of binned cytokines occurred) in each of the bins were counted, for example, low IFN-γ (bin 1) and high IL-2 (bin 4) had 10 granulomas and summarized in a 4×4 co-occurrence matrix. For each pairwise cytokine comparison, the frequency of occurrence was summarized in heat-map form. B is the frequency of occurrence for all pairwise combination of T cell cytokines from individual granulomas. The scale represents the frequency of occurrence ranging from none/low to high. C is the sterilization frequency where matrices were constructed in a similar fashion by calculating the number of times sterilization occurred in a given particular cytokine combination and magnitude. Each square in each 4×4 heat-map therefore represents the frequency of sterilization under that particular combination of feature bins (# of sterilizing granulomas with cytokine A at level X and cytokine B at level Y out of total # of granulomas with cytokine A at level X and cytokine B at level Y). For each pairwise cytokine comparison, the frequency of sterilization under that particular combination of cytokines and levels is plotted and summarized in heat-map form. White squares indicate that granulomas with particular combination of cytokines at those levels did not occur.
Figure 8
Figure 8. The proportion of T cells with cytokine response of IFN-γ (A), IL-2 (B), TNF (C), IL-17 (D), T-1/T-17 (E) and IL-10 (F).
Each symbol represents a granuloma. Each color represents an animal. Granulomas are grouped based on the clinical status of the animals. Solid line indicates median response. (*: p<0.05; **: p<0.001, ***: p<0.0001. Dunn’s multiple test comparison).
Figure 9
Figure 9. Systemic and local T cell responses.
Euclidean distance between T cell cytokines from blood (systemic) and each of the individual granulomas (local) of animal were calculated. The distances were averaged per animal and represented as the average Euclidean distance. Average Euclidean distance provides an estimate for “relatedness” between the systemic T cell response and local T cell response. Each bar represents an animal. Animals with active disease are represented in red, latent infection in blue and those infected for ∼11 weeks in green. Animals are arranged in increasing average Euclidean distance.

References

    1. Glaziou P, Falzon D, Floyd K, Raviglione M (2013) Global epidemiology of tuberculosis. Semin Respir Crit Care Med 34: 3–16. 10.1055/s-0032-1333467 - DOI - PubMed
    1. Lin PL, Ford CB, Coleman MT, Myers AJ, Gawande R, et al. (2014) Sterilization of granulomas is common in active and latent tuberculosis despite within-host variability in bacterial killing. Nat Med 20: 75–79. 10.1038/nm.3412 - DOI - PMC - PubMed
    1. Mattila JT, Ojo OO, Kepka-Lenhart D, Marino S, Kim JH, et al. (2013) Microenvironments in tuberculous granulomas are delineated by distinct populations of macrophage subsets and expression of nitric oxide synthase and arginase isoforms. J Immunol 191: 773–784. 10.4049/jimmunol.1300113 - DOI - PMC - PubMed
    1. Flynn JL, Chan J, Lin PL (2011) Macrophages and control of granulomatous inflammation in tuberculosis. Mucosal Immunol 4: 271–278. 10.1038/mi.2011.14 - DOI - PMC - PubMed
    1. Phuah JY, Mattila JT, Lin PL, Flynn JL (2012) Activated B cells in the granulomas of nonhuman primates infected with Mycobacterium tuberculosis. Am J Pathol 181: 508–514. 10.1016/j.ajpath.2012.05.009 - DOI - PMC - PubMed

Publication types

MeSH terms