. 2016 May;17(3):184-90.
doi: 10.1111/pedi.12255. Epub 2015 Jan 21.

Testosterone concentration and insulin sensitivity in young men with type 1 and type 2 diabetes

Affiliations

Testosterone concentration and insulin sensitivity in young men with type 1 and type 2 diabetes

Megan M Kelsey et al. Pediatr Diabetes. 2016 May.

Abstract

Objective: Reduced testosterone, a recognized comorbidity of reduced insulin sensitivity (IS) and type 2 diabetes (T2D), has also been reported in adult males with type 1 diabetes (T1D). However, there are limited data on how early reduced testosterone occurs, and whether it is related to the reduced IS in T1D. Leptin, a modulator of the HPG-axis, may also influence testosterone in T1D. We hypothesized that IS and leptin would be associated with total testosterone (TT), and free androgen index (FAI) in adolescent males with T1D.

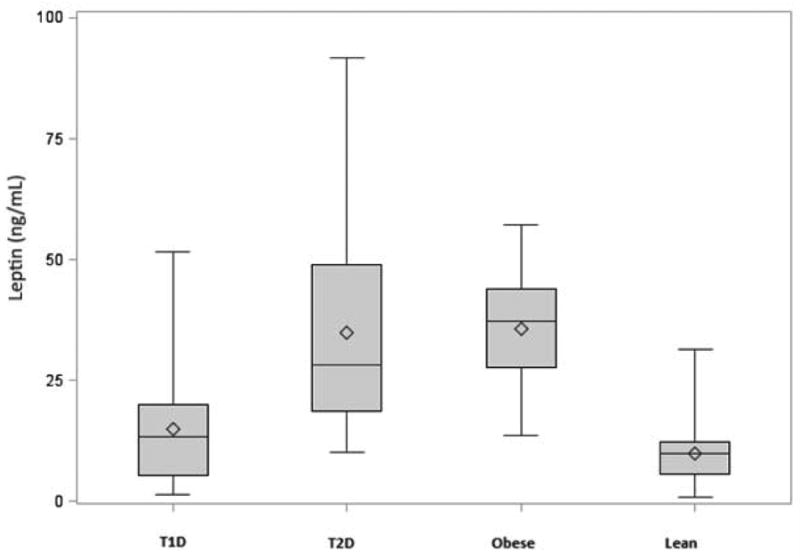
Methods: T1D (n = 35), T2D (n = 13), lean (n = 13) and obese (n = 9) adolescent males had IS measured by hyperinsulinemic-euglycemic clamps (glucose infusion rate [GIR]), in addition to leptin, sex hormone binding globulin (SHBG), TT, and FAI. The cohort was stratified into those with T1D (n = 35) and those without (n = 35).

Results: TT and SHBG were lower in T2D boys vs. lean controls, and GIR and leptin correlated with FAI and TT in non-T1D participants. However, despite being insulin resistant, adolescent males with T1D had normal TT and FAI, unrelated to GIR. In T1D, leptin was inversely associated with TT (p = 0.005) and FAI (p = 0.01), independent of puberty, hemoglobin A1c (HbA1c), diabetes duration, body mass index (BMI) z-score and GIR.

Conclusion: Leptin accounted for a significant proportion of the variability of testosterone in T1D. However, despite reduced IS, there was no association between IS and testosterone in T1D adolescents. These observations suggest that the mechanisms affecting testosterone may differ between adolescent males with and without T1D.

Keywords: insulin sensitivity; leptin; puberty; testosterone; type 1 diabetes.


Conflict of interest statement

Duality of interest: Drs. Bjornstad, Kelsey, McFann and Nadeau have no conflict of interest to disclose.

Figures

Figures 1A-D
Figures 1A-D
A. Insulin sensitivity among T1D, T2D, obese and lean participants * Mean values are represented by hollow diamonds, and median by the horizontal lines in the boxes. The heights of the boxes represent the 25th to 75th ranges. The upper and lower fences represent the maximum and minimum values respectively. B. Total testosterone concentrations among T1D, T2D, obese and lean participants * Mean values are represented by hollow diamonds, and median by the horizontal lines in the boxes. The heights of the boxes represent the 25th to 75th ranges. The upper and lower fences represent the maximum and minimum values respectively. C. Free androgen index concentrations among T1D, T2D, obese and lean participants * Mean values are represented by hollow diamonds, and median by the horizontal lines in the boxes. The heights of the boxes represent the 25th to 75th ranges. The upper and lower fences represent the maximum and minimum values respectively. D. Leptin concentrations among T1D, T2D, obese and lean participants * Mean values are represented by hollow diamonds, and median by the horizontal lines in the boxes. The heights of the boxes represent the 25th to 75th ranges. The upper and lower fences represent the maximum and minimum values respectively.
Figures 1A-D
Figures 1A-D
A. Insulin sensitivity among T1D, T2D, obese and lean participants * Mean values are represented by hollow diamonds, and median by the horizontal lines in the boxes. The heights of the boxes represent the 25th to 75th ranges. The upper and lower fences represent the maximum and minimum values respectively. B. Total testosterone concentrations among T1D, T2D, obese and lean participants * Mean values are represented by hollow diamonds, and median by the horizontal lines in the boxes. The heights of the boxes represent the 25th to 75th ranges. The upper and lower fences represent the maximum and minimum values respectively. C. Free androgen index concentrations among T1D, T2D, obese and lean participants * Mean values are represented by hollow diamonds, and median by the horizontal lines in the boxes. The heights of the boxes represent the 25th to 75th ranges. The upper and lower fences represent the maximum and minimum values respectively. D. Leptin concentrations among T1D, T2D, obese and lean participants * Mean values are represented by hollow diamonds, and median by the horizontal lines in the boxes. The heights of the boxes represent the 25th to 75th ranges. The upper and lower fences represent the maximum and minimum values respectively.

References

    1. Dhindsa S, Prabhakar S, Sethi M, Bandyopadhyay A, Chaudhuri A, Dandona P. Frequent occurrence of hypogonadotropic hypogonadism in type 2 diabetes. The Journal of clinical endocrinology and metabolism. 2004;89(11):5462–8. Epub 2004/11/09. - PubMed
    1. Kapoor D, Aldred H, Clark S, Channer KS, Jones TH. Clinical and biochemical assessment of hypogonadism in men with type 2 diabetes: correlations with bioavailable testosterone and visceral adiposity. Diabetes Care. 2007;30(4):911–7. Epub 2007/03/30. - PubMed
    1. Moriarty-Kelsey M, Harwood JE, Travers SH, Zeitler PS, Nadeau KJ. Testosterone, obesity and insulin resistance in young males: evidence for an association between gonadal dysfunction and insulin resistance during puberty. Journal of pediatric endocrinology & metabolism : JPEM. 2010;23(12):1281–7. Epub 2011/07/01. - PMC - PubMed
    1. van Dam EW, Dekker JM, Lentjes EG, Romijn FP, Smulders YM, Post WJ, et al. Steroids in adult men with type 1 diabetes: a tendency to hypogonadism. Diabetes Care. 2003;26(6):1812–8. Epub 2003/05/27. - PubMed
    1. Rohrer T, Stierkorb E, Heger S, Karges B, Raile K, Schwab KO, et al. Delayed pubertal onset and development in German children and adolescents with type 1 diabetes: cross-sectional analysis of recent data from the DPV diabetes documentation and quality management system. European journal of endocrinology / European Federation of Endocrine Societies. 2007;157(5):647–53. Epub 2007/11/07. - PubMed

Publication types