. 2015 Feb 13;26(6):065502.
doi: 10.1088/0957-4484/26/6/065502. Epub 2015 Jan 22.

DNA motion induced by electrokinetic flow near an Au coated nanopore surface as voltage controlled gate

Affiliations

DNA motion induced by electrokinetic flow near an Au coated nanopore surface as voltage controlled gate

Manabu Sugimoto et al. Nanotechnology. .

Abstract

We used fluorescence microscopy to investigate the diffusion and drift motion of λ DNA molecules on an Au-coated membrane surface near nanopores, prior to their translocation through solid-state nanopores. With the capability of controlling electric potential at the Au surface as a gate voltage, Vgate, the motions of DNA molecules, which are presumably generated by electrokinetic flow, vary dramatically near the nanopores in our observations. We carefully investigate these DNA motions with different values of Vgate in order to alter the densities and polarities of the counterions, which are expected to change the flow speed or direction, respectively. Depending on Vgate, our observations have revealed the critical distance from a nanopore for DNA molecules to be attracted or repelled-DNA's anisotropic and unsteady drifting motions and accumulations of DNA molecules near the nanopore entrance. Further finite element method (FEM) numerical simulations indicate that the electrokinetic flow could qualitatively explain these unusual DNA motions near metal-collated gated nanopores. Finally, we demonstrate the possibility of controlling the speed and direction of DNA motion near or through a nanopore, as in the case of recapturing a single DNA molecule multiple times with alternating current voltages on the Vgate.


Figures
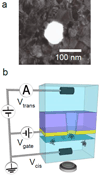
Figure 1
Figure 1
(a) a TEM image of Au coated SiN nanopore. High contrast variations of the polycrystalline gold films is clearly displayed. (b) Schematic illustration of the experimental setup featuring the 50 nm thick Au film under the 200 nm thick SiN membrane. A cis chamber below the nanopore where DNA molecules are introduced faces to Au surface. The nanopore’s truncated cone angle is near 5° and the narrower end of the cone is on the cis side. Bias voltages, Vcis (= 0 V) and Vtrans are applied on the AgCl electrodes inserted into cis or trans chambers, respectively. As a gate voltage, Vgate is applied on Au film. The focus plane (a blue plane) and location of a microscope are schematically illustrated. More details of this experimental setup containing the wiring method on the Au film are described in SI.
Figure 2
Figure 2
DNA motions at Vgate = Vcis = 0 and Vtrans = 0.3 V in 0.01 M KCl. (a) – (d) Time resolved fluorescence images focused near membrane surface showing the motions of DNA molecules. Images are extracted at t = 0.00, 0.14, 0.29 and 0.43 sec from a sequence of 1000 frames recorded at 14 Hz. A DNA molecule (red arrow) shows a drifting motion toward a nanopore located at the center in the images, which is shown in yellow circles. (e) The magnitude of the vr, as a function of r on the nanopore membrane surface. A solid curve, calculated value of vr plotted in (e), is based on the simple theoretical model by Ohm’s law with the experimentally measured ionic currents through nanopore. Inset images show typical trajectories of 8 DNA molecules into a nanopore before their translocations, and applied voltages on the trans, cis and gate electrodes.
Figure 3
Figure 3
DNA motions at Vgate = −0.4 V, Vcis = 0 and Vtrans = 0.3 V in 0.01 M KCl. (a)–(h) Images extracted from a sequential 14 frames per second movie showing typical behavior of DNA molecules. One green arrowed DNA below a nanopore (a yellow cross) is nearly at rest while the other green arrowed above is gradually drifting away. From (i) to (l), images are extracted at t = 0.00, 0.14, 0.29 and 0.43 sec. A red arrowed DNA is landing and entering into the nanopore. (m) A drawing of typical DNA trajectories in the vicinity of a nanopore reveals two types of DNA motions. 8 red trajectories present DNA molecules for translocations into the nanopore while 7 green trajectories show the existence of DNA molecules drifting away radially from the nanopore. Arrows indicate the direction of the green trajectories. A blue circle is likely the boundary between these two categories of motions. (n) A histogram of radial velocity of DNA molecules drifting in the ranges 0 <r ≤ 2.1 µm and 2.1 <r ≤ 4.2 µm. Apparently the distribution shows the anisotropic DNA motions in the radial direction. (o) A schematic of the extrapolated two different DNA motions, red and green arrows in the rz plane near nanopore with the boundary is drawn in blue lines. The highlighted area corresponds to the imaging range by our optical microscope in the z axis. (p)–(s) DNA aggregations near a nanopore at Vgate= −0.4 V, Vcis = 0 and Vtrans = 0.3 V in 0.01 M KCl. (p) Over 20 DNA molecules are aggregated near the nanopore in 120 sec. (q)–(s) The images are taken 2, 8, 16 sec after turning all electrode’s voltages to 0 V at (p) for eliminating electric fields in solution. Free diffusion of DNA molecules from the aggregated DNA is observed in this image sequence. No DNA molecule is left at the nanopore in (s).
Figure 4
Figure 4
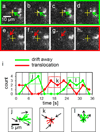
DNA motions near a nanopore at Vgate = 0.5 V, Vcis = 0 and Vtrans = 0.3 V in 0.01 M KCl. (a) – (h) Images extracted every other frame from a 14 frames per second movie. Time intervals between the sequential images are 0.14 sec. (a) The image near t = 6 sec. One green arrow points a DNA molecule moving away from a nanopore depicted as a cross in the images from (a) to (d). (e) The image near t =15 sec. One red arrow points a DNA molecule moving toward a nanopore in the images from (e) to (g) and then entering the pore before the image (h). (i) Count the number of DNA molecules entering within r < 2.1 µm either translocations (red) or drift away (green) in every 3 seconds. For example, from t = 6 to 12 sec, no DNA molecules enter the nanopore, they all drift away toward right as shown by the 7 DNA trajectories, depicted in the green dotted box j in (i). Instead, all 6 DNA molecules in the red dotted box k on (i), entered the nanopore from t = 15 to 21 sec as their trajectories are plotted in (k). After t = 24, as the green dotted box l depicts, DNA molecules drifting away again. The anisotropic DNA drift motions are shown in their trajectories plotted in (l).
Figure 5
Figure 5
A single DNA molecule oscillating in a nanopore by applying a 5 Hz square wave with 0.7 Vpp and 0.15 V offset on Vgate relative to Vcis in 0.01 M KCl. (a) – (d) Image frames with a nanopore marked in a yellow circle are selected at t = 0.79, 0.86, 0.93 and 1.08 sec. A DNA molecule blinking at the nanopore is detected as a DNA appears in (b) and (d) while not in (a) and (c). (e) Fluorescence intensity of the DNA with the square wave is plotted in time. Synchronization between them is identified. Blue circled points are the intensity values for the presented images from (a) to (d) above.
Figure 6
Figure 6
DNA transport simulations under the voltage relations of our experiments, Vcis= 0 and Vtrans = 0.3 V with various Vgate voltages. Red arrows indicate the direction and the logarithmic scale of the magnitude of the predicted velocities for DNA molecules described in text. (a) 3.1.Vgate = Vcis = 0. Spherically symmetric motions of DNA molecules toward a nanopore can be expected. (b) 3.2. Vgate(= − 0.4 V) < Vcis. The arrows indicated that DNA molecules on the top of the nanopore opening entrance move toward nanopore while DNA molecules near nanopore membrane surface move away from the nanopore. (c) 3.3. Vgate (= 0.5 V) > Vcis. The arrows reveal circulating vortex motions above nanopore opening.

Similar articles

Cited by

References

    1. Li J, Stein D, McMullan C, Branton D, Aziz MJ, Golovchenko JA. Ion-beam sculpting at nanometre length scales. Nature. 2001;412:166–169. - PubMed
    1. Storm AJ, Chen JH, Ling XS, Zandbergen HW, Dekker C. Fabrication of solid-state nanopores with single-nanometre precision. Nat. Mater. 2003;2:537–540. - PubMed
    1. Stein D, Li J, Golovchenko JA. Ion-beam sculpting time scales. Phys. Rev. Lett. 2002;89:276106. - PubMed
    1. Branton D, Deamer DW, Marziali A, Bayley H, Benner SA, Butler T, Di Ventra M, Garaj S, Hibbs A, Huang X, Jovanovich SB, Krstic PS, Lindsay S, Ling XS, Mastrangelo CH, Meller A, Oliver JS, Pershin YV, Ramsey JM, Riehn R, Soni GV, Tabard-Cossa V, Wanunu M, Wiggin M, Schloss JA. The potential and challenges of nanopore sequencing. Nat. Biotechnol. 2008;26:1146–1153. - PMC - PubMed
    1. Keyser UF. Controlling molecular transport through nanopores. J. R. Soc. Lond. Interface. 2011;8:1369–1378. - PMC - PubMed

Publication types

LinkOut - more resources