Delimiting areas of endemism through kernel interpolation
- PMID: 25611971
- PMCID: PMC4303434
- DOI: 10.1371/journal.pone.0116673
Delimiting areas of endemism through kernel interpolation
Abstract
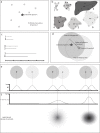
We propose a new approach for identification of areas of endemism, the Geographical Interpolation of Endemism (GIE), based on kernel spatial interpolation. This method differs from others in being independent of grid cells. This new approach is based on estimating the overlap between the distribution of species through a kernel interpolation of centroids of species distribution and areas of influence defined from the distance between the centroid and the farthest point of occurrence of each species. We used this method to delimit areas of endemism of spiders from Brazil. To assess the effectiveness of GIE, we analyzed the same data using Parsimony Analysis of Endemism and NDM and compared the areas identified through each method. The analyses using GIE identified 101 areas of endemism of spiders in Brazil GIE demonstrated to be effective in identifying areas of endemism in multiple scales, with fuzzy edges and supported by more synendemic species than in the other methods. The areas of endemism identified with GIE were generally congruent with those identified for other taxonomic groups, suggesting that common processes can be responsible for the origin and maintenance of these biogeographic units.
Conflict of interest statement
Figures


Similar articles
-
Areas of endemism of land planarians (Platyhelminthes: Tricladida) in the Southern Atlantic Forest.PLoS One. 2020 Jul 20;15(7):e0235949. doi: 10.1371/journal.pone.0235949. eCollection 2020. PLoS One. 2020. PMID: 32687493 Free PMC article.
-
DBSCAN and GIE, Two Density-Based "Grid-Free" Methods for Finding Areas of Endemism: A Case Study of Flea Beetles (Coleoptera, Chrysomelidae) in the Afrotropical Region.Insects. 2021 Dec 13;12(12):1115. doi: 10.3390/insects12121115. Insects. 2021. PMID: 34940202 Free PMC article.
-
Areas of endemism of Lauraceae: new insights on the biogeographic regionalization of the Espinhaço Range, Brazil.Cladistics. 2022 Apr;38(2):246-263. doi: 10.1111/cla.12481. Epub 2021 Jul 16. Cladistics. 2022. PMID: 35277894
-
Areas of endemism of Pteridaceae (Polypodiopsida) in Brazil: a first approach.Cladistics. 2024 Apr;40(2):157-180. doi: 10.1111/cla.12568. Epub 2023 Dec 20. Cladistics. 2024. PMID: 38124237 Review.
-
Trapped indoors? Long-distance dispersal in mygalomorph spiders and its effect on species ranges.J Comp Physiol A Neuroethol Sens Neural Behav Physiol. 2021 Mar;207(2):279-292. doi: 10.1007/s00359-020-01459-x. Epub 2021 Jan 30. J Comp Physiol A Neuroethol Sens Neural Behav Physiol. 2021. PMID: 33515318 Review.
Cited by
-
Areas of endemism of land planarians (Platyhelminthes: Tricladida) in the Southern Atlantic Forest.PLoS One. 2020 Jul 20;15(7):e0235949. doi: 10.1371/journal.pone.0235949. eCollection 2020. PLoS One. 2020. PMID: 32687493 Free PMC article.
-
Temporal trend of tuberculosis incidence and its spatial distribution in Macapá - Amapá.Rev Saude Publica. 2021 Dec 1;55:96. doi: 10.11606/s1518-8787.2021055003431. eCollection 2021. Rev Saude Publica. 2021. PMID: 34878090 Free PMC article.
-
Spatial pattern and temporal trend of mortality due to tuberculosis.Rev Lat Am Enfermagem. 2018;26:e2992. doi: 10.1590/1518-8345.2049.2992. Epub 2018 May 7. Rev Lat Am Enfermagem. 2018. PMID: 29742272 Free PMC article.
-
Infomap Bioregions: Interactive Mapping of Biogeographical Regions from Species Distributions.Syst Biol. 2017 Mar 1;66(2):197-204. doi: 10.1093/sysbio/syw087. Syst Biol. 2017. PMID: 27694311 Free PMC article.
-
The decline and fall of the mammalian stem.PeerJ. 2024 Feb 27;12:e17004. doi: 10.7717/peerj.17004. eCollection 2024. PeerJ. 2024. PMID: 38436024 Free PMC article.
References
-
- Nelson G,Platnick NI (1981) Systematics and biogeography: cladistics and vicariance. New York: Columbia University Press.
-
- Crisci JV,Katinas L,Posadas P (2003) Historical Biogeography: An Introduction. Harvard Un. Cambridge.
Publication types
MeSH terms
LinkOut - more resources
Full Text Sources
Other Literature Sources

