. 2015 Feb;10(2):316-33.
doi: 10.1038/nprot.2015.020. Epub 2015 Jan 22.

Palladium-based mass tag cell barcoding with a doublet-filtering scheme and single-cell deconvolution algorithm

Affiliations

Palladium-based mass tag cell barcoding with a doublet-filtering scheme and single-cell deconvolution algorithm

Eli R Zunder et al. Nat Protoc. 2015 Feb.

Abstract

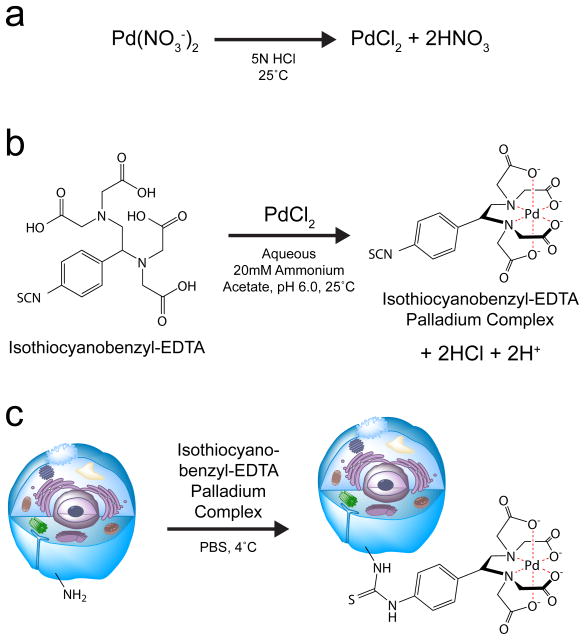
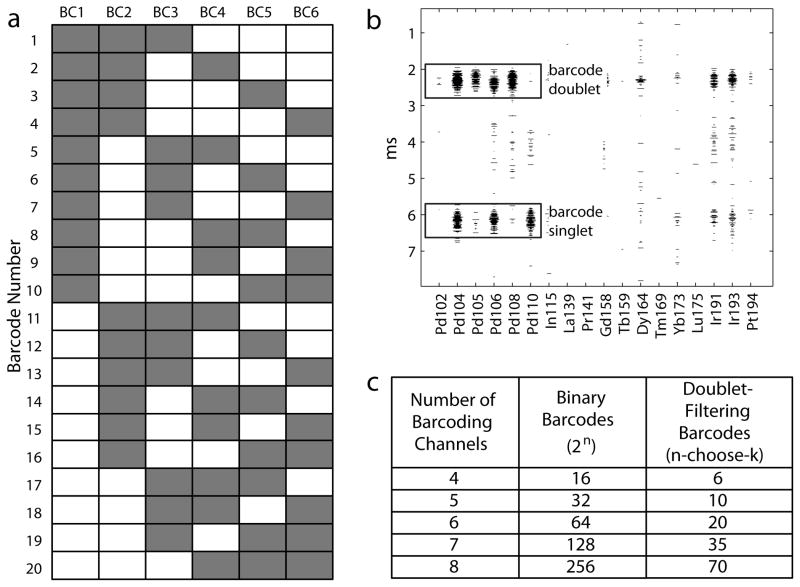
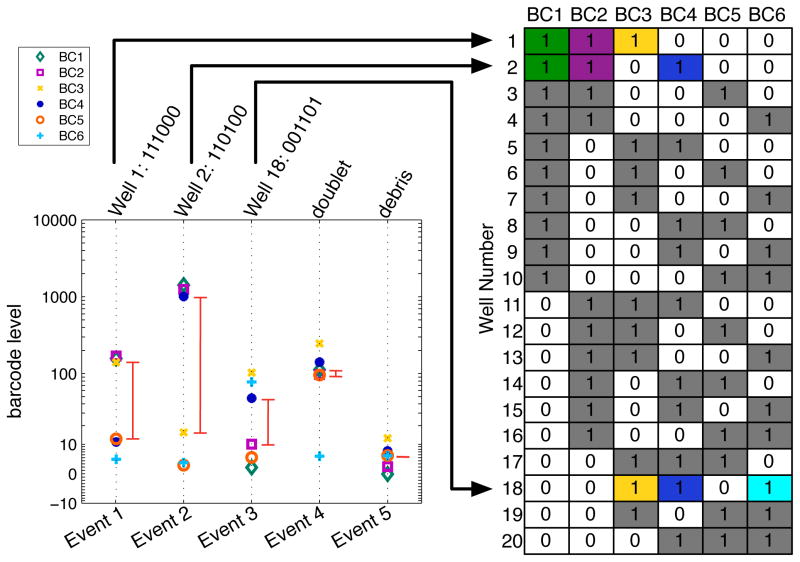
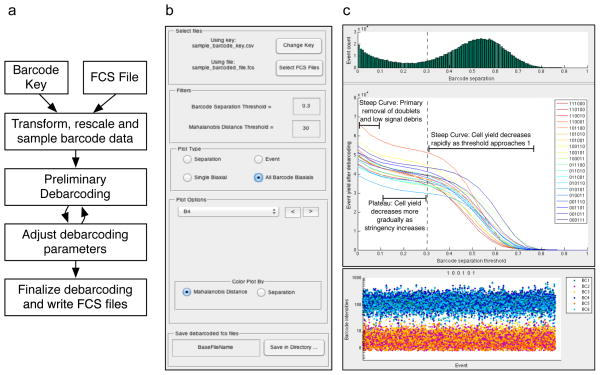
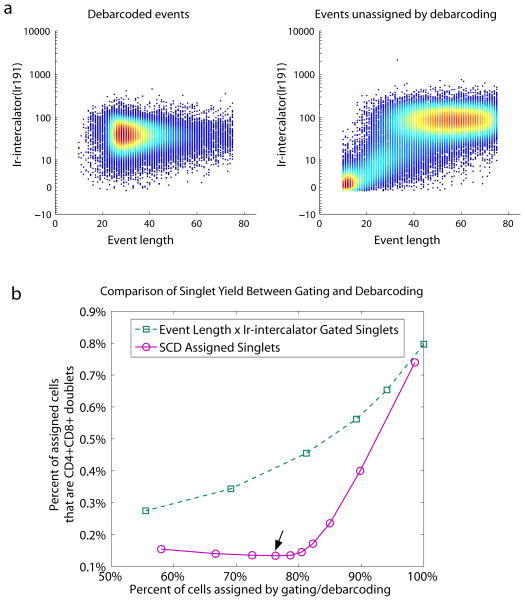
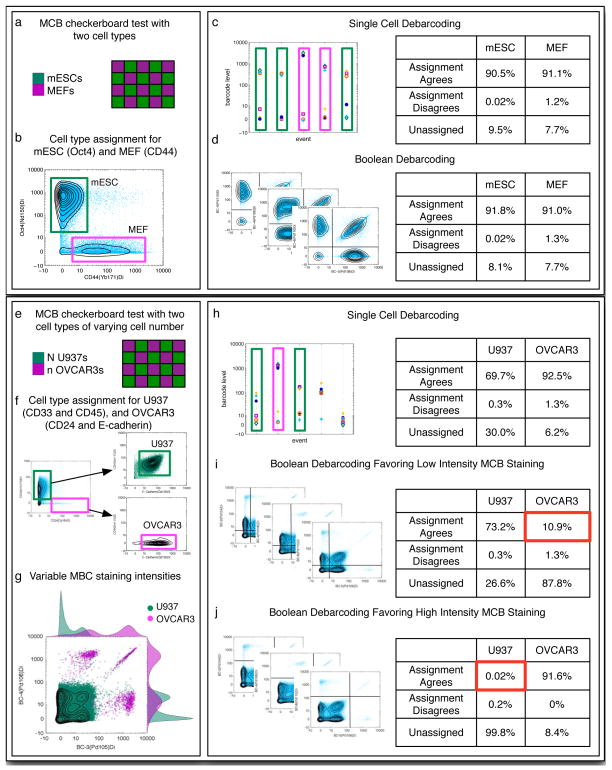
Mass-tag cell barcoding (MCB) labels individual cell samples with unique combinatorial barcodes, after which they are pooled for processing and measurement as a single multiplexed sample. The MCB method eliminates variability between samples in antibody staining and instrument sensitivity, reduces antibody consumption and shortens instrument measurement time. Here we present an optimized MCB protocol. The use of palladium-based labeling reagents expands the number of measurement channels available for mass cytometry and reduces interference with lanthanide-based antibody measurement. An error-detecting combinatorial barcoding scheme allows cell doublets to be identified and removed from the analysis. A debarcoding algorithm that is single cell-based rather than population-based improves the accuracy and efficiency of sample deconvolution. This debarcoding algorithm has been packaged into software that allows rapid and unbiased sample deconvolution. The MCB procedure takes 3-4 h, not including sample acquisition time of ∼1 h per million cells.


Conflict of interest statement

COMPETING FINANCIAL INTERESTS

The authors declare competing financial interests (see the HTML version of this article for details). G.P.N. has personal financial interest in the company Fluidigm, the manufacturer of the mass cytometer used in this manuscript. R.F. has been a paid consultant for the company DVS Sciences, the original manufacturer of the mass cytometer which has since merged with Fluidigm. G.K.B. has been a paid consultant for both DVS Sciences and Fluidigm.

Figures

Figure 1
Figure 1. Isothiocyanobenzyl-EDTA(palladium) MCB cell labeling reagent
(a) Palladium nitrate is converted to palladium chloride after dissolving in 5N Hydrochloric Acid. (b) Palladium chelation by isothiocyanobenzyl-EDTA. (c) Cell labeling by the isothiocyanobenzyl-EDTA(palladium)chelate.
Figure 2
Figure 2. MCB cell labeling by the isothiocyanobenzyl-EDTA(palladium) chelate
(a) Binary MCB labeling of PFA-fixed, methanol-permeabilized cells. (b) One million PFA-fixed, methanol-permeabilized cells were incubated with 100 nM Isothiocyanobenzyl-EDTA(Palladium) at 4 °C for the indicated times. Median intensities are shown as connected blue circles, and are overlaid on individual contour plots for each sample with Ir-intercalator along their hidden x axes. (c) One million PFA-fixed, methanol-permeabilized cells were mixed with the indicated concentrations of BSA before incubation with 300 nM Isothiocyanobenzyl-EDTA(Palladium) at 4 °C for 30 minutes. Median intensities are shown as connected blue circles, and are overlaid on individual contour plots for each sample with Ir-intercalator along their hidden x axes. (d) PFA-fixed, methanol-permeabilized cells were incubated at the indicated cell densities with the indicated Isothiocyanobenzyl-EDTA(Palladium) concentrations at 4 °C for 30 minutes.
Figure 3
Figure 3. Doublet-filtering MCB scheme
(a) The 6-choose-3 doublet-filtering barcode scheme. Each well is positive (gray) and negative (white) for exactly 3 out of the 6 MCB reagents. (b) Examples of a barcode singlet (3 positive barcode channels) and a barcode doublet (>3 positive barcode channels) as seen in the time-of-flight spectra used to visualize cells while acquiring data at the instrument. (c) Maximum number of available barcodes as a function of number of barcode channels for both doublet-filtering n-choose-k schemes and for the non-redundant 2n binary scheme.
Figure 4
Figure 4. Single cell barcode deconvolution
Five events from a 6-choose-3 MCB-multiplexed FCS file are shown in single cell format displayed on a vertical dashed line. Events 1–3 correspond to barcode singlets as indicated by the barcode key, Event 4 is a barcode doublet, and Event 5 is classified as debris. The red line segments indicate ‘barcode separation’ assuming the 6-choose-3 scheme, which is always set as the distance between the 3rd and 4th highest barcode intensities. Without this assumption, the last two events would have larger barcode separations but would still be discarded because their barcodes would not match any in the 20-sample scheme.
Figure 5
Figure 5. Single cell debarcoding software
Mouse splenocytes were harvested from 20 individual mice, and treated with benzonase to minimize cell aggregates. 1.5 × 10⁶ cells from each sample were MCB labeled and then pooled for mass cytometry processing. The pooled sample was blocked with anti-CD16/32, and then stained with an antibody cocktail including anti-CD4 and anti-CD8, followed by mass cytometry measurement. (a) A flowchart of the single-cell debarcoding process. (b) The menu of the single-cell debarcoder. The lower plot portion dynamically changes depending on the plot type selected. (c) The analysis window which is used to guide selection of the barcode separation threshold parameter. The distribution of barcode separations is shown by green bars, and the resulting cell yields for each of the 20 unique populations after debarcoding are displayed as a function of this barcode separation threshold. The dashed line indicates a separation threshold value that best balances barcode assignment stringency and cell yield. (d) The ‘Event’ plot shows all cell events assigned to barcode 100101, with each cell event represented as a vertical line on which the 6 MCB reagent intensities are plotted, as in Figure 4. (e) The ‘All BC Biaxials’ plot type colored by Mahalanobis distance for barcode 100101 with the chosen parameters. All animal studies were performed in accordance with the investigators’ protocols approved by the Stanford University institutional animal care and use committee.
Figure 6
Figure 6. Doublet removal with the 6-choose-3 MCB scheme and single cell de-barcoding
(a) Biaxial plot of event length × Ir-intercalator of events that were assigned a barcode, and of events that were left unassigned. (b) Percent of cells assigned by gating (green squares) or debarcoding (purple circles) versus percent of assigned cells that are CD4+CD8+ doublets. The different yields were acquired by variable event length × Ir-intercalator gates (green squares) or debarcoding threshold stringency (purple circles). The arrow indicates the debarcoding parameters used in Figures 5 and 6a.
Figure 7
Figure 7. Single cell deconvolution vs. Boolean gating for MCB samples with and without large differences in MCB labeling intensity
(a) PFA-fixed, Methanol-permeabilized MEF and mESC cells were aliquoted into a 2 ml 96-well plate in a 20-sample checkerboard pattern at 0.2 × 10⁶ and 0.5 × 10⁶ cells per well, respectively. The cells were incubated with MCB reagents in a 6-choose-3 combinatorial scheme at 300 nM Isothiocyanobenzyl-EDTA(palladium). (b) After MCB labeling and pooling of the checkerboard-arranged samples, the MEF-specific antibody against CD44 and the mESC-specific antibody against Oct4 were used to differentiate between the two cell types. (c) Single-cell debarcoding and (d) boolean gate debarcoding produce similar cell yields and accuracies. (e) PFA-fixed, Methanol-permeabilized U937 and OVCAR-3 cells were aliquoted into a 2 ml 96-well plate in a 20-sample checkerboard pattern at 30,000 and 100,000 cells per well, respectively. A large percentage of the OVCAR-3 cells were lost during the PBS wash steps before MCB labeling, which resulted in unusually high MCB staining intensity for these samples. The cells were incubated with MCB reagents in a 6-choose-3 combinatorial scheme at 30 nM Isothiocya-nobenzyl-EDTA(palladium). (f) After MCB labeling and pooling of the checkerboard-arranged samples, U937-specific antibodies against CD33 and CD45 and OVCAR-3-specific antibodies against CD24 and E-cadherin were used to differentiate between the two cell types. (g) Gating based on CD33, CD45, CD24, and E-Cadherin reveals the difference in MCB-labeling intensity between the U937 and OVCAR-3 cells. (h) Single-cell debarcoding successfully recovers both the U937 and OVCAR-3 populations. (i) Boolean gates bisecting the populations at a low MCB intensity primarily recovers U937 cells. The low percentage of recovered OVCAR-3 cells is highlighted in red. (j) Boolean gates bisecting the populations at a high MCB intensity primarily recovers OVCAR-3 cells. The low percentage of recovered U937 cells is highlighted in red.

References

    1. Fulton RJ, McDade RL, Smith PL, Kienker LJ, Kettman JR. Advanced multiplexed analysis with the FlowMetrixTM system. Clin Chem. 1997;43:1749–1756. - PubMed
    1. Parameswaran P, et al. A pyrosequencing-tailored nucleotide barcode design unveils opportunities for large-scale sample multiplexing. Nucleic Acids Res. 2007;35:e130. - PMC - PubMed
    1. Meyer M, Stenzel U, Myles S, Prüfer K, Hofreiter M. Targeted high-throughput sequencing of tagged nucleic acid samples. Nucleic Acids Res. 2007;35:e97. - PMC - PubMed
    1. Krutzik PO, Nolan GP. Fluorescent cell barcoding in flow cytometry allows high-throughput drug screening and signaling profiling. Nat Methods. 2006;3:361–368. - PubMed
    1. Bandura DR, et al. Mass Cytometry: Technique for Real Time Single Cell Multitarget Immunoassay Based on Inductively Coupled Plasma Time-of-Flight Mass Spectrometry. Anal Chem. 2009;81:6813–6822. - PubMed

Publication types