. 2015 Jun 15;523(9):1419-42.
doi: 10.1002/cne.23746. Epub 2015 Apr 7.

Differential expression of protocadherin-19, protocadherin-17, and cadherin-6 in adult zebrafish brain

Affiliations

Differential expression of protocadherin-19, protocadherin-17, and cadherin-6 in adult zebrafish brain

Qin Liu et al. J Comp Neurol. .

Abstract

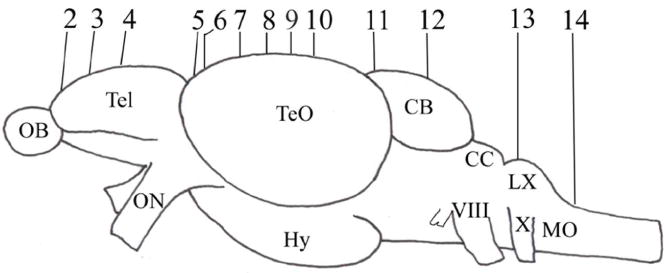
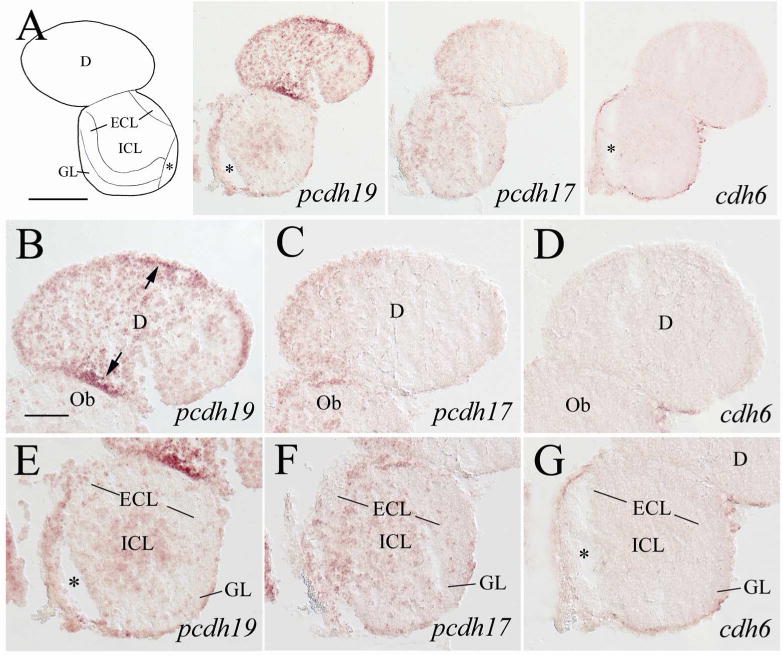
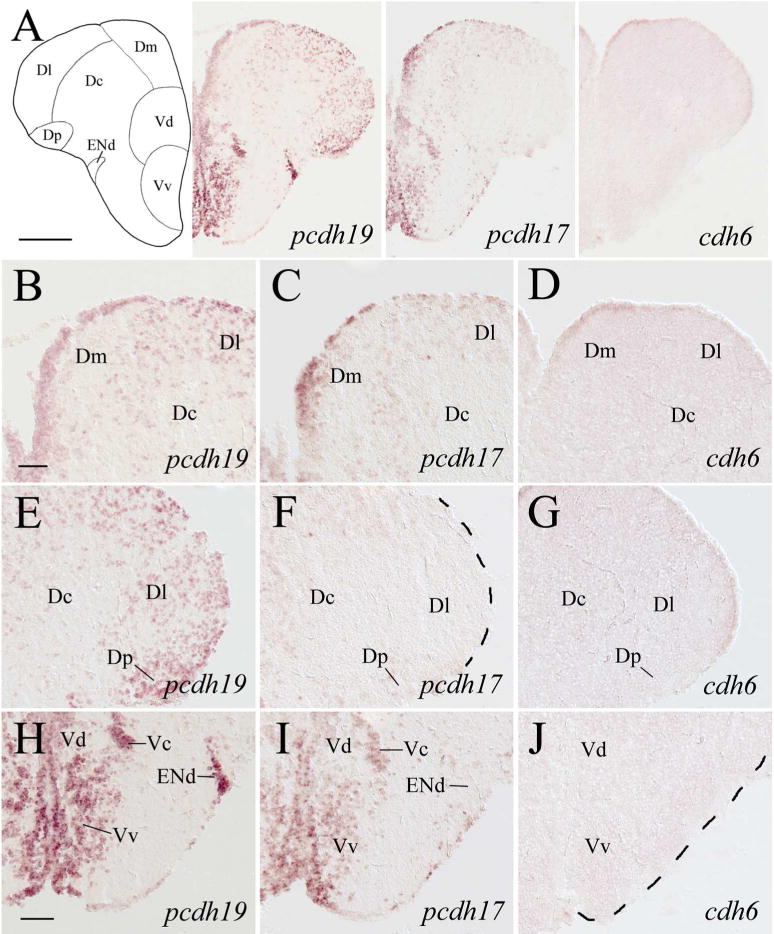
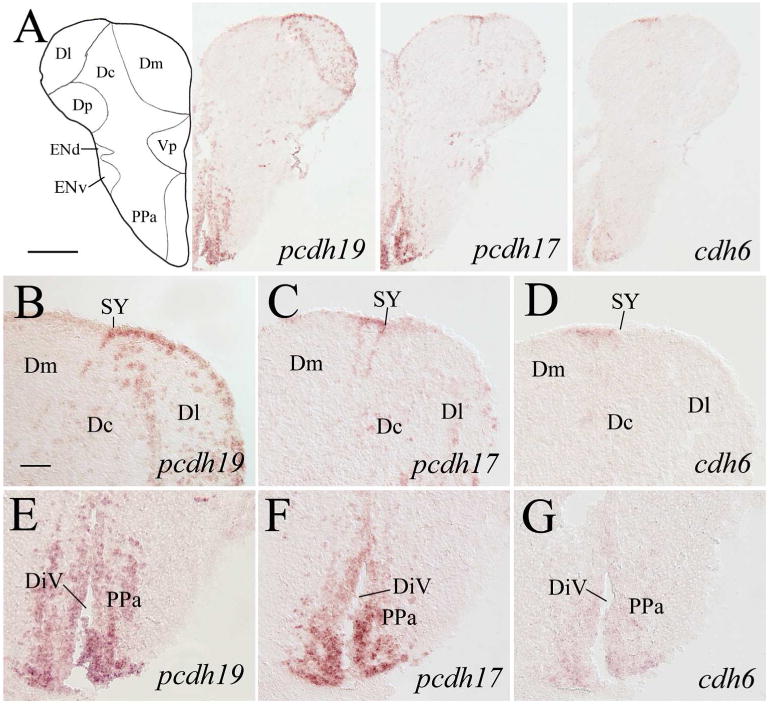
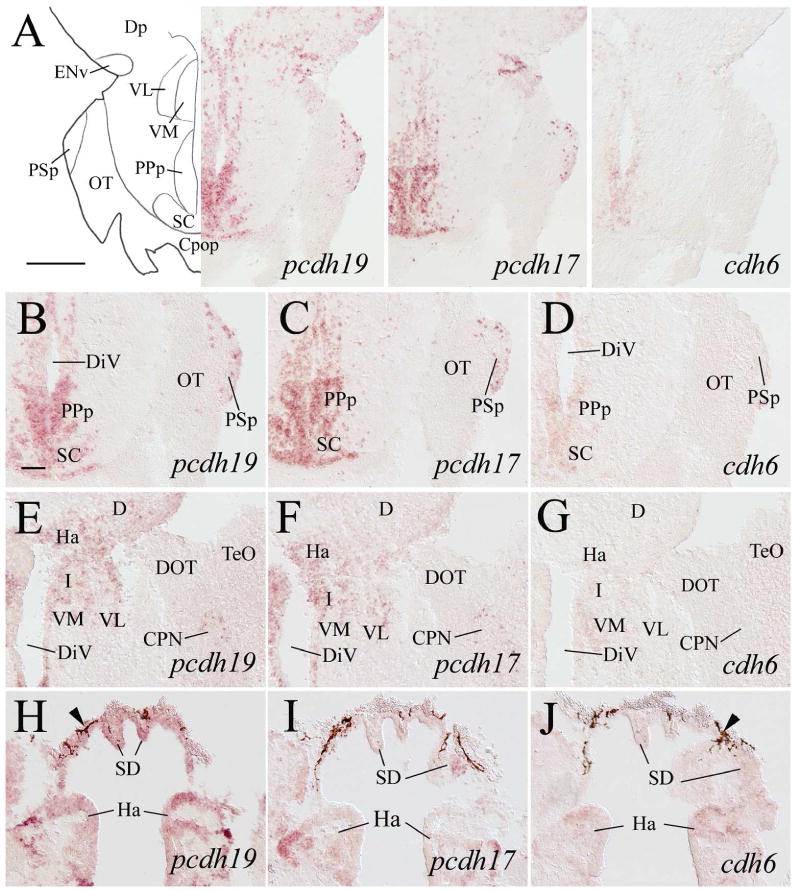
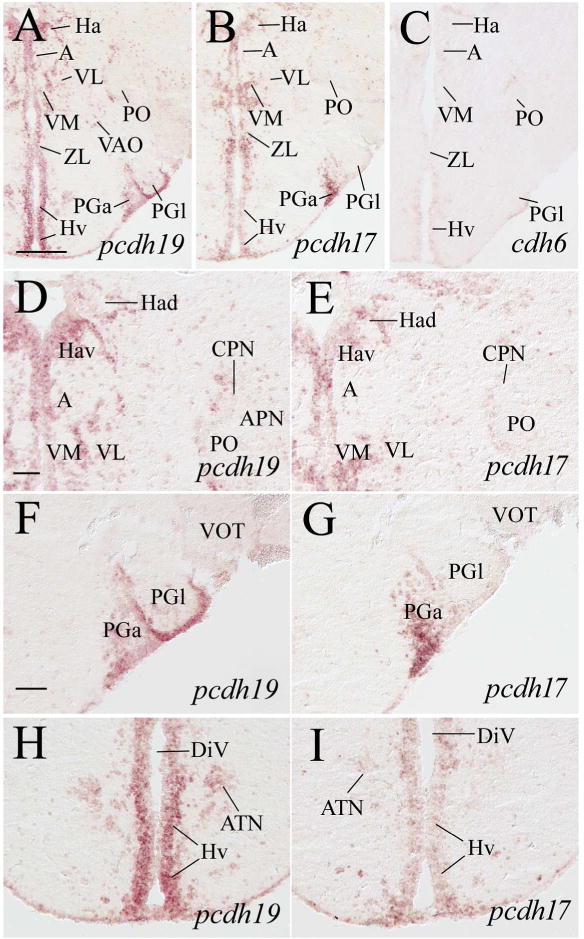
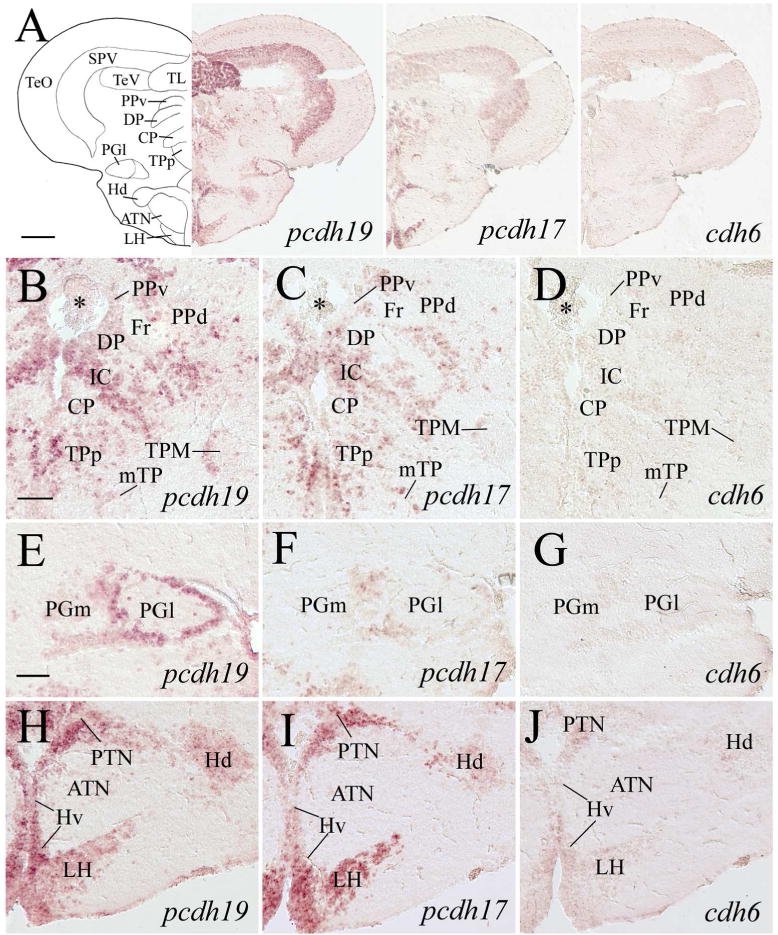
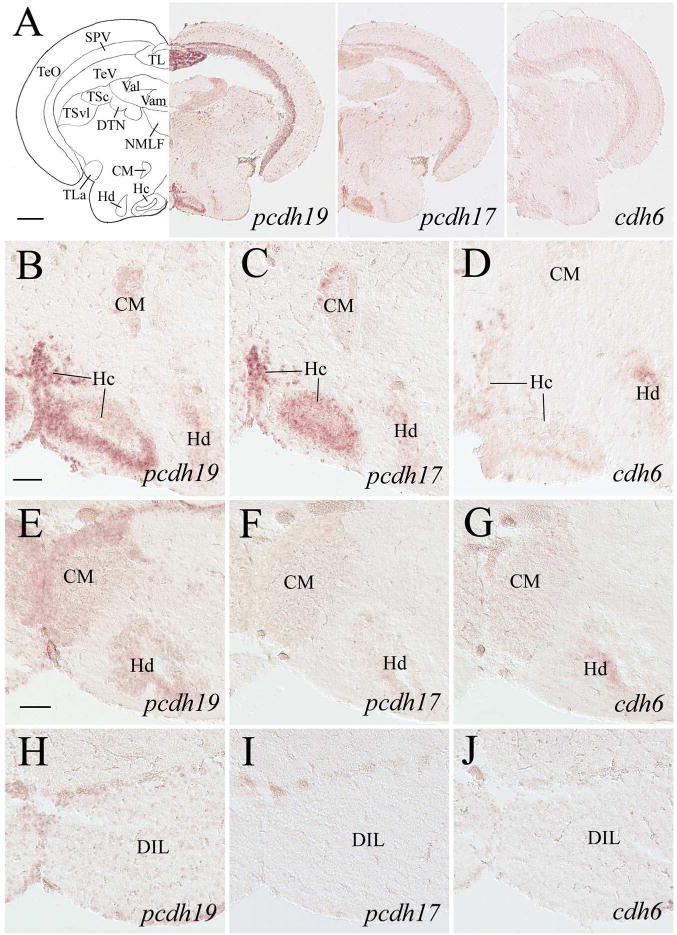
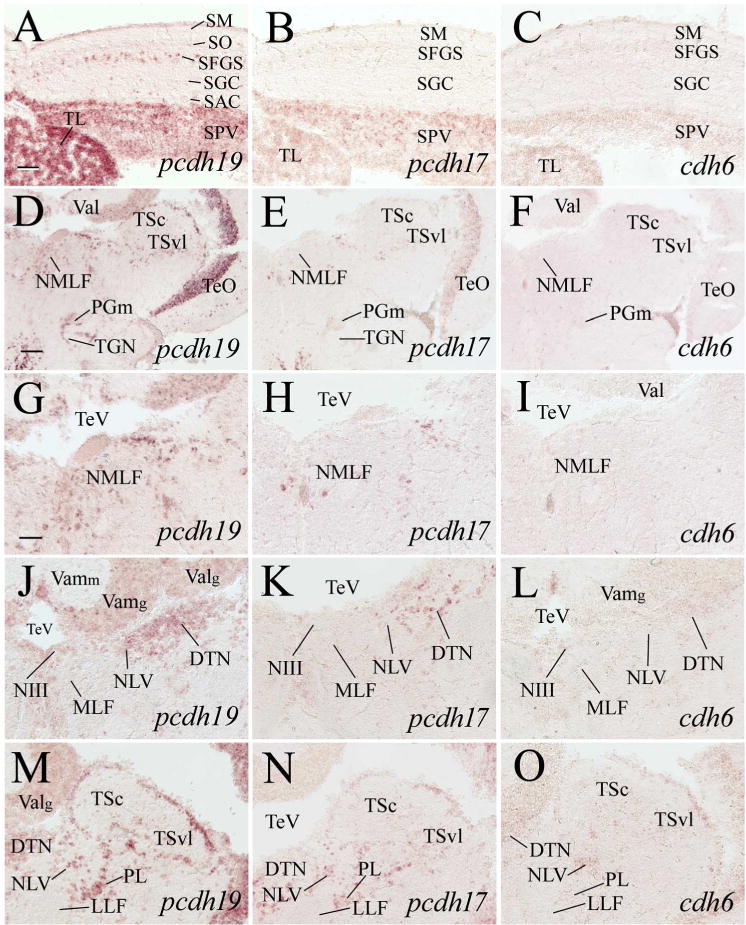
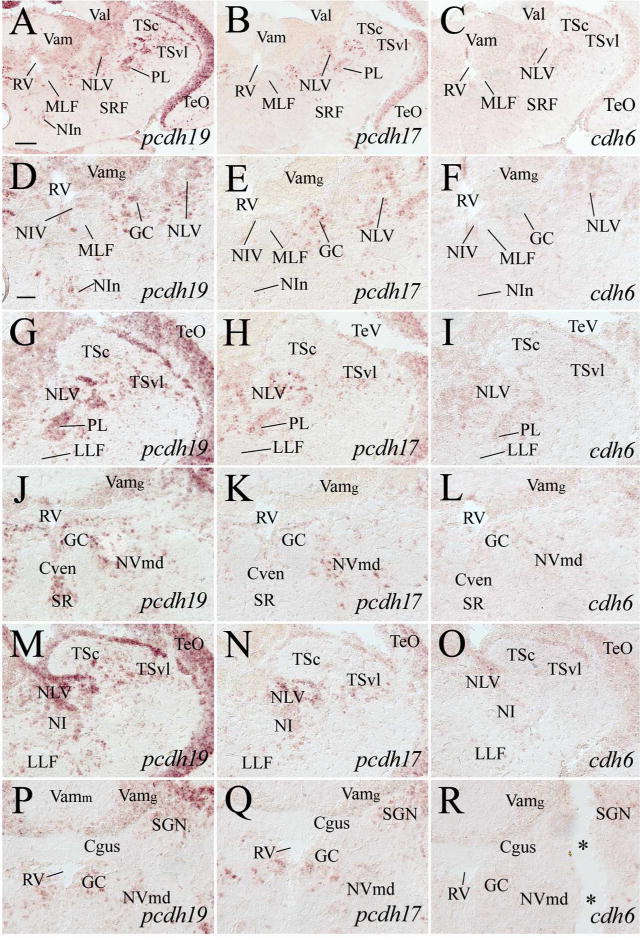
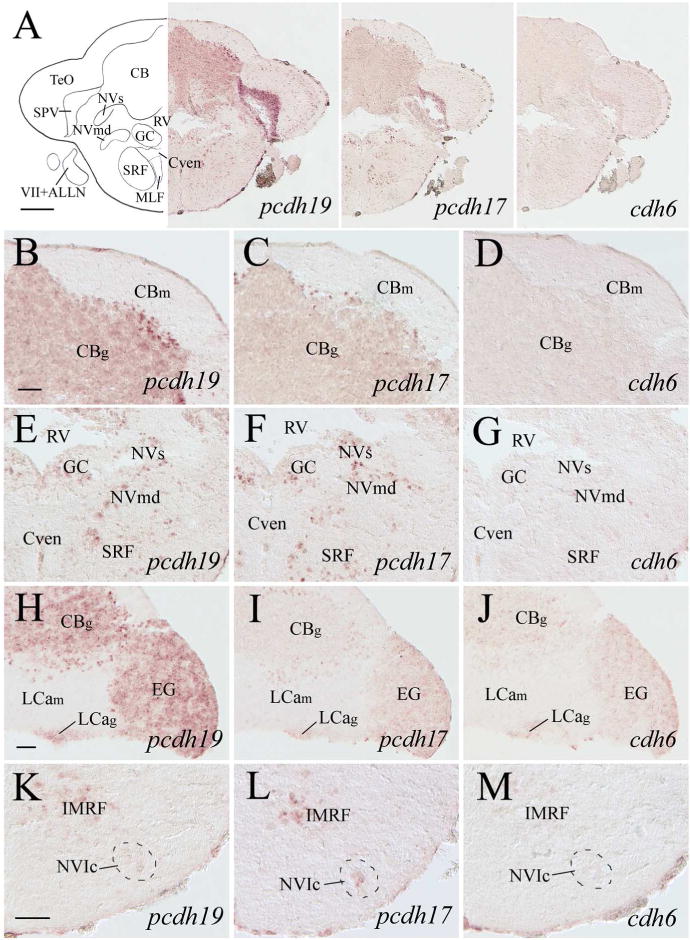
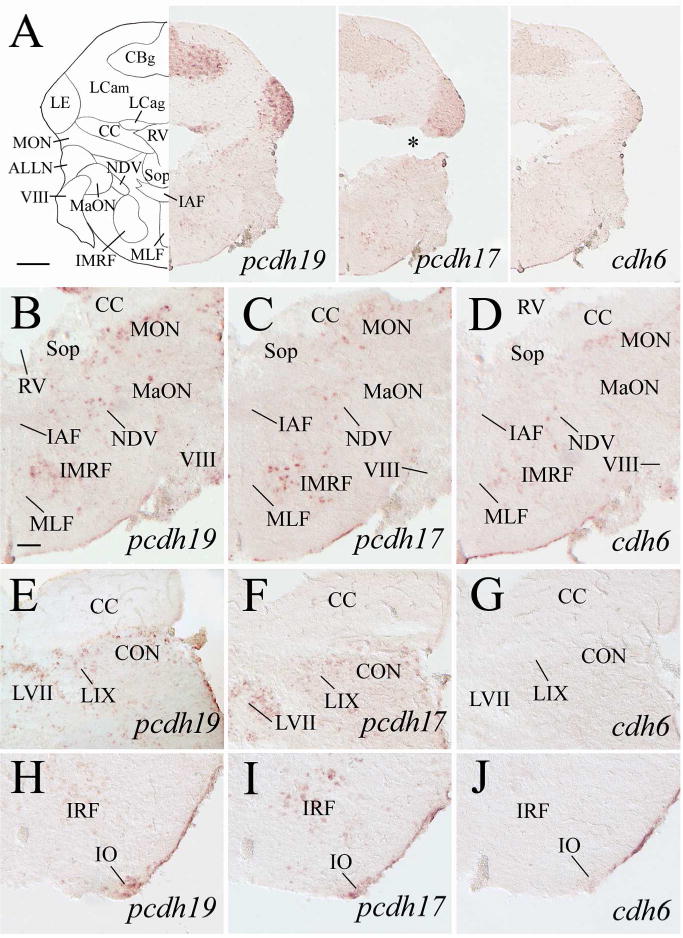
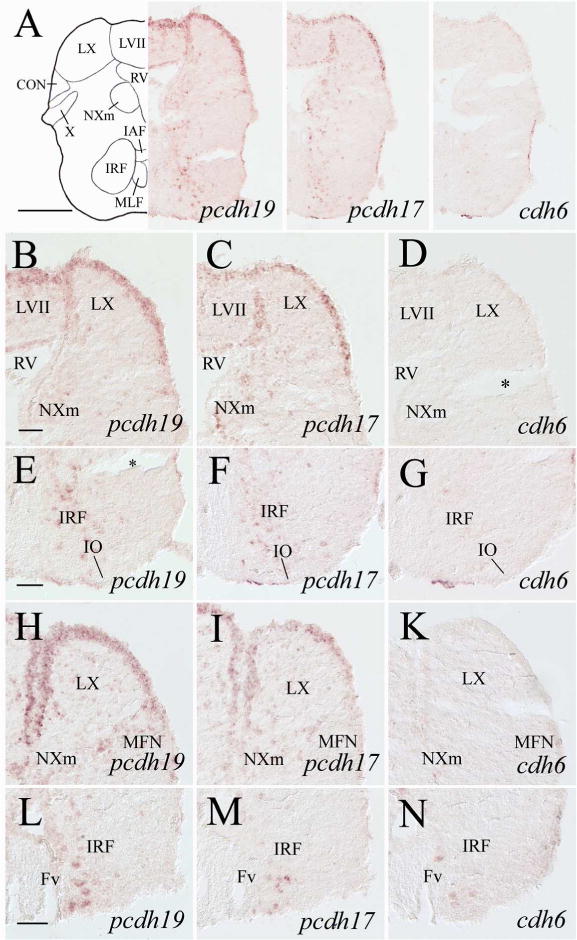
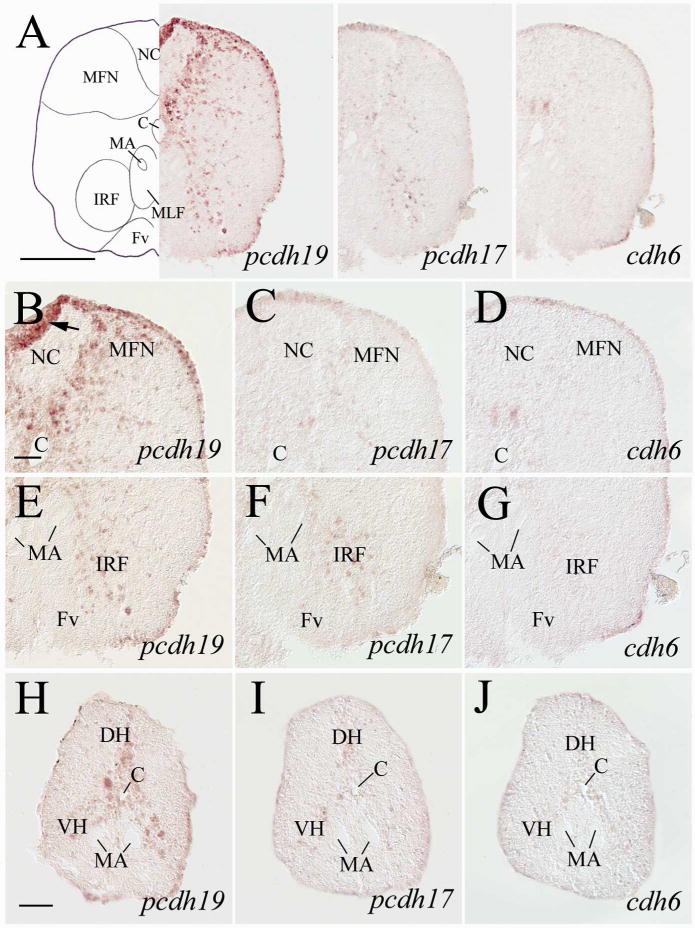
Cell adhesion molecule cadherins play important roles in both development and maintenance of adult structures. Most studies on cadherin expression have been carried out in developing organisms, but information on cadherin distribution in adult vertebrate brains is limited. In this study we used in situ hybridization to examine mRNA expression of three cadherins, protocadherin-19, protocadherin-17, and cadherin-6 in adult zebrafish brain. Each cadherin exhibits a distinct expression pattern in the fish brain, with protocadherin-19 and protocadherin-17 showing much wider and stronger expression than that of cadherin-6. Both protocadherin-19 and protocadherin-17-expressing cells occur throughout the brain, with strong expression in the ventromedial telencephalon, periventricular regions of the thalamus and anterior hypothalamus, stratum periventriculare of the optic tectum, dorsal tegmental nucleus, granular regions of the cerebellar body and valvula, and superficial layers of the facial and vagal lobes. Numerous sensory structures (e.g., auditory, gustatory, lateral line, olfactory, and visual nuclei) and motor nuclei (e.g., oculomotor, trochlear, trigeminal motor, abducens, and vagal motor nuclei) contain protocadherin-19 and/or protocadherin-17-expressing cell. Expression of these two protocadherins is similar in the ventromedial telencephalon, thalamus, hypothalamus, facial, and vagal lobes, but substantially different in the dorsolateral telencephalon, intermediate layers of the optic tectum, and cerebellar valvula. In contrast to the two protocadherins, cadherin-6 expression is much weaker and limited in the adult fish brain.

Keywords: RRID: 2DB-GENO-030619-2; RRID: AB_193290; RRID: AB_514497, Roche Cat. no. 11093274910; RRID: BC_129243; RRID: XM_684743; cell adhesion molecules; cerebellum; motor nuclei; sensory systems.


Conflict of interest statement

Conflict of interest statement

There is no known conflict of interest to declare from all the authors.

Figures

Figure 1
Figure 1
Schematic drawing of an adult zebrafish brain (lateral view) showing levels of cross sections. Numbers represent respective figure numbers. See list for abbreviations.
Figure 2
Figure 2
Expression of pcdh19, pcdh17 and cdh6 in the telencephalon (anterior region) and olfactory bulb. In the top panels, a schematic drawing of half of the brain section (left or right side) processed for pcdh19 staining is used to indicate major brain structures at this level, which is accompanied by low magnifications of half of the brain sections (left or right side, from adjacent areas). The anterior-posterior level of the brain region is shown in Figure 1. The top panels of most of the subsequent figures with low magnified views of brain sections are similarly arranged. B–D are higher magnifications of their respective dorsal telencephalon in the upper panels, while panels E–G are higher magnified views of the olfactory bulb in the upper panels. The arrows in panel B indicate cells with stronger staining. Asterisks indicate artificial cracks in the tissue sections. See list for abbreviations. Scale bar = 200 μm for the top panels, 50 μm for the lower panels (B–G have the same magnification).
Figure 3
Figure 3
Expression of pcdh19, pcdh17 and cdh6 in the precommissural telencephalon. Images in the top panels show low magnified views of adjacent brain regions at a level shown in Figure 1. B–D show higher magnifications of the dorsomedial regions of the dorsal telencephalon, while E–G show higher magnified views of the dorsolateral regions of the dorsal telencephalon shown in the top respective panels. H–J are higher magnifications of the ventral regions of the telencephalon shown in the top panels. See the list for abbreviations. Scale bar = 200 μm for the top panels, 50 μm for the lower panels (B–G have the same magnification).
Figure 4
Figure 4
pcdh19, pcdh17 and cdh6 expression in the postcommissural telencephalon and anterior preoptic areas. Images in the top panels are low magnified views of adjacent brain sections from a level shown in Figure 1. B–D are higher magnifications of the dorsal telencephalon region adjacent to the sulcus ypsiloniformis (SY) shown in their respective top panels. E–G show magnified views of the ventral regions (part of the preoptic area) of their respective brain sections in the top panels. For other abbreviations, see the list. Scale bar = 200 μm for the top panels, 50 μm for the lower panels.
Figure 5
Figure 5
Expression of pcdh19, pcdh17 and cdh6 in the posterior preoptic areas, epithalamus, ventral thalamus, and pretectum. Top panel images show low magnifications of the brain from adjacent sections at a level indicated in Figure 1. B–D are higher magnifications of the posterior preoptic areas and the suprachiasmatic nucleus (SC) shown in the top pannels. The remaining panels are from sections 100–150 μm posterior to those shown in B–D, showing epithalamus and ventral thalamus. Arrowheads in H–J indicate pigmented epithelium. For other abbreviations, see the list. Scale bar = 200 μm for the top panels, 50 μm for the lower panels (B–J have the same magnification).
Figure 6
Figure 6
Expression of pcdh19, pcdh17 and cdh6 in habenular, pretectal, dorsal thalamic, ventral thalamic, anterior thalamic and preglomerular nuclei. Images in top panels show low magnifications of adjacent brain sections from a level shown in Figure 1. D and E are higher magnifications of the habenular, ventral thalamic and pretectal regions of their respective images in the top panels. F and G are higher magnifications of the preglomerular nuclei, while H and I are magnified views of the anterior hypothalamus shown in the top panels. See the list for abbreviations. Scale bar = 200 μm for the top panels, 50 μm for the lower panels (F–I have the same magnification).
Figure 7
Figure 7
Expression of pcdh19, pcdh17 and cdh6 in the dorsal thalamus, pretectum, preglomerular nuclei, posterior tuberculum, hypothalamus and optic tectum. Images in the top panels show low magnifications of adjacent sections from a level shown in Figure 1. B–D are magnified views of the dorsal thalamus and periventricular pretectum from their respective images in the top panels. E–G show higher magnifications of the lateral preglomerular (PGl) and medial preglomerular (PGm) nuclei, while H–J are magnified views of the medial hypothalamus and posterior tuberculum shown in their respective top panels. Asterisks in B–D indicate clusters of cells in the diencephalic ventricle. For other abbreviations, see the list. Scale bar = 200 μm for the top panels, 50 μm for the lower panels (E–J have the same magnification).
Figure 8
Figure 8
pcdh19, pcdh17 and cdh6 expression in the optic tectum, posterior tuberculum and hypothalamus. Top panels show low magnifications of sections from a level indicated in Figure 1. The section processed for cdh6 in situ hybridization was from a different fish showing similar hypothalamic areas. B–D show higher magnifications of the ventral posterior tuberculum and medial hypothalamus from their respective images in the top panels. E–J are higher magnifications of similar regions from sections posterior to those shown in the top panels: E–G are 100–150 μm posterior to B–D, while H–J are 100–150 μm posterior to E–G. See the list for abbreviations. Scale bar = 200 μm for the top panels, 50 μm for the remaining panels (B–J have the same magnification).
Figure 9
Figure 9
Expression of pcdh19, pcdh17 and cdh6 in the optic tectum, dorsal tegmentum, isthmus and cerebellar valvula. A–C are higher magnifications of adjacent sections of the medial optic tectum from images shown in the top panels in Figure 7. D–F are low magnified views of dorsal tegmenal region of adjacent sections at a level shown in Figure 1. G–I are higher magnifications of the nucleus of medial longitudinal fascicle (NMLF) of their respective images in D–F. J–O are magnified views of the dorsal tegmentum and isthmus from sections posterior (120–150 μm) to D–F, with J–L showing the medial region, while M–O showing the lateral region. See the list for abbreviations. Scale bar = 100 μm for D–F, 50 μm for the remaining panels (G–O have the same magnification).
Figure 10
Figure 10
Expression of pcdh19, pcdh17 and cdh6 in the tegmentum, isthmus cerebellar valvula and anterior medulla. A–C are from adjacent sections from a level indicated by Figure 1. D–F are magnified views of the centromedial region, while G–I are higher magnifications of the dorsolateral region of their respective images in the top panels. J–L and M–O show similar respective regions from sections posterior (120–160 μm) to those shown in D–I. P–R are higher magnifications of similar areas shown in J–L, but from sections 30–50 μm posterior to J–L. The two asterisks in R indicate a large artificial crack in the tissue. See the list for abbreviations. Scale bar = 100 μm for A–C, 50 μm for the remaining panels (D–R have the same magnification).
Figure 11
Figure 11
pcdh19, pcdh17 and cdh6 expression in the cerebellum and anterior medulla oblongata. Images at the top panels show low magnified views of cerebellar body (CB) and anterior medulla of adjacent sections from a level shown in Figure 1. B–D are higher magnifications of the dorsal half of the CB, while E–G are higher magnified views of the dorsomedial medulla of their respective images shown in the top panels. H–J show higher magnifications of the cerebellum from adjacent sections located 120–170 μm posterior to A–G. K–M are higher magnifications of the ventral medulla of adjacent sections from the same level as H–J. For other abbreviations, see the list. Scale bar = 200 μm for the top panels, and 50 μm for the remaining panels (B–G have the same magnification).
Figure 12
Figure 12
Expression of pcdh19, pcdh17 and cdh6 in the cerebellum and medulla oblongata. Top panels show lower magnifications of adjacent sections from a level shown in Figure 1. B–D are higher magnified views of ventral halves of their respective images in the top panels. E–J are from sections 200–250 μm posterior to A. E–G show magnified views of cerebellar crest (CC) and dorsal medulla, while H–J are magnified views of the ventral medulla. The asterisk in A (middle panel) indicates an artificial crack in the tissue section. For other abbreviations, see the list. Scale bar = 200 μm for the top panels, and 50 μm for the remaining panels (B–J have the same magnification).
Figure 13
Figure 13
pcdh19, pcdh17 and cdh6 expression in the medulla oblongata. Top panels show low magnifications of adjacent sections from a level shown in Figure 1. B–D are higher magnified views of the dorsal halves, while E–G are ventral portions of their respective images in the top panels. H–N are from sections 200–250 μm posterior to A, with H–K showing magnified views of the dorsal medulla, while L–N showing the ventral medulla. Asterisks in D and E indicate artificial cracks in the sections. See the list for abbreviations. Scale bar = 200 μm for the top panels, 50 μm for the remaining panels (E–K have the same magnification).
Figure 14
Figure 14
Expression of pcdh19, pcdh17 and cdh6 in the posterior medulla and anterior spinal cord. Top panels show lower magnifications of adjacent sections from a level shown in Figure 1. B–D are higher magnifications of the dorsal regions, while E–G are higher magnifications of the ventral regions of their respective images in the top panels. H–J are adjacent sections from the spinal cord at the cervical level. The arrow in B indicates a fold in the tissue. See the list for abbreviations. Scale bar = 200 μm for the top panels, 50 μm for the remaining panels.

Similar articles

Cited by

References

    1. Acampora D, Gulisano M, Broccoli V, Simeone A. Otx genes in brain morphogenesis. Prog Neurobiol. 2001;64:69–95. - PubMed
    1. Akins MR, Benson DL, Greer CA. Cadherin expression in the developing mouse olfactory system. J Comp Neurol. 2007;501:483–497. - PubMed
    1. Barthel LK, Raymond PA. Subcellular localization of alpha tubulin an opsin mRNA in the goldfish retina using digoxigenin-labeled cRNA probes detected by alkaline phosphatase and HRP histochemistry. J Neurosci Methods. 1990;48:145–152. - PubMed
    1. Becker T, Redies C. Internal structure of the nucleus rotundus revealed by mapping cadherin expression in the embryonic chicken visual system. J Comp Neurol. 2003;467:536–548. - PubMed
    1. Bishop KM, Goudreau G, O’Leary DD. Regulation of area identity in the mammalian neocortex by Emx2 and Pax6. Science. 2000;288:344–349. - PubMed

Publication types