. 2015 Jan 23:6:6026.
doi: 10.1038/ncomms7026.

A number-form area in the blind

Affiliations

A number-form area in the blind

Sami Abboud et al. Nat Commun. .

Abstract

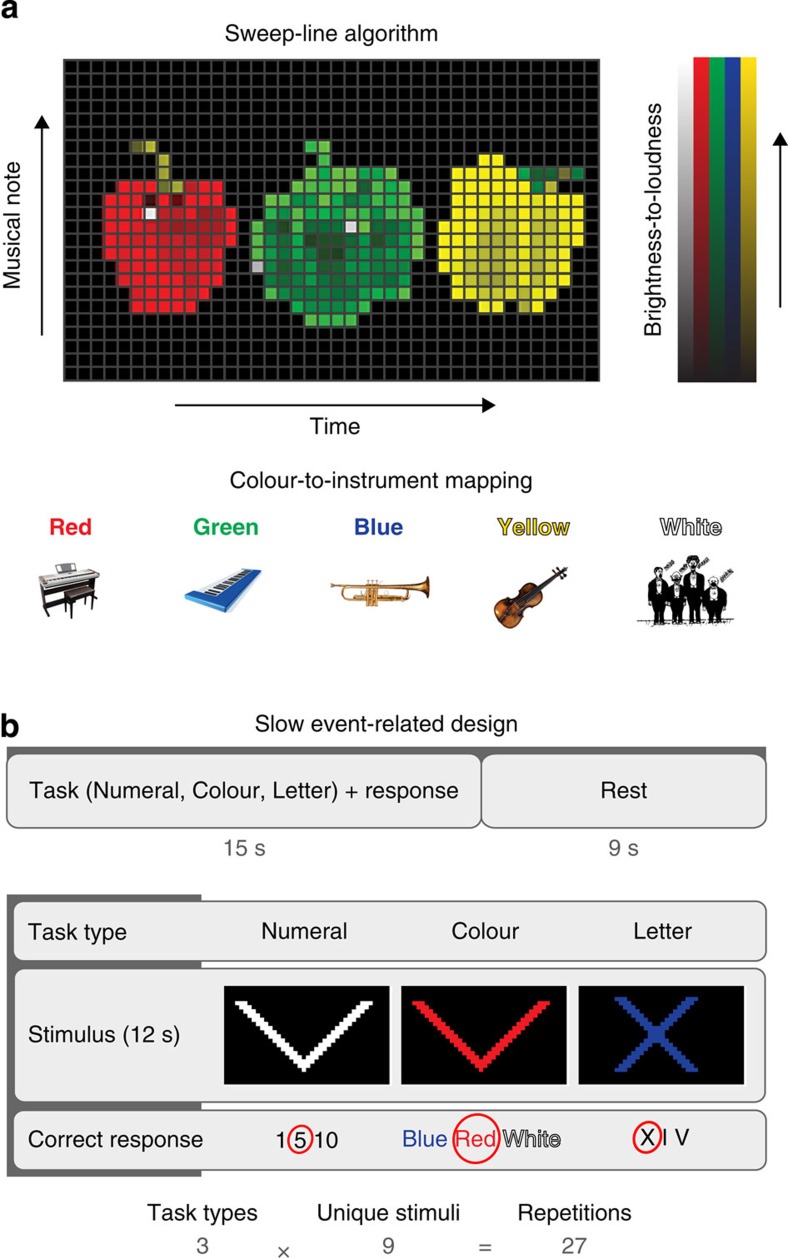
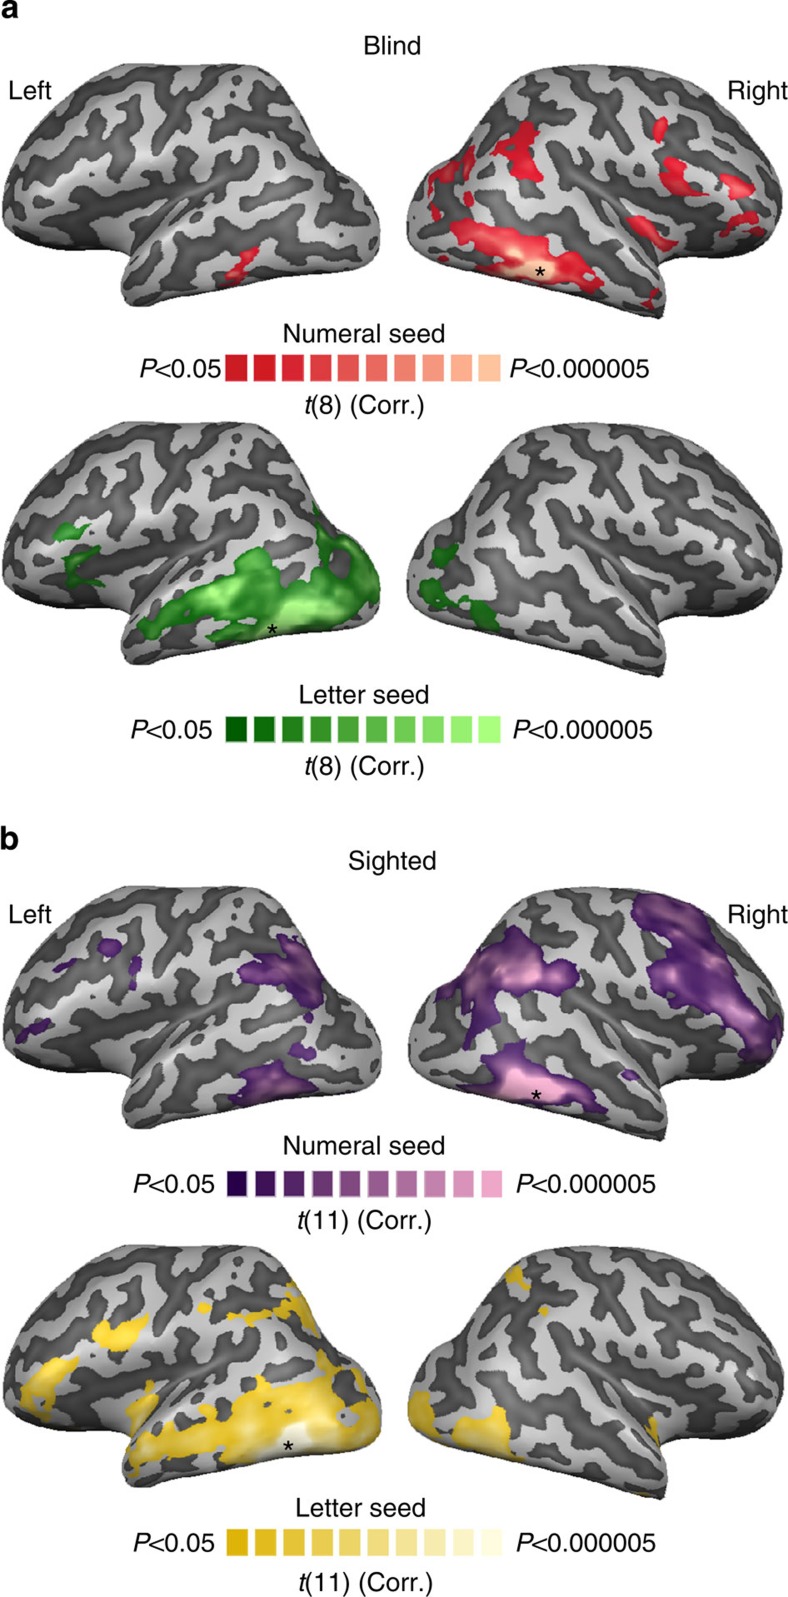
Distinct preference for visual number symbols was recently discovered in the human right inferior temporal gyrus (rITG). It remains unclear how this preference emerges, what is the contribution of shape biases to its formation and whether visual processing underlies it. Here we use congenital blindness as a model for brain development without visual experience. During fMRI, we present blind subjects with shapes encoded using a novel visual-to-music sensory-substitution device (The EyeMusic). Greater activation is observed in the rITG when subjects process symbols as numbers compared with control tasks on the same symbols. Using resting-state fMRI in the blind and sighted, we further show that the areas with preference for numerals and letters exhibit distinct patterns of functional connectivity with quantity and language-processing areas, respectively. Our findings suggest that specificity in the ventral 'visual' stream can emerge independently of sensory modality and visual experience, under the influence of distinct connectivity patterns.


Figures

Figure 1
Figure 1. Methods.
(a) The EyeMusic visual-to-music sensory substitution—Sweep-line algorithm: an input image is first resized to 40 × 24 pixels and then colour is clustered to the nearest of the colours listed below. Afterwards, the 24 rows are mapped on musical notes of corresponding instruments, which are played sequentially column-after-column. Pixel brightness is mapped to sound loudness, as demonstrated by the bars on the right side. In the middle, a sample image of three peppers resized and colour-clustered. Colour-to-instrument mapping: each of the colours is mapped to a musical instrument. Blue is mapped to brass instruments (Tuba, Trombone and Trumpet), yellow to string instruments (Cello and Violin), red to ‘Rapman’s Reed’, green to ‘Reggae Organ’, white to choir (Bass, Tenor, Alto and Soprano) and Black is mapped to Silence. (b) Experimental design—top: the slow event-related fMRI experiment design that consists of 27 trials of stimulation, response and rest periods. Bottom: task types, sample stimuli and the correct answer for each case according to the task type and stimulus. Identical stimuli were used in all tasks.
Figure 2
Figure 2. Preferential activation for the Numeral task in the blind.
The result of the random-effects group analysis (corrected for multiple comparisons) in a group of blind subjects (n=9) for the Numeral task versus the Colour and Letter tasks contrast. The auditory stimuli I, V and X were encoded by the EyeMusic SDD and were identical in all the three tasks. Sagittal (x=53), coronal (y=−44) and transverse (z=−12) slices are shown, in addition to an inflated brain view of the lateral side of the right hemisphere. A single significant area with preferential activation for number symbols was found in the rITG (peak coordinates x=53, y=−44, z=−12; Table 1; Supplementary Table 3). The white cross indicates the location of the peak of the activated found in ref. .
Figure 3
Figure 3. Functional connectivity results.
The result of the random-effects group analysis (corrected for multiple comparisons) of functional connectivity to the seeds defined by (1) the peak of the area active for the Numeral task, denoted as the Numeral seed and (2) the peak of the area active for the Letter task, denoted as the Letter seed. A lateral view of an inflated brain overlaid with the connectivity maps and an asterisk marking the relevant seed. (a) Blind group (n=9)—functional connectivity map from the Numeral seed is shown in red, and from the Letter seed in green. (b) Sighted group (n=12)—functional connectivity map from the Numeral seed is shown in purple, and from the Letter seed in yellow. Both groups show a co-activation of the Numeral seed with areas involved in quantity-processing and the Letter seed with areas involved in language-processing.

References

    1. Cohen L. et al.. The visual word form area: spatial and temporal characterization of an initial stage of reading in normal subjects and posterior split-brain patients. Brain 123, 291–307 (2000). - PubMed
    1. Downing P. E., Jiang Y., Shuman M. & Kanwisher N. A cortical area selective for visual processing of the human body. Science 293, 2470–2473 (2001). - PubMed
    1. Haxby J. V. et al.. Distributed and overlapping representations of faces and objects in ventral temporal cortex. Science 293, 2425–2430 (2001). - PubMed
    1. Hasson U., Harel M., Levy I. & Malach R. Large-scale mirror-symmetry organization of human occipito-temporal object areas. Neuron 37, 1027–1041 (2003). - PubMed
    1. Kanwisher N., McDermott J. & Chun M. M. The fusiform face area: a module in human extrastriate cortex specialized for face perception. J. Neurosci. 17, 4302–4311 (1997). - PMC - PubMed

Publication types

LinkOut - more resources