

A pharmacokinetic comparison of anrukinzumab, an anti- IL-13 monoclonal antibody, among healthy volunteers, asthma and ulcerative colitis patients
- PMID: 25614144
- PMCID: PMC4500329
- DOI: 10.1111/bcp.12589
A pharmacokinetic comparison of anrukinzumab, an anti- IL-13 monoclonal antibody, among healthy volunteers, asthma and ulcerative colitis patients
Abstract
Aims: Anrukinzumab is an anti-IL13 monoclonal antibody. The goals of this study are to characterize the pharmacokinetics of anrukinzumab in healthy volunteers and different disease states and to identify covariates.
Methods: A population pharmacokinetic (PK) model was developed in NONMEM, using data from five clinical studies including healthy volunteers, asthma and ulcerative colitis (UC) patients. Different dosing regimens including different routes of administration were also included in the data.
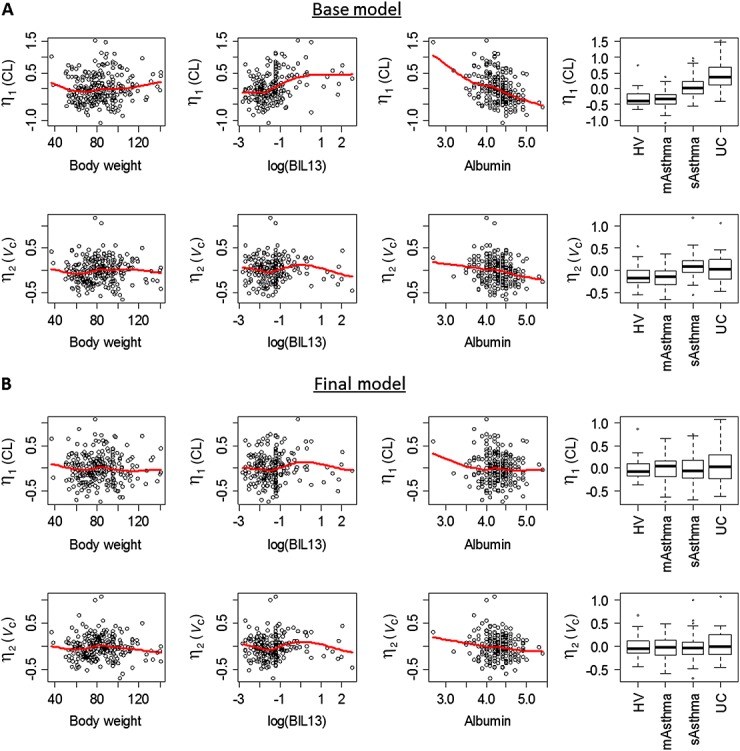
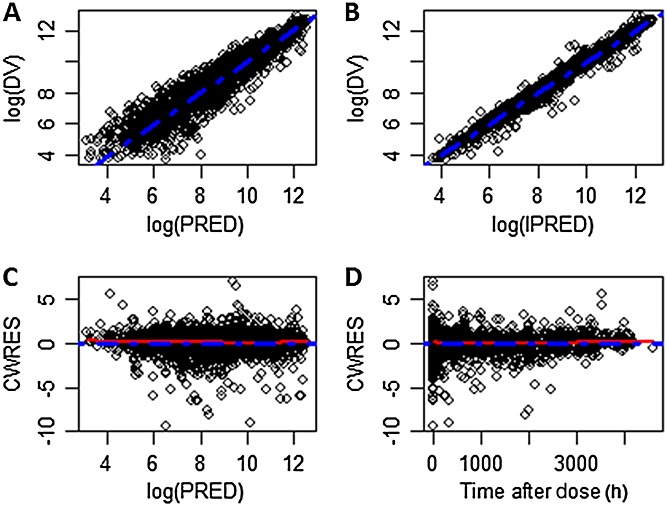
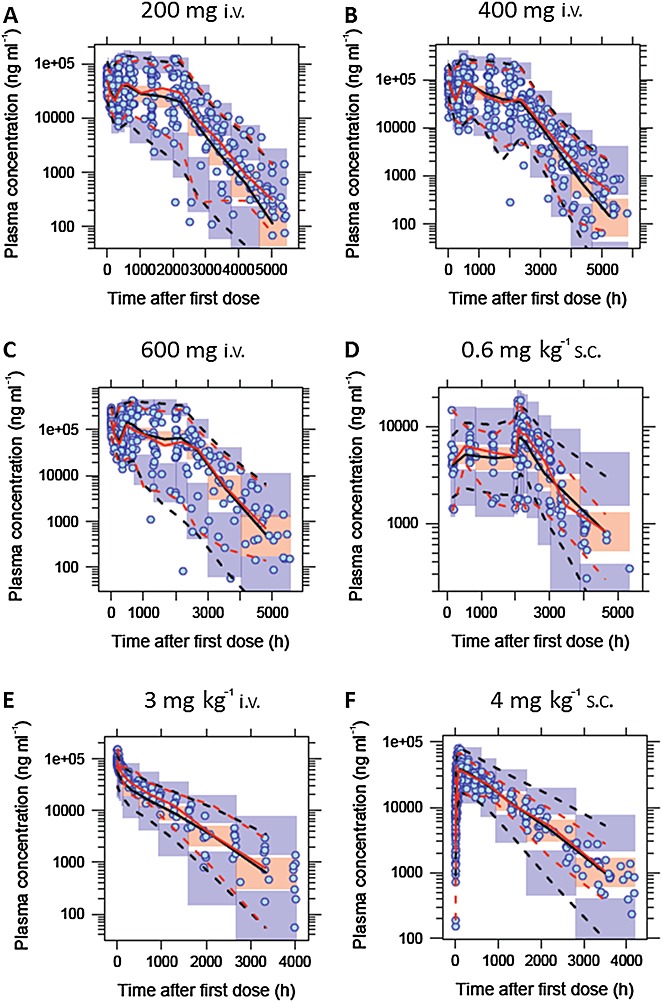
Results: The PK of anrukinzumab were described by a two compartment model with first order absorption and elimination. The population estimates (relative standard error) of the volumes of distribution in the central (Vc ) and peripheral (Vp ) compartments were 3.8 (4.6%) and 2.2 l (8.7%), respectively. In non-UC patients, the population estimate of the systemic clearance (CL) and inter-compartmental CL was 0.00732 l h(-1) (4.9%) and 0.0224 l h(-1) (15.4%). For subcutaneous administration, the absorption rate constant was 0.012 h(-1) (6.6%) and bioavailability was nearly 100% in healthy and mild to moderate asthma patients. Both V and CL increased with body weight. CL (but not V) decreased with increasing baseline albumin concentrations. UC patients had an increased CL of 72.3% (10.5%), after correction for differences in body weight and albumin. Moderate to severe asthma patients had decreased bioavailability compared with other populations.
Conclusions: Anrukinzumab's PK behave like a typical antibody. UC patients were identified to have a faster CL of anrukinzumab than healthy volunteers and asthma patients. This finding suggests a higher dose level may be required for this population.
Keywords: IL13; IMA-638; NONMEM; anrukinzumab; asthma; healthy volunteers; monoclonal antibody; pharmacokinetics; population PK; ulcerative colitis.
© 2015 The British Pharmacological Society.
Figures
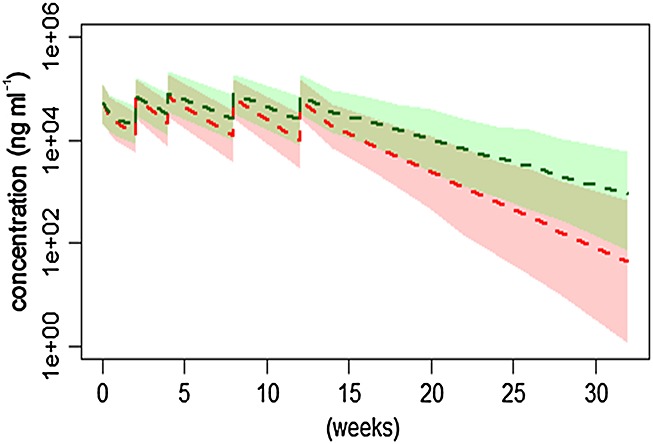
 ,UC;
,UC;  ,non-UC
References
-
- Wynn TA. IL-13 effector functions. Annu Rev Immunol. 2003;21:425–56. - PubMed
-
- Neurath MF, Finotto S, Glimcher LH. The role of Th1/Th2 polarization in mucosal immunity. Nat Med. 2002;8:567–73. - PubMed
-
- Kasaian MT, Miller DK. IL-13 as a therapeutic target for respiratory disease. Biochem Pharmacol. 2008;76:147–55. - PubMed
-
- McMahan ZH. Wigley FM. Vol. 23. Expert Opin Investig Drugs: Novel investigational agents for the treatment of scleroderma; 2014. pp. 183–98. - PubMed
Publication types
MeSH terms
Substances
LinkOut - more resources
Full Text Sources
Other Literature Sources
Medical
