. 2015 Jun 1;402(1):127-41.
doi: 10.1016/j.ydbio.2015.01.008. Epub 2015 Jan 19.

microRNAs regulate β-catenin of the Wnt signaling pathway in early sea urchin development

Affiliations

microRNAs regulate β-catenin of the Wnt signaling pathway in early sea urchin development

Nadezda Stepicheva et al. Dev Biol. .

Abstract

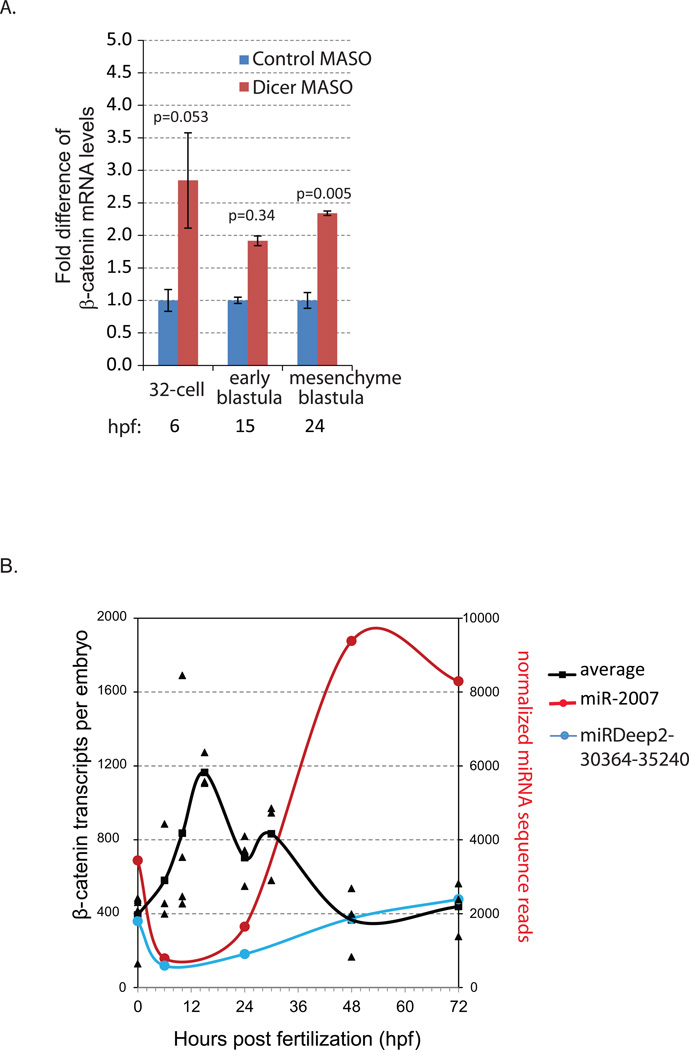
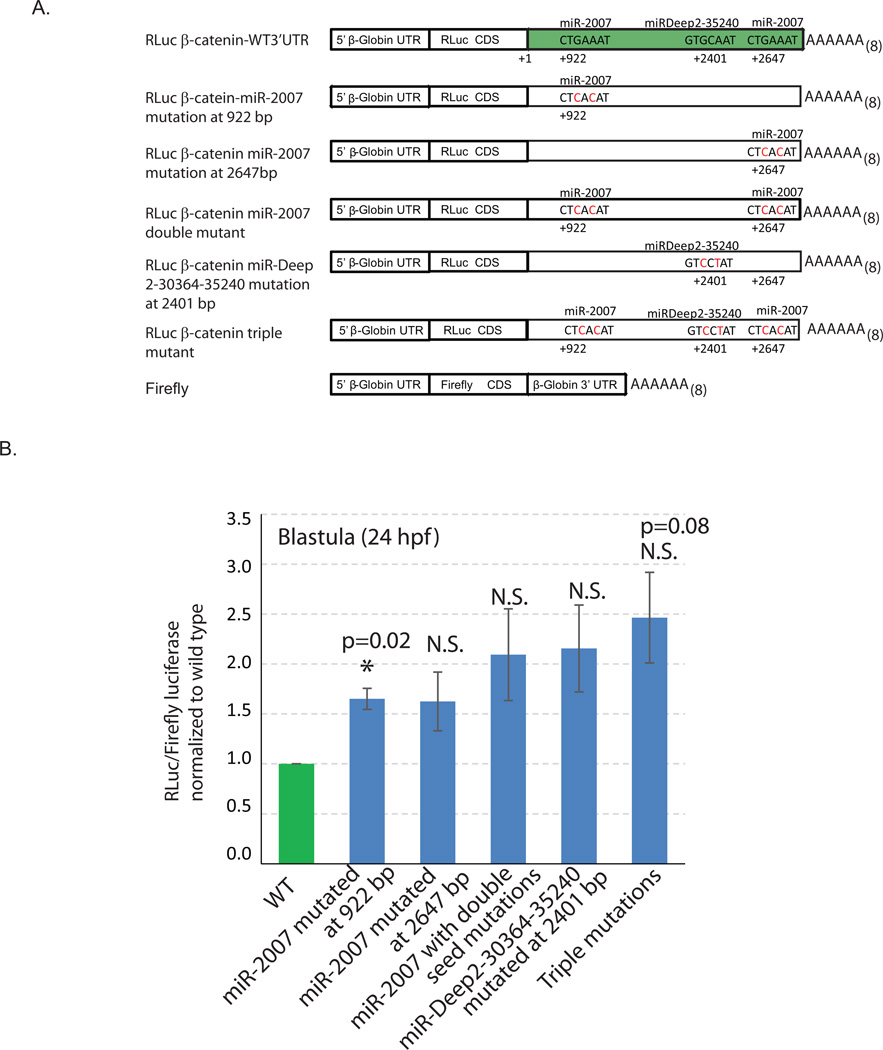
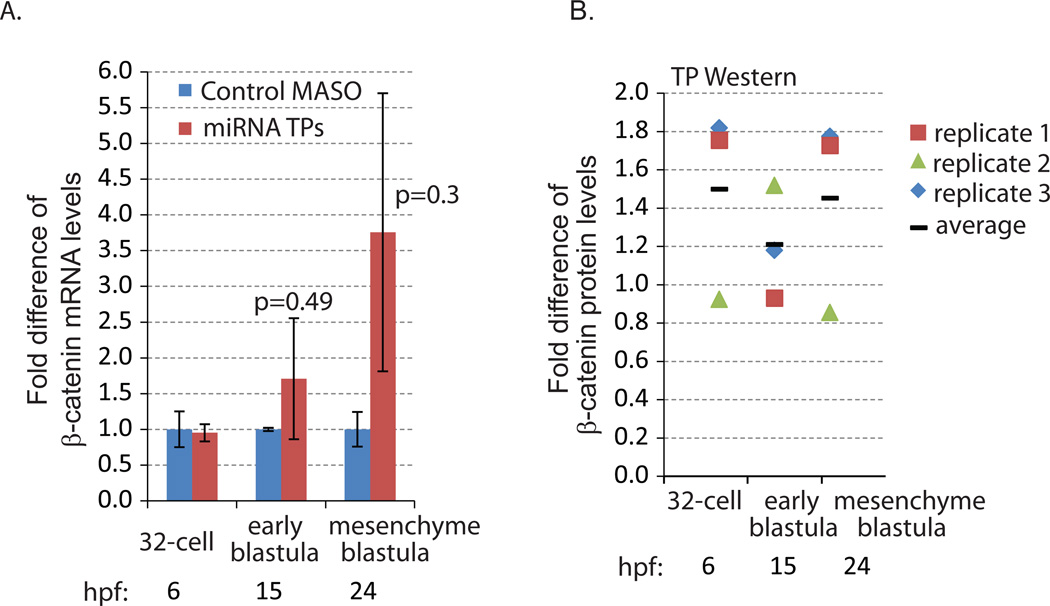
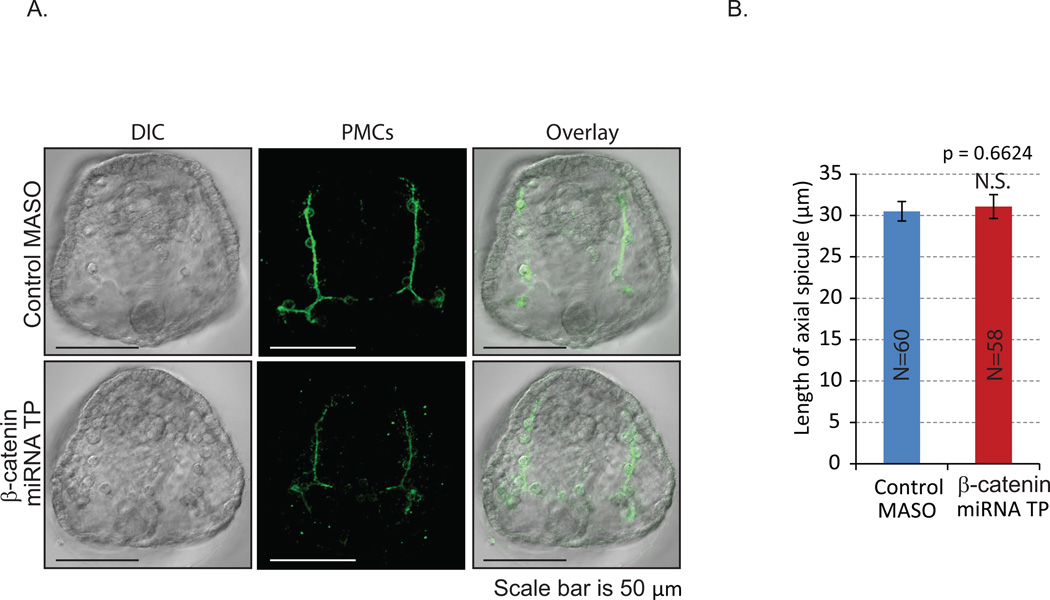
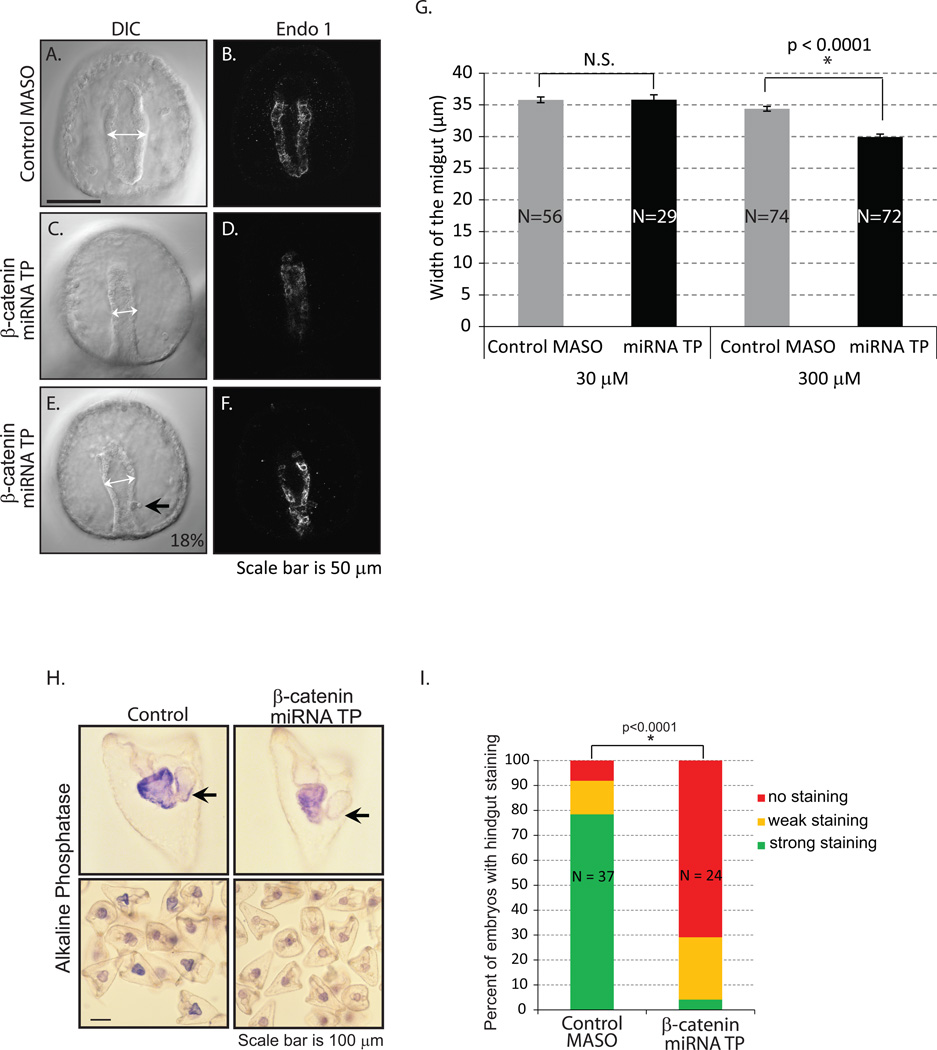
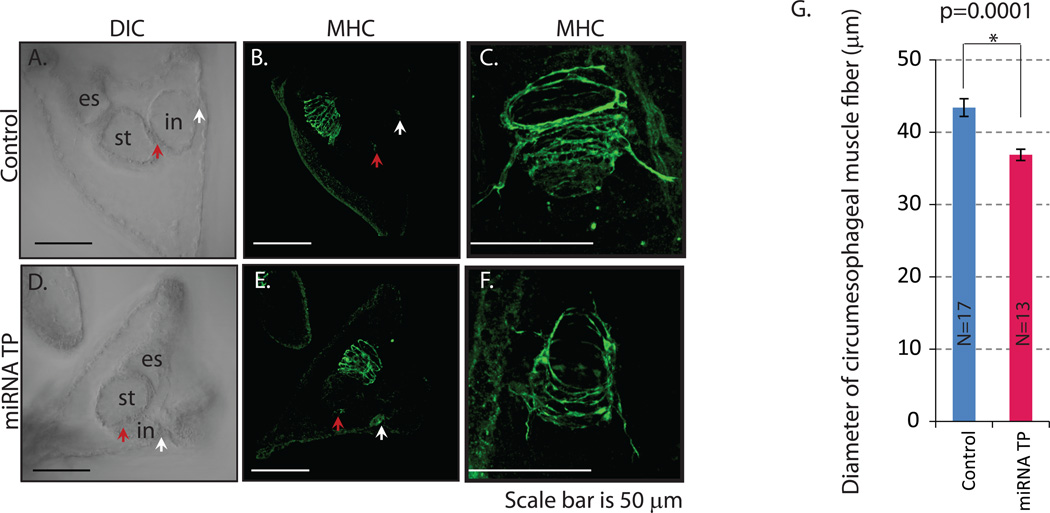
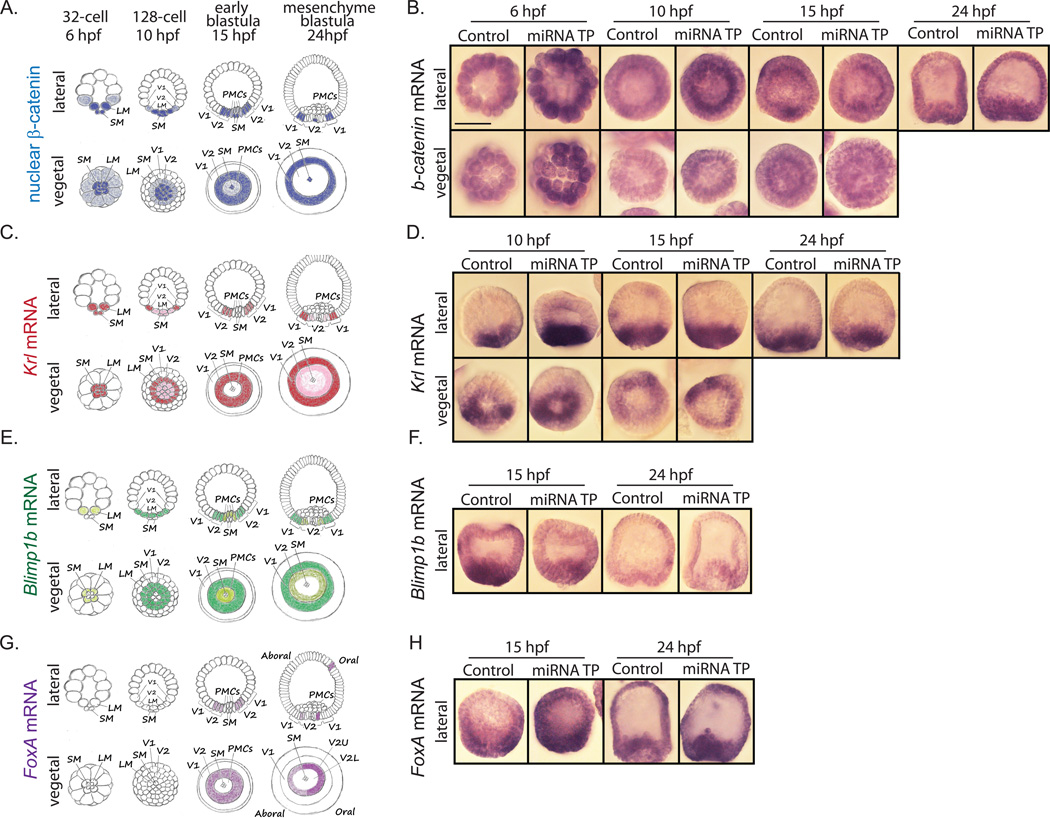
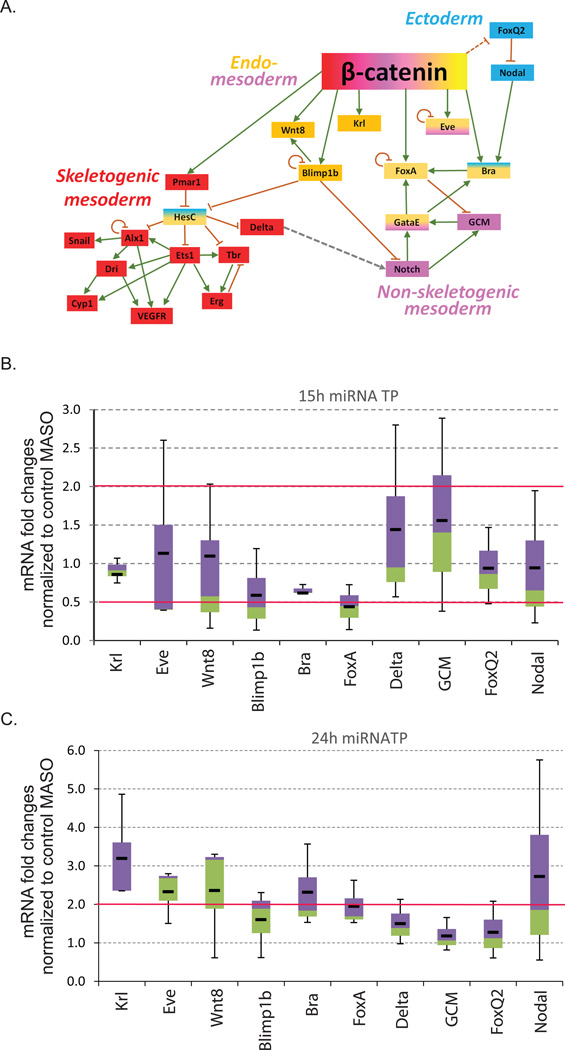
Development of complex multicellular organisms requires careful regulation at both transcriptional and post-transcriptional levels. Post-transcriptional gene regulation is in part mediated by a class of non-coding RNAs of 21-25 nucleotides in length known as microRNAs (miRNAs). β-catenin, regulated by the canonical Wnt signaling pathway, has a highly evolutionarily conserved function in patterning early metazoan embryos, in forming the Anterior-Posterior axis, and in establishing the endomesoderm. Using reporter constructs and site-directed mutagenesis, we identified at least three miRNA binding sites within the 3' untranslated region (3'UTR) of the sea urchin β-catenin. Further, blocking these three miRNA binding sites within the β-catenin 3'UTR to prevent regulation of endogenous β-catenin by miRNAs resulted in a minor increase in β-catenin protein accumulation that is sufficient to induce aberrant gut morphology and circumesophageal musculature. These phenotypes are likely the result of increased transcript levels of Wnt responsive endomesodermal regulatory genes. This study demonstrates the importance of miRNA regulation of β-catenin in early development.

Keywords: Circumesophageal muscles; Endoderm; Larval gut; Mesoderm; PMCs; Post-transcriptional regulation; Sea urchin; Target protectors.


Figures

Fig. 1
Fig. 1. Real time, quantitative PCR (qPCR) of β-catenin transcript levels
(A) The transcript levels of β-catenin were measured in control MASO and Dicer MASO-injected (1.5 mM stock injection solution) embryos. Results were normalized to the mRNA expression of the housekeeping gene ubiquitin and shown as fold changes compared to control embryos that were injected with the control MASO using the ΔΔCt method. The transcript level of β-catenin was significantly more abundant in Dicer MASO than in the control MASO-injected embryos at the mesenchyme blastula stage. Standard error bars are graphed. At least three independent biological replicates with 80–100 embryos per replicate were tested. hpf= hours post fertilization. *Student T-test, p=0.005. (B) Time course expression profile of β-catenin mRNA. The transcript levels of β-catenin were measured in uninjected embryos collected at various developmental stages. Results were normalized to the mRNA expression of the housekeeping gene ubiquitin. The estimated numbers of β-catenin transcripts are calculated based on the level of ubiquitin in various developmental stages described previously (Materna and Davidson, 2012; Materna and Oliveri, 2008). At least three independent biological replicates with 200 embryos per replicate were tested. 2.5 embryo equivalents were used. Individual data points are shown and the average is graphed as a line. β-catenin transcripts are most abundant between the 32-cell and early blastula stages. Its level decreases and stabilizes from the mesenchyme blastula stage to the larval stage. Normalized sequence reads of miR-2007 and miRDeep2-30364-35240 from our previous study are plotted (Song et al., 2012). β-catenin mRNAs and these miRNAs have inverse expression patterns.
Fig. 2
Fig. 2. Mutagenesis analysis of potential miRNA binding site within the β-catenin 3’UTR
3’UTR of β-catenin was cloned downstream of the Renilla luciferase (RLuc) construct for testing miRNA regulation. (A) Schematic of various reporter constructs with wild type (WT) or mutated miRNA binding sites within the β-catenin 3’UTR is depicted. The Firefly luciferase reporter construct is flanked with Xenopus β-globin UTRs and used as a microinjection control for normalization. Newly fertilized eggs were coinjected with mRNAs of either RLuc CDS fused with the wild type β-catenin 3’UTR or fused with the β-catenin with miRNA seed mutations at miR-2007 and/or miRDeep2-30364-35240 sites and Firefly luciferase. (B) The embryos were collected at mesenchyme blastula stage (24 hpf). The RLuc readings were normalized to the Firefly luciferase readings. These RLuc/Firefly luciferase ratios of the mutated constructs were normalized to the control. miR-2007 at 922 bp and miRDeep2-30364-35240 contain functional miRNA binding sites (3 biological replicates with 50 embryos each). *Student T-test is used to analyze the significance between the constructs with wild type β-catenin 3’UTR and β-catenin 3’UTR with mutated miRNA seeds. N.S.=not significant.
Fig. 3
Fig. 3. β-catenin miRNA TP induced increased β-catenin protein and mRNA levels
(A) qPCR was used to measure the transcript levels of β-catenin in the embryos injected with control and miRNA TP MASOs against the three functional miRNA binding sites. 100 embryos were collected at the 32-cell (6 hpf), early blastula (15 hpf) and mesenchyme blastula (24 hpf) stages. The mRNA level of β-catenin was increased at early blastula and mesenchyme blastula stages when miRNA regulation of β-catenin was abolished. However, these increases were not significant in β-catenin miRNA TP and control MASO-treated embryos (Student T-test). Hpf = hours post fertilization. (B) Western blot of 200 embryos injected with control or miRNA TPs. The embryos were collected at the 32-cell (6 hpf), early blastula (15 hpf) and mesenchyme blastula (24 hpf) stages. Compared to control embryos, embryos injected with miRNA TPs accumulated on average 1.5 times more β-catenin protein at the 32-cell and mesenchyme blastula stages. β-catenin protein levels are normalized to actin (3 biological replicates). Individual data points were indicated by the different icons. The average is graphed as a black bar.
Fig. 4
Fig. 4. Removal of miRNA regulation of β-catenin does not affect skeletogenesis
Gastrula stage embryos (48 hpf) were immunolabeled with the 1D5 antibody against primary mesenchyme cell (PMC)-specific membrane protein (McClay et al., 1983) and imaged with an LSM 780 scanning confocal microscope. Z-stacks were reconstructed into a single projected image. (A) Removal of miRNA regulation of β-catenin did not affect PMC patterning. (B) The length of axial skeletogenic spicules was not significantly changed in the miRNA TP injected gastrula embryos compared to control. Student T-test, p=0.662. N is the total number of axial spicules measured. N.S.=not significant.
Fig. 5
Fig. 5. Removal of miRNA regulation on β-catenin results in aberrant gut morphology
Gastrulae were immunolabeled with Endo1, an antigen expressed in the midgut and hindgut of the embryo (Wessel et al., 1990), and imaged with an LSM 780 scanning confocal microscope. (A–B) Gastrulae injected with control MASO had a straight tubular gut that is lined with a single layer of epithelial cells. (C–F) β-catenin miRNA TP treatment resulted in embryos with narrower gut structure. (E–F) 18% of the 97 embryos miRNA TP injected embryos had an aberrant hindgut structure (black arrow) (2 out of 4 biological replicates). (G) The width of the midgut was measured with embryos injected with either 30 µM or 300 µM stock of β-catenin miRNA TP (white arrows). Only the 300 µM miRNA TP treated embryos had a significantly narrower gut than the control. *Student T-test, p<0.0001. N is the total number of embryos imaged and phenotyped. N.S. = not significant. (H) The alkaline phosphatase staining was used to assess endodermal differentiation of the larvae. Control MASO-injected embryos have more intense alkaline phosphate staining than the β-catenin miRNA TP treated embryos. Many of the embryos exposed to the β-catenin miRNA TP lack alkaline phosphatase staining in the intestine (hindgut) (arrows). (I) The percentage of embryos with hindgut staining in the miRNA TP treatment group is significantly lower than in the control embryos. *Fisher’s Exact Test (no hindgut staining vs. hindgut staining, p<0.0001). N is the total number of embryos examined.
Fig. 6
Fig. 6. β-catenin miRNA TP-treated embryos have normal sphincters but less well developed circumesophageal musculature
Three day old larvae were immunolabeled with the myosin heavy chain antibody (MHC) (Wessel et al., 1990) to detect circumpharyngeal muscle fibers and sphincters (red arrow-pyloric sphincter; white arrow-anal sphincter) that compartmentalize the larval gut. (A) DIC image of the control larva. (B) Control larva immunolabeled with MHC. (C) Zoomed in view of a normal larval circumpharyngeal muscles. (D) DIC of the β-catenin miRNA TP-treated embryo. (E) β-catenin miRNA TP treated embryo immunolabeled with MHC. (F) Zoomed in view of the larval circumpharyngeal muscles from β-catenin miRNA TP injected larvae. es=esophagus/foregut; st=stomach/midgut; in=intestine/hindgut. (G) The diameter of the circumesophageal muscle fibers is significantly smaller in the β-catenin miRNA TP treated embryos compared to the control embryos.
Fig. 7
Fig. 7. Removal of miRNA regulation of β-catenin does not affect the spatial localization of Wnt responsive genes
(A) Schematic depicts the localization of nuclear β-catenin (Logan et al., 1999) (C) Schematic depicts the localization of Krl mRNA (Howard et al., 2001; Minokawa et al., 2004; Peter and Davidson, 2010) (E) Schematic depicts the localization of Blimp1b mRNA (Livi and Davidson, 2006; Peter and Davidson, 2010, 2011; Smith et al., 2007) (G) Schematic depicts the localization of FoxA mRNA (Oliveri et al., 2006; Peter and Davidson, 2010). SM = small micromeres, LM = large micromeres, V1 = Veg1 tier, V2 = Veg2 tier, V2U = Veg2 upper region, V2L = Veg2 lower region, PMCs = primary mesenchyme cells. Whole mount in situ hybridization was performed to address the spatial localization of (B) β-catenin and Wnt responsive genes, including (D) Krl, (F) Blimp1b and (H) FoxA as a result of β-catenin miRNA TP treatment. Embryos were collected at various developmental stages. Spatial localizations of Krl, Blimp1b and FoxA transcripts were not affected by removal of miRNA regulation of β-catenin.
Fig. 8
Fig. 8. Removal of miRNA regulation of β-catenin results in the transcript changes of Wnt responsive genes
(A) Simplified gene regulatory network activated by Wnt/β-catenin signaling pathway. Skeletogenesis (red) is indirectly regulated by β-catenin through a single transcriptional repressor Pmar1 (Oliveri et al., 2003). Endoderm (orange) and mesoderm (purple) formation is regulated by multiple direct targets of β-catenin such as Krl (Howard et al., 2001; Minokawa et al., 2004; Peter and Davidson, 2011), FoxA (Oliveri et al., 2006), Blimp1b (Livi and Davidson, 2006; Smith et al., 2007), Eve (Peter and Davidson, 2010, 2011), Wnt8 (Wikramanayake et al., 2004) and Bra (Gross and McClay, 2001). In addition, β-catenin indirectly regulates ectoderm differentiation through indirect regulation of FoxQ2 (Angerer et al., 2011; Range et al., 2013; Yaguchi et al., 2008). (B) qPCR was used to measure the transcript levels of genes involved in the specification of endoderm, mesoderm, and ectoderm in control and β-catenin miRNA TP-injected embryos at the early blastula stage (15 hpf). (C) qPCR was used to measure the transcript levels of genes involved in the specification of endoderm, mesoderm, and ectoderm in control and β-catenin miRNA TP-injected embryos at the mesenchyme blastula stage (24 hpf). Most of the endomesodermal regulatory genes have ≥2-fold increase in transcript levels in miRNA TP treated embryos in comparison to the control embryos at mesenchyme blastula stage but not at early blastula stage (3–5 biological replicates). The box plot represents the third quartile (purple) and the first quartile (green). Median is the junction between the first and the third quartile. The whiskers represent the maximum and the minimum of the data. The average of the data is shown by the black line. Red line indicates the 2-fold changes.

Similar articles

Cited by

References

    1. Aberle H, Schwartz H, Kemler R. Cadherin-catenin complex: protein interactions and their implications for cadherin function. J Cell Biochem. 1996;61:514–523. - PubMed
    1. Anastas JN, Moon RT. WNT signalling pathways as therapeutic targets in cancer. Nat Rev Cancer. 2013;13:11–26. - PubMed
    1. Andrikou C, Iovene E, Rizzo F, Oliveri P, Arnone MI. Myogenesis in the sea urchin embryo: the molecular fingerprint of the myoblast precursors. Evodevo. 2013;4:33. - PMC - PubMed
    1. Angerer LM, Yaguchi S, Angerer RC, Burke RD. The evolution of nervous system patterning: insights from sea urchin development. Development. 2011;138:3613–3623. - PMC - PubMed
    1. Annunziata R, Perillo M, Andrikou C, Cole AG, Martinez P, Arnone MI. Pattern and process during sea urchin gut morphogenesis: The regulatory landscape. Genesis. 2013 - PubMed

Publication types

MeSH terms

LinkOut - more resources