

Comparing 3T and 1.5T MRI for mapping hippocampal atrophy in the Alzheimer's Disease Neuroimaging Initiative
- PMID: 25614473
- PMCID: PMC5832348
- DOI: 10.3174/ajnr.A4228
Comparing 3T and 1.5T MRI for mapping hippocampal atrophy in the Alzheimer's Disease Neuroimaging Initiative
Abstract
Background and purpose: Prior MR imaging studies, primarily at 1.5T, established hippocampal atrophy as a biomarker for Alzheimer disease. 3T MR imaging offers a higher contrast and signal-to-noise ratio, yet distortions and intensity uniformity are harder to control. We applied our automated hippocampal segmentation technique to 1.5T and 3T MR imaging data, to determine whether hippocampal atrophy detection was enhanced at 3T.
Materials and methods: We analyzed baseline MR imaging data from 166 subjects from the Alzheimer's Disease Neuroimaging Initiative-1 (37 with Alzheimer disease, 76 with mild cognitive impairment, and 53 healthy controls) scanned at 1.5T and 3T. Using multiple linear regression, we analyzed the effect of clinical diagnosis on hippocampal radial distance, while adjusting for sex. 3D statistical maps were adjusted for multiple comparisons by using permutation-based statistics at a threshold of P < .01.
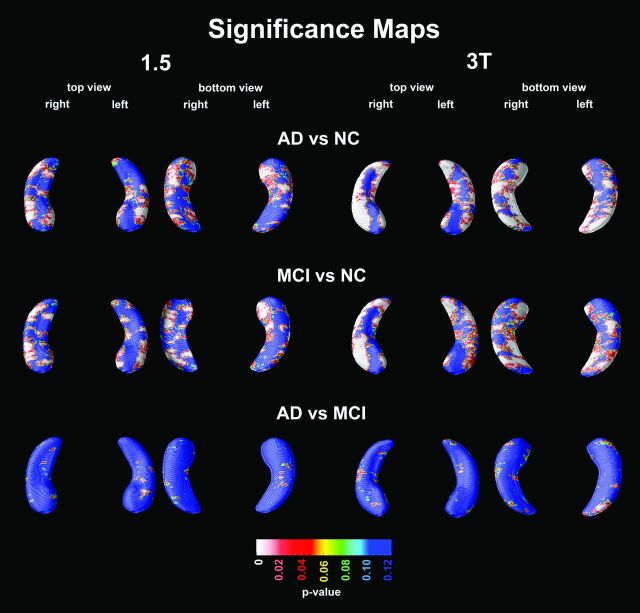
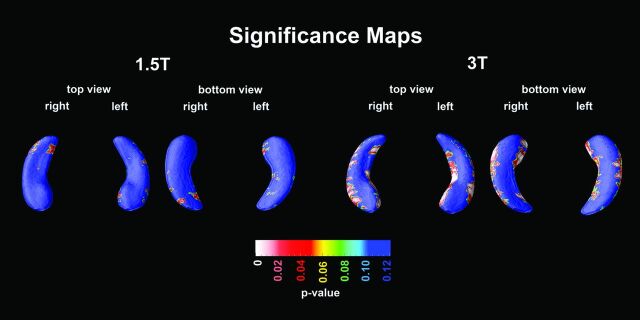
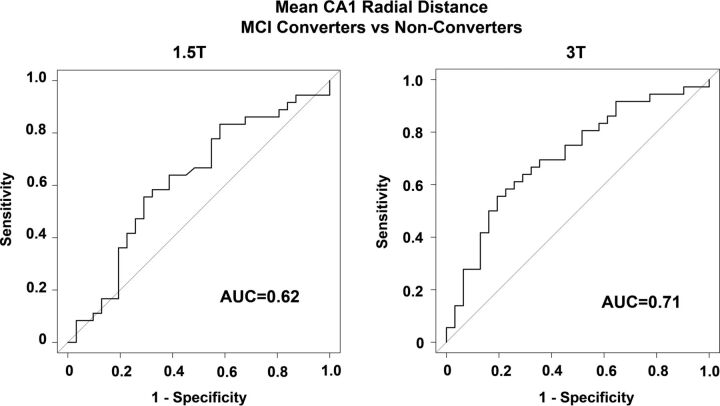
Results: Bilaterally significant radial distance differences in the areas corresponding to the cornu ammonis 1, cornu ammonis 2, and subiculum were detected for Alzheimer disease versus healthy controls and mild cognitive impairment versus healthy controls at 1.5T and more profoundly at 3T. Comparison of Alzheimer disease with mild cognitive impairment did not reveal significant differences at either field strength. Subjects who converted from mild cognitive impairment to Alzheimer disease within 3 years of the baseline scan versus nonconverters showed significant differences in the area corresponding to cornu ammonis 1 of the right hippocampus at 3T but not at 1.5T.
Conclusions: While hippocampal atrophy patterns in diagnostic comparisons were similar at 1.5T and 3T, 3T showed a superior signal-to-noise ratio and detected atrophy with greater effect size compared with 1.5T.
© 2015 by American Journal of Neuroradiology.
Figures
References
-
- Alzheimer's Association. 2013 Alzheimer's disease facts and figures. Alzheimers Dement 2013;9:208–45 - PubMed
-
- Petersen RC, Doody R, Kurz A, et al. Current concepts in mild cognitive impairment. Arch Neurol 2001;58:1985–92 - PubMed
-
- Bobinski M, de Leon MJ, Wegiel J, et al. The histological validation of post mortem magnetic resonance imaging-determined hippocampal volume in Alzheimer's disease. Neuroscience 2000;95:721–25 - PubMed
Publication types
MeSH terms
Grants and funding
- R01 AG040770/AG/NIA NIH HHS/United States
- P50 AG023501/AG/NIA NIH HHS/United States
- P50 AG16570/AG/NIA NIH HHS/United States
- EB008561/EB/NIBIB NIH HHS/United States
- R21 RR019771/RR/NCRR NIH HHS/United States
- R01 LM005639/LM/NLM NIH HHS/United States
- U01 AG024904/AG/NIA NIH HHS/United States
- U01AG024904/AG/NIA NIH HHS/United States
- EB01651/EB/NIBIB NIH HHS/United States
- RR019771/RR/NCRR NIH HHS/United States
- P50 AG016570/AG/NIA NIH HHS/United States
- K23 AG026803/AG/NIA NIH HHS/United States
- U54 RR021813/RR/NCRR NIH HHS/United States
- RR021813/RR/NCRR NIH HHS/United States
- LM05639/LM/NLM NIH HHS/United States
LinkOut - more resources
Full Text Sources
Medical