. 2015 Mar;25(3):353-67.
doi: 10.1101/gr.175919.114. Epub 2015 Jan 22.

A systems-level approach to parental genomic imprinting: the imprinted gene network includes extracellular matrix genes and regulates cell cycle exit and differentiation

Affiliations

A systems-level approach to parental genomic imprinting: the imprinted gene network includes extracellular matrix genes and regulates cell cycle exit and differentiation

Hala Al Adhami et al. Genome Res. 2015 Mar.

Abstract

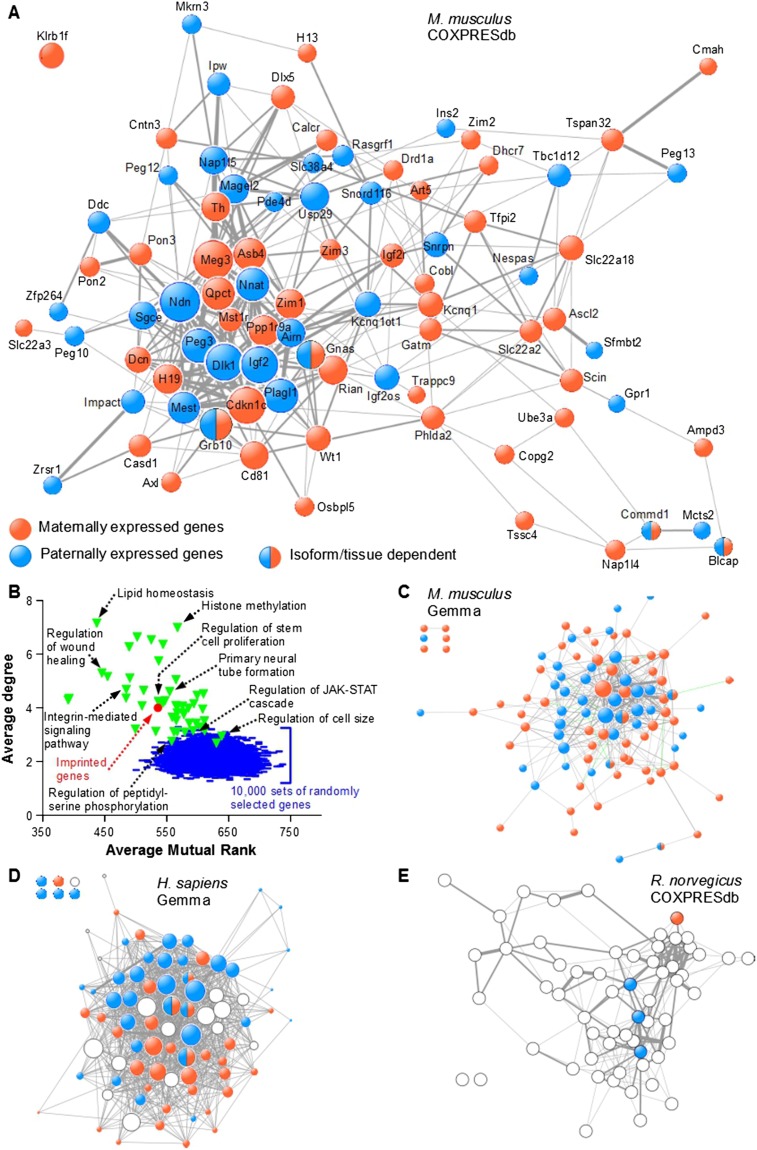
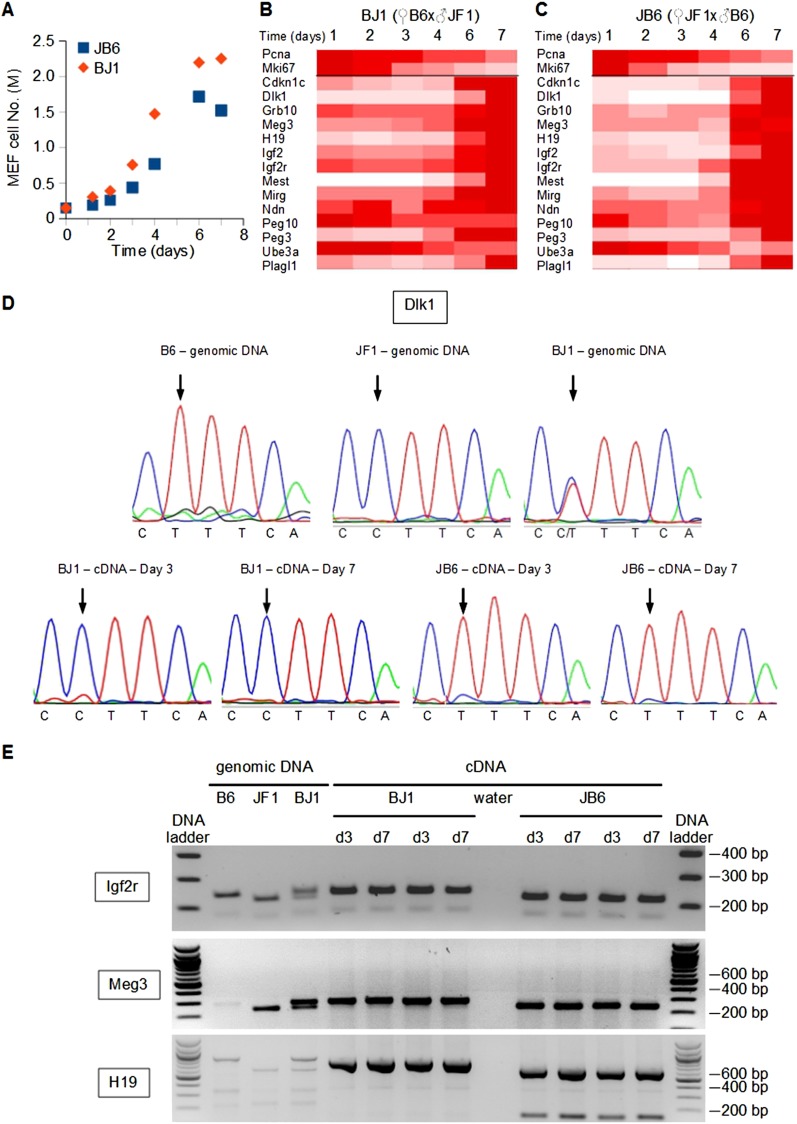
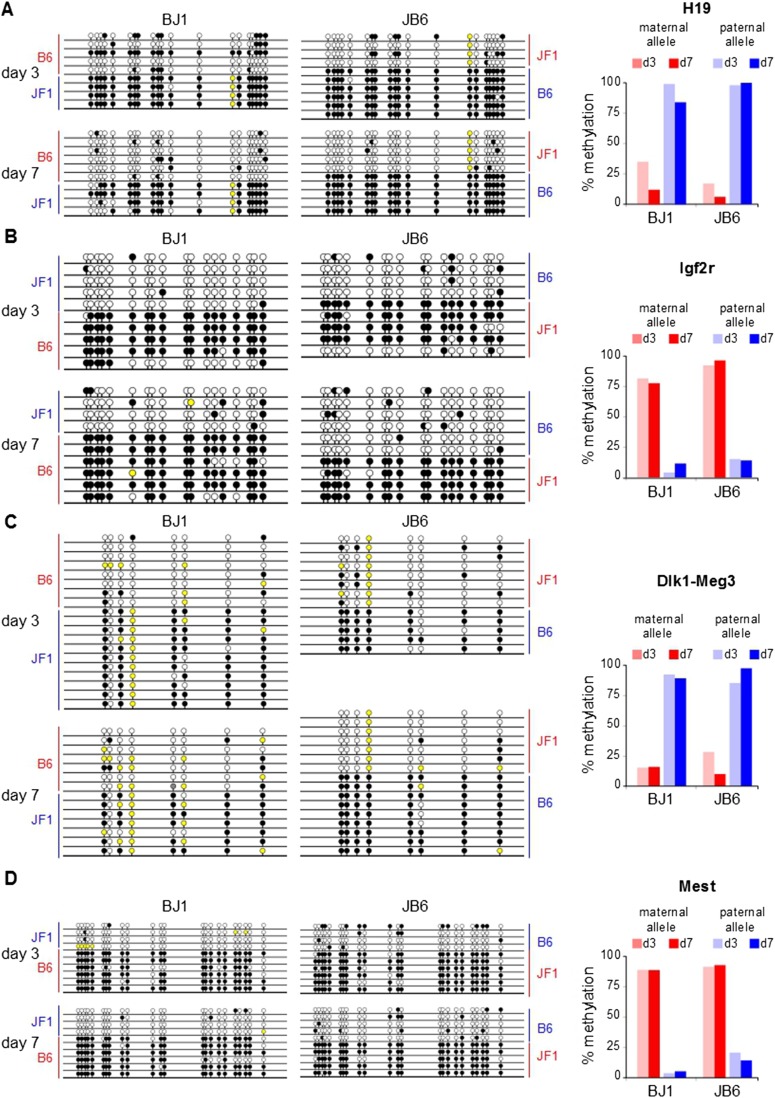
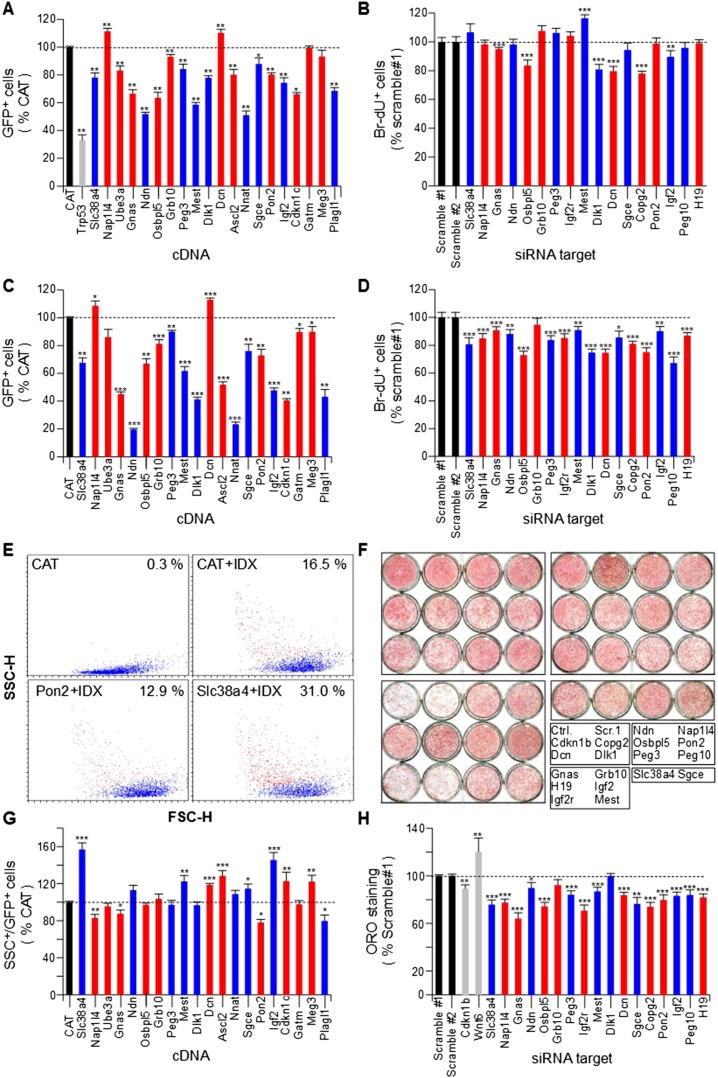
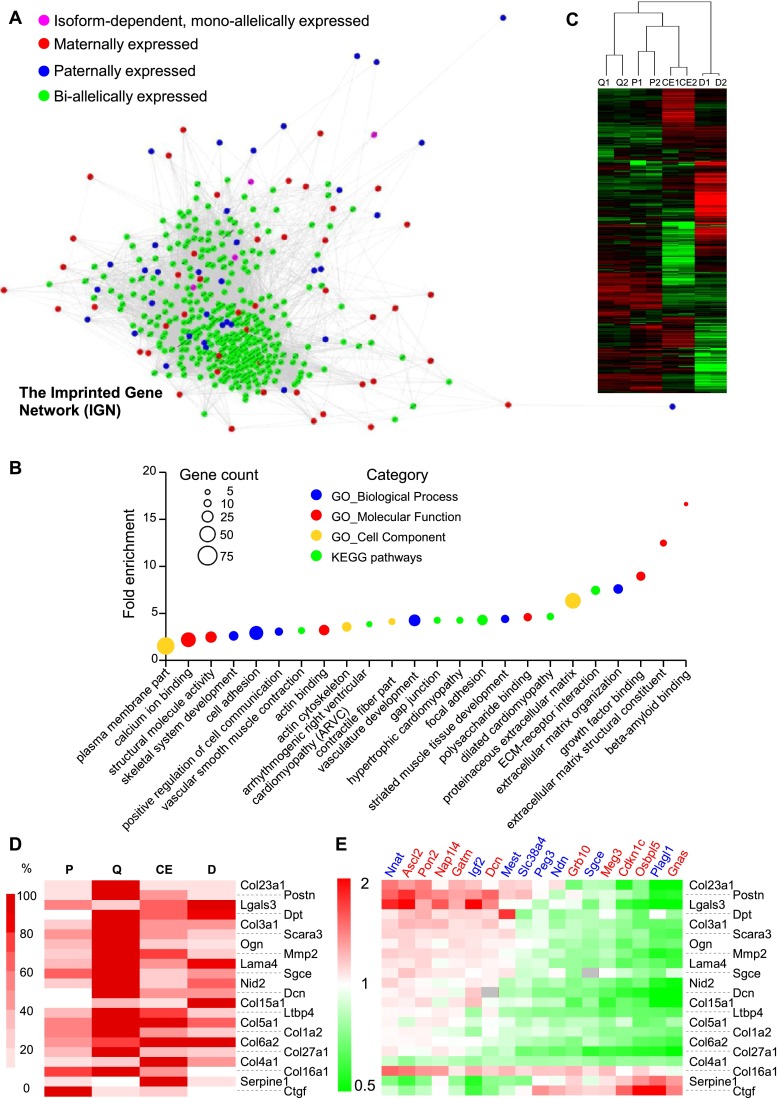
Genomic imprinting is an epigenetic mechanism that restrains the expression of ∼ 100 eutherian genes in a parent-of-origin-specific manner. The reason for this selective targeting of genes with seemingly disparate molecular functions is unclear. In the present work, we show that imprinted genes are coexpressed in a network that is regulated at the transition from proliferation to quiescence and differentiation during fibroblast cell cycle withdrawal, adipogenesis in vitro, and muscle regeneration in vivo. Imprinted gene regulation is not linked to alteration of DNA methylation or to perturbation of monoallelic, parent-of-origin-dependent expression. Overexpression and knockdown of imprinted gene expression alters the sensitivity of preadipocytes to contact inhibition and adipogenic differentiation. In silico and in cellulo experiments showed that the imprinted gene network includes biallelically expressed, nonimprinted genes. These control the extracellular matrix composition, cell adhesion, cell junction, and extracellular matrix-activated and growth factor-activated signaling. These observations show that imprinted genes share a common biological process that may account for their seemingly diverse roles in embryonic development, obesity, diabetes, muscle physiology, and neoplasm.


Figures

Figure 1.
Figure 1.
Imprinted genes are frequently coexpressed. (A) The COXPRESdb meta-analysis of microarray data was searched for coexpression among murine IGs. The resulting coexpression links are represented using Cytoscape. Node size is proportional to node degree. Edge width represents the mutual rank (see Supplemental Information) between two given nodes. (B) The average degree and average mutual rank were computed for the network of 85 IGs displayed in A (red circle). Random networks (blue lines) were generated by randomly drawing 10,000 sets of 85 Gene IDs with data in COXPRESdb and retrieving coexpression links as for the 85 murine IGs. A similar procedure was performed with 50 sets of 85 genes found in GO Biological Processes (green triangles) and with data in COXPRESdb (for a full list of the GO BPs analyzed, see Supplemental Table S22). (C) The Gemma meta-analysis of microarray data was searched for coexpression among murine IGs. Node size is proportional to node degree. Edge width maps the number of data sets in which two given nodes are coexpressed. (D) The Gemma database was searched for coexpression among human IGs and orthologs of murine IGs whose imprinting status in humans is unknown or uncertain (open circles) as in C. (E) The COXPRESdb was searched for coexpression of rat IGs and orthologs of murine IGs whose imprinting status in rat is unknown (open circles) as in A.
Figure 2.
Figure 2.
Imprinted genes are coregulated upon cell cycle exit/reentry and differentiation. (A) Heatmap of IG expression levels following serum withdrawal. Exponentially growing mouse embryonic fibroblasts were serum-starved, and expression levels of the indicated IGs were monitored by real-time PCR at the indicated time after serum withdrawal. Data for each IG are expressed as the percentage of the maximal expression levels for that IG. (B) The 3T3-L1 adipogenic differentiation model. 3T3-L1 preadipocytes were grown exponentially (P, proliferation) until they reached confluence (Q, quiescence) following contact inhibition. Forty-eight hours later, they were either split and resumed exponential growth, or induced to differentiate following addition of IDX. In the latter condition, induced preadipocytes resumed proliferation during the clonal expansion phase (CE, clonal expansion), and eventually exited the cell cycle and differentiated (D, differentiation). (C) Heatmap of IG expression levels during 3T3-L1 exponential growth and quiescence. 3T3-L1 preadipocytes were grown as described in B. Expression levels of the indicated IGs were monitored and depicted as in A. Pcna is a marker of cell proliferation. (D) Heatmap of IG expression levels during 3T3-L1 adipogenic differentiation. 3T3-L1 preadipocytes were grown as in B. Expression levels of the indicated IGs were monitored and represented as in A. Cebpd, Pparg, Lpl, Cebpa, Plin1, Adipoq, Slc2a4, and Lep are markers of early and late adipogenic differentiation.
Figure 3.
Figure 3.
Monoallelic, parent-of-origin-dependent expression of imprinted genes is not altered in quiescent versus proliferating mouse embryonic fibroblasts. (A) Time course of cell numbers. JB6 and BJ1 MEFs were grown in vitro until they reached confluence. (B,C) Expression levels of proliferation markers (Pcna, Mki67) and representative IGs were monitored by real-time PCR in JB6 (B) and BJ1 (C) MEFs. Data for each gene are expressed as the percentage of the maximal expression levels for that gene. (D) Sequence of a polymorphic region (C[T/C]TTCA) of the Dlk1 gene (top panels) and transcripts (bottom panels). Genomic DNAs from C57BL/6J (B6), JF1/Ms, and C57BL/6J × JF1/Ms (BJ1) were sequenced and display the T, C, and C/T alleles, respectively. Sequencing of cDNAs from proliferating (day 3) and quiescent (day 7) MEFs derived from C57BL/6J × JF1/Ms (BJ1) and JF1/Ms × C57BL/6J (JB6) crosses indicates that only the paternal Dlk1 allele is expressed. (E) Genomic DNA and cDNAs were PCR amplified at the indicated loci from the indicated crosses. The amplicons from the Meg3 and H19 loci were digested with Bsh1236I and BclI, respectively. Digested and undigested amplicons were run on an ethidium bromide–stained agarose gel.
Figure 4.
Figure 4.
Methylation pattern of differentially methylated regions at IG loci. Bisulfite-treated genomic DNAs from BJ1 and JB6 MEFs grown in vitro for the indicated period of time were PCR amplified at the indicated loci (A, H19; B, Igf2r; C, Dlk1-Meg3; D, Mest), subcloned, and sequenced. Filled and open circles denote methylated and unmethylated CpGs, respectively. Yellow circles denote variation from the corresponding C57BL/6J reference genome. B6 and JF1 indicate the parental allele from which each cloned amplicon is derived. Panels on the right side of the figure display the percentage of methylated maternal or paternal allele at each locus and each time point.
Figure 5.
Figure 5.
Modulation of imprinted gene expression alters cell cycle exit and adipogenic differentiation of 3T3-L1 preadipocytes. (A) Effect of IG overexpression on cell numbers during exponential growth. Exponentially growing 3T3-L1 cells were cotransfected with eGFP and CAT (chloramphenicol acetyl transferase) as a negative control, Trp53 as a positive control of cell growth inhibition, or cDNAs encoding the indicated IGs. Following plating at low density, GFP-positive cells were counted 48 h post-transfection (n = 8): 84.8 ± 6.4% CAT-transfected cells were GFP positive. (B) Effect of IG down-regulation on DNA synthesis during exponential growth. Exponentially growing 3T3-L1 cells were transfected with siRNAs targeting the indicated IGs and plated at low density. DNA synthesis was monitored by measuring BrdU incorporation 24 h post-transfection (n = 20) and compared to the appropriate control condition, which displayed 31.9 ± 4.0% BrdU-positive cells. (C) Effect of IG overexpression on cell numbers during clonal expansion. 3T3-L1 cells were cotransfected as in A and plated at confluence. Three days post-transfection, cells were incubated with IDX to trigger adipogenic differentiation. GFP-positive cells were counted 8 d after IDX addition (n = 14): 26.2 ± 5.2% CAT-transfected cells were GFP positive. (D) Effect of IG down-regulation on DNA synthesis when cells reach confluence. 3T3-L1 cells were transfected as in B and plated at mid-confluence. DNA synthesis was monitored as in B (n = 20 for Ndn and Sgce; n = 30 for all other IGs): 11.5 ± 2.4% of control cells were BrdU positive. (E) Effect of Pon2 and Slc38a4 overexpression on adipogenic differentiation of 3T3-L1 preadipocytes. Cells were transfected as in A and plated at confluence. Eight days after IDX addition, cell size (forward light scattering [FSC]) and granularity (side light scattering [SSC]) of GFP-positive cells were measured by flow cytometry. SSC allows visualizing accumulation of lipid vesicles in differentiated adipocytes (red dots). (F) Effect of IG down-regulation on adipogenic differentiation of 3T3-L1 preadipocytes. Representative Oil Red O (ORO, a lipid stain) staining of 3T3-L1 cells that were left untransfected (Ctrl.) or transfected with scramble siRNA (Scr.1) or with siRNAs targeting the indicated genes, plated in duplicate at confluence, incubated with IDX 3 d post-transfection, and fixed 12 d later (n = 20 for Ndn and Sgce; n = 30 for all other IGs). (G) Effect of IG overexpression on adipogenic differentiation of 3T3-L1 preadipocytes. Cells were transfected and treated as in A. Quantification of SSC-, GFP-positive cells after transfection and induction of differentiation, compared to the CAT negative control at day 8 of differentiation (n = 16). (H) Effect of IG down-regulation on adipogenic differentiation of 3T3-L1 preadipocytes. Cells treated as in B were stained with ORO, which was quantified as described in Methods (n = 30). Cdkn1b and Wnt6 are positive controls negatively and positively affecting the adipogenic differentiation process, respectively. Data are mean ± SEM of the indicated number of replicate measures from at least three independent experiments. Statistical significance was assessed using a nonparametric, pairwise Wilcoxon test. (*) P < 0.05; (**) P < 0.01; (***) P < 0.001.
Figure 6.
Figure 6.
The murine imprinted gene network (IGN). (A) Biallelically expressed genes coexpressed with murine IGs were retrieved from COXPRESdb and Gemma. Coexpression links among genes present in the intersection of the two lists (for details, see Supplemental Information) were retrieved from COXPRESdb and represented using Cytoscape. Node size and edge width do not map numerical data. (B) GO terms and KEGG pathways enriched in the set of genes represented in Figure 6A. The fold enrichment is displayed for GO terms/KEGG pathways with Benjamini-Hochberg–corrected P-values < 0.05. The size of each dot is proportional to the number of genes associated with the corresponding GO term/KEGG pathway. (C) Hierarchical clustering of transcriptome data from 3T3-L1 preadipocytes. The transcriptome of two independent cultures of 3T3-L1 cells during exponential growth (P; 48 h prior confluence), quiescence (Q; 48 h post-confluence), the clonal expansion phase (CE; 10 h following addition of IDX), and in the differentiated state (D; 6 d following addition of IDX) was determined using RNA-seq. (D) Heatmap of normalized RNA-seq counts for selected ECM genes. (E) Effect of IG overexpression on ECM gene expression. Complementary DNAs encoding CAT or various IGs were transfected in exponentially growing 3T3-L1 cells. Three days post-transfection, the ECM genes were quantified using real-time PCR, and the ratio to the expression levels in the control condition (CAT) was calculated for each IG and represented as a heatmap. Dcn and Sgce are imprinted ECM genes whose expression levels are not displayed (gray boxes) in the corresponding transfected cells.

References

    1. Asai T, Liu Y, Di Giandomenico S, Bae N, Ndiaye-Lobry D, Deblasio A, Menendez S, Antipin Y, Reva B, Wevrick R, et al. . 2012. Necdin, a p53 target gene, regulates the quiescence and response to genotoxic stress of hematopoietic stem/progenitor cells. Blood 120: 1601–1612. - PMC - PubMed
    1. Barlow DP. 2011. Genomic imprinting: a mammalian epigenetic discovery model. Annu Rev Genet 45: 379–403. - PubMed
    1. Bartolomei MS, Ferguson-Smith AC. 2011. Mammalian genomic imprinting. Cold Spring Harb Perspect Biol 3: a002592. - PMC - PubMed
    1. Berg JS, Lin KK, Sonnet C, Boles NC, Weksberg DC, Nguyen H, Holt LJ, Rickwood D, Daly RJ, Goodell MA. 2011. Imprinted genes that regulate early mammalian growth are coexpressed in somatic stem cells. PLoS ONE 6: e26410. - PMC - PubMed
    1. Bilanges B, Varrault A, Mazumdar A, Pantaloni C, Hoffmann A, Bockaert J, Spengler D, Journot L. 2001. Alternative splicing of the imprinted candidate tumor suppressor gene ZAC regulates its antiproliferative and DNA binding activities. Oncogene 20: 1246–1253. - PubMed

Publication types

Associated data