. 2015 Apr;66(7):1919-34.
doi: 10.1093/jxb/eru537. Epub 2015 Jan 22.

Soybean kinome: functional classification and gene expression patterns

Affiliations

Soybean kinome: functional classification and gene expression patterns

Jinyi Liu et al. J Exp Bot. 2015 Apr.

Abstract

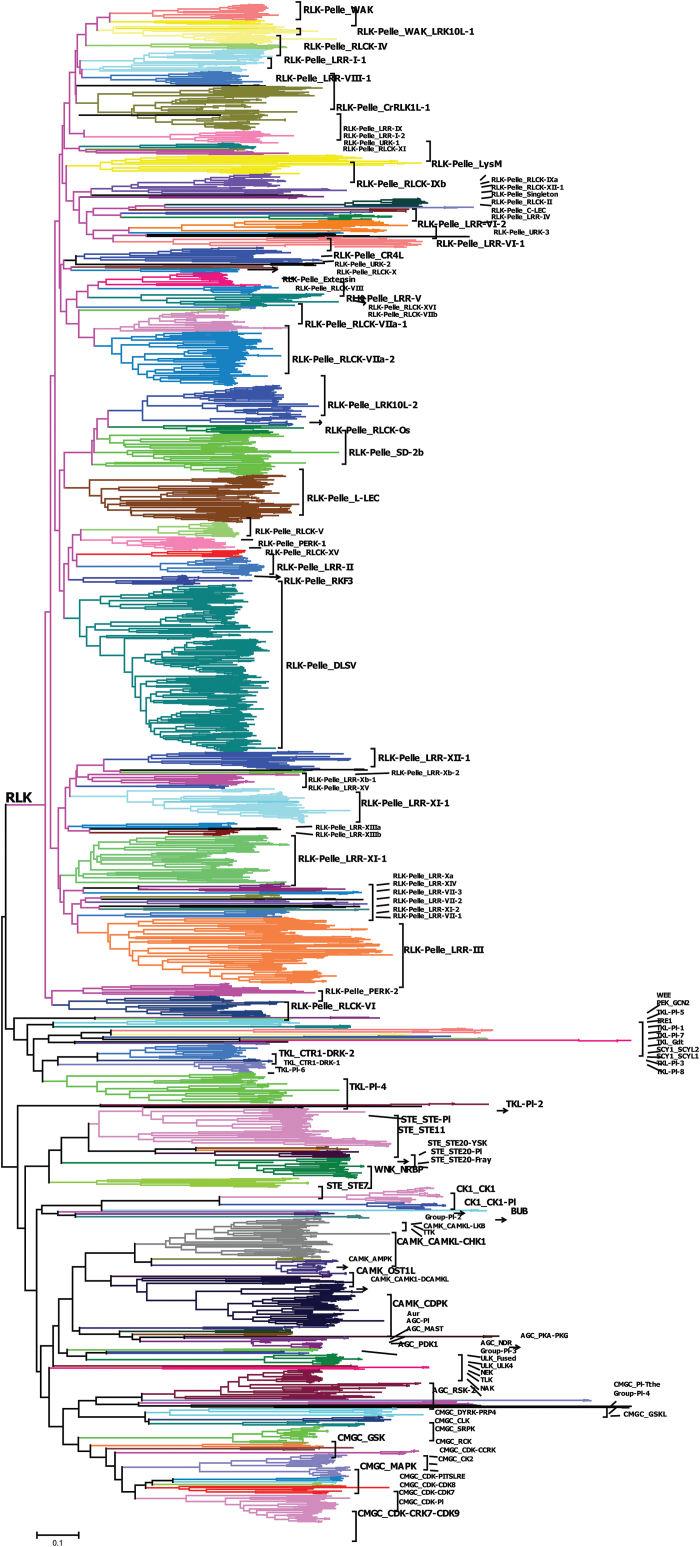
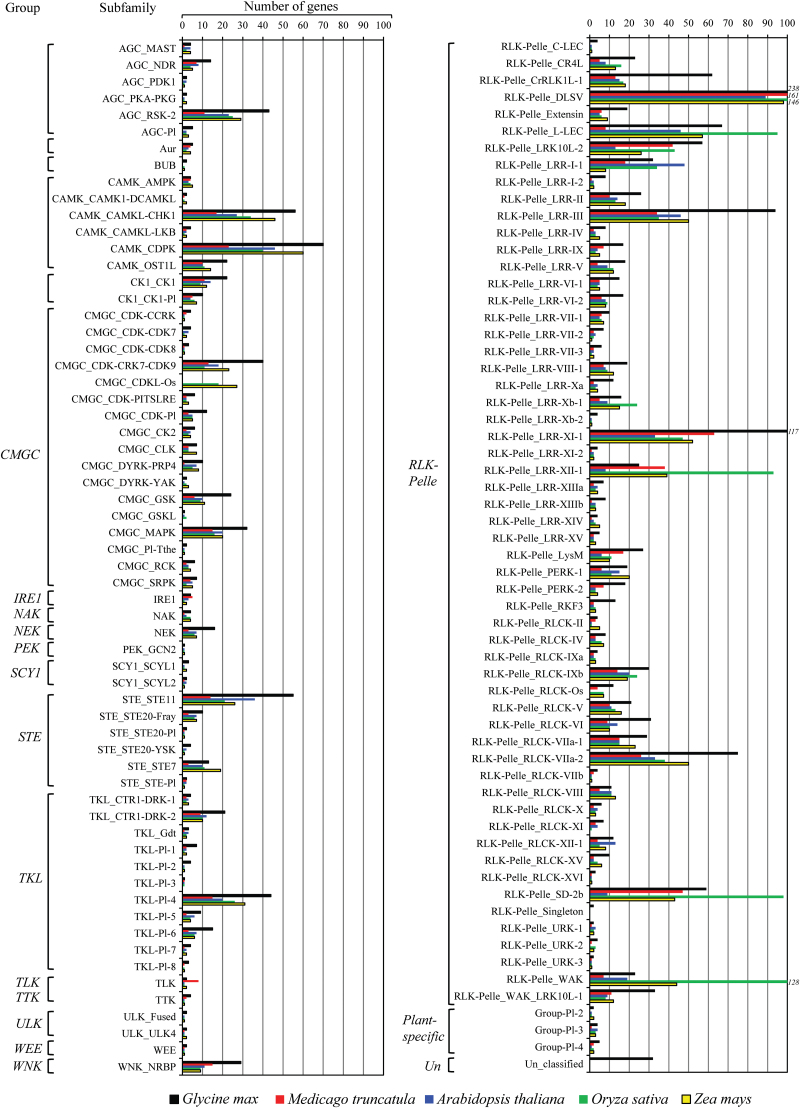
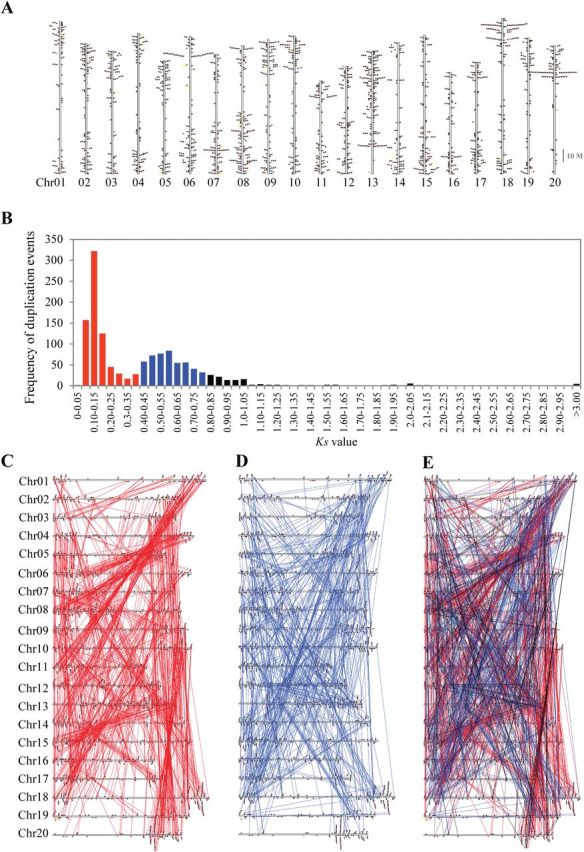
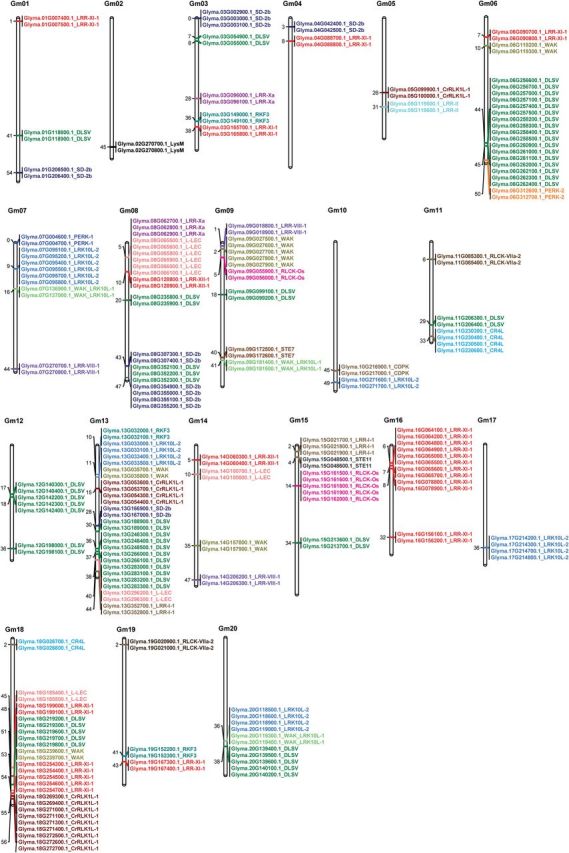
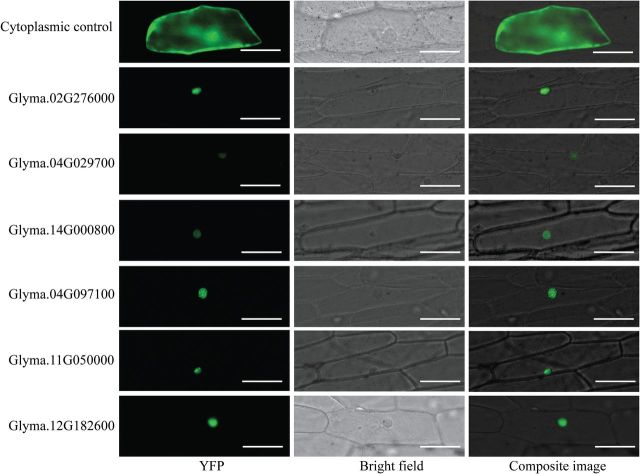
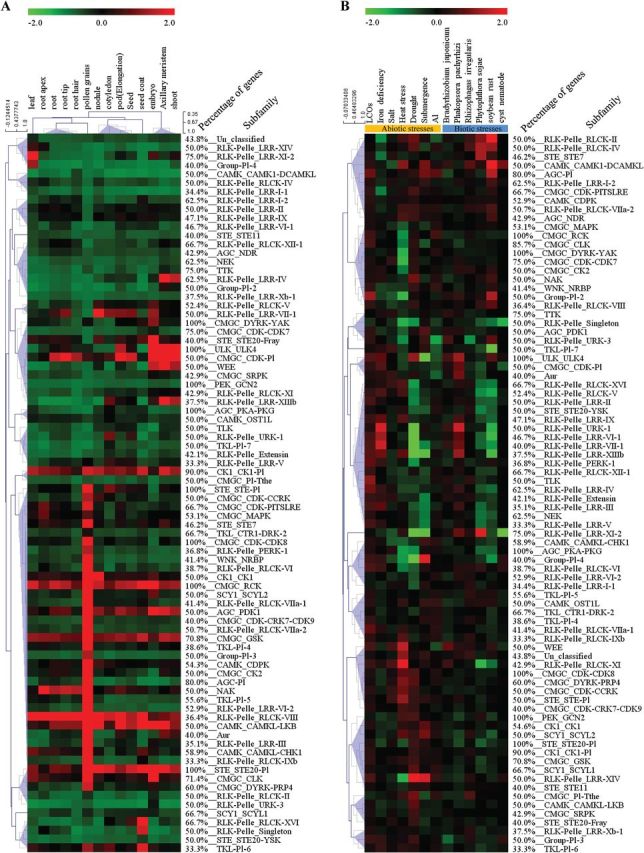
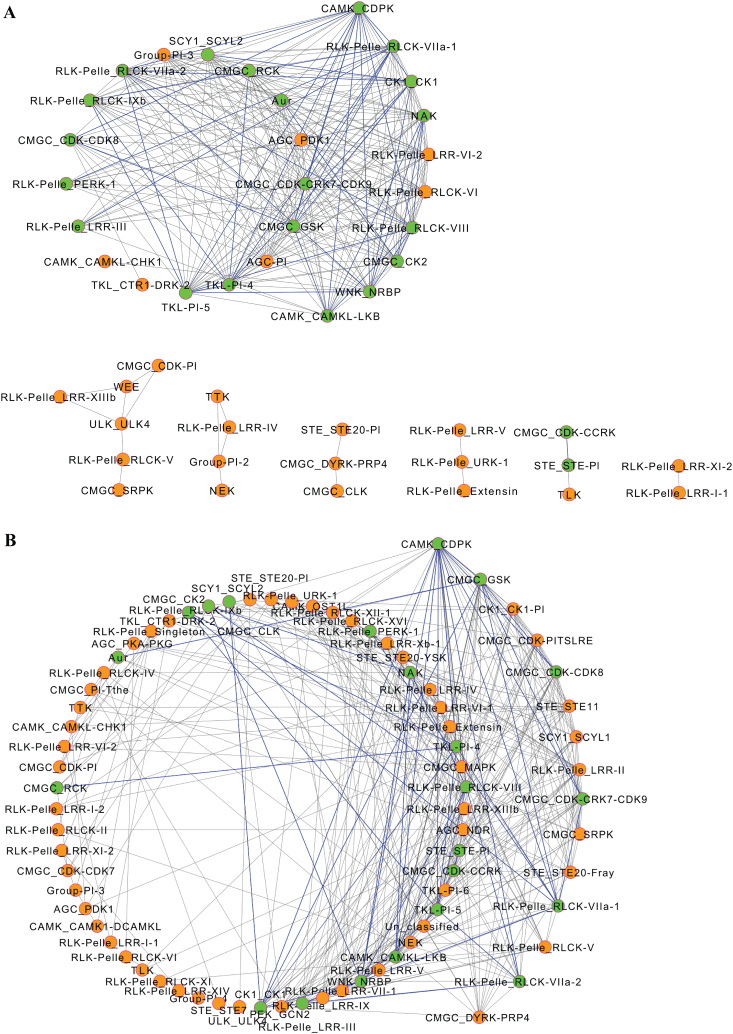
The protein kinase (PK) gene family is one of the largest and most highly conserved gene families in plants and plays a role in nearly all biological functions. While a large number of genes have been predicted to encode PKs in soybean, a comprehensive functional classification and global analysis of expression patterns of this large gene family is lacking. In this study, we identified the entire soybean PK repertoire or kinome, which comprised 2166 putative PK genes, representing 4.67% of all soybean protein-coding genes. The soybean kinome was classified into 19 groups, 81 families, and 122 subfamilies. The receptor-like kinase (RLK) group was remarkably large, containing 1418 genes. Collinearity analysis indicated that whole-genome segmental duplication events may have played a key role in the expansion of the soybean kinome, whereas tandem duplications might have contributed to the expansion of specific subfamilies. Gene structure, subcellular localization prediction, and gene expression patterns indicated extensive functional divergence of PK subfamilies. Global gene expression analysis of soybean PK subfamilies revealed tissue- and stress-specific expression patterns, implying regulatory functions over a wide range of developmental and physiological processes. In addition, tissue and stress co-expression network analysis uncovered specific subfamilies with narrow or wide interconnected relationships, indicative of their association with particular or broad signalling pathways, respectively. Taken together, our analyses provide a foundation for further functional studies to reveal the biological and molecular functions of PKs in soybean.

Keywords: abiotic stress; biotic stress; co-expression network; collinearity analysis; duplication events; gene expression; soybean kinases..


Figures

Fig. 1.
Fig. 1.
Classification and phylogenetic relationships of soybean PK subfamilies. The phylogenetic tree was constructed using MEGA6 software, with the NJ method using kinase domain amino acid sequences. Subfamilies are highlighted with different colours. The RLK group basic branch is labelled. Detailed information of the phylogeny and the corresponding HMM classification are provided in Supplementary Fig. S1 and Supplementary Table S3. (This figure is available in colour at JXB online.)
Fig. 2.
Fig. 2.
Comparison of the size of soybean PK subfamilies with other angiosperm species. The size of 122 soybean PK subfamilies was compared with those of four other plant species comprising two eudicot (A. thaliana and M. truncatula) and two monocot species (O. sativa and Z. mays). (This figure is available in colour at JXB online.)
Fig. 3.
Fig. 3.
Chromosome location and collinearity of soybean PK genes. (A) Chromosomal locations of soybean PKs. The coloured boxes denote different groups of the soybean PK family. (B) Collinearity events among all duplicated PKs in the soybean genome. The bars denote collinearity events contributed by 13-Mya whole-genome-wide duplication (WGD) (K s values 0.06–0.39) and by 59-Mya WGD (K s values 0.40–0.80) and by other WGD events. (C, D) The collinearity events contributed by the 13-Mya (C) and 59-Mya whole-genome-wide duplication (WGD) events (D). (E) Contribution of the 13 and 59 Mya duplication events to the expansion of soybean PKs. The K s values (synonymous distance) of collinearity events (1357) for all syntenically duplicated PKs (1547 genes) were calculated the MCScanX program. The K s values of 0.06–0.39 were used to differentiate the events contributed by the 13-Mya WGD from those contributed by the 59-Mya WGD events (K s values 0.40– 0.80). (This figure is available in colour at JXB online.)
Fig. 4.
Fig. 4.
Chromosomal locations of the 229 tandemly arrayed soybean PK genes. The 229 tandemly arranged PK genes were grouped in 73 clusters distributed unevenly among the 20 soybean chromosomes. Gene IDs and the corresponding subfamily names are indicated. Subfamilies are colour coded and the numbers in the left bar denote chromosomal locations of clusters. (This figure is available in colour at JXB online.)
Fig. 5.
Fig. 5.
Subcellular localization of soybean PKs in the nucleus of plant cells. The coding sequences of six predicted nucleus-localized soybean PKs were fused to the N terminus of eYFP and expressed in onion epidermal cells via biolistic bombardment. YFP fluorescence was localized exclusively to the nucleus. Bar = 100 μM. (This figure is available in colour at JXB online.)
Fig. 6.
Fig. 6.
Heat maps of the expression patterns of soybean PK subfamilies in different tissues and under various biotic and abiotic stress conditions. The expression patterns of 82 PK subfamilies in different tissues (A) and under various biotic and abiotic stress conditions (B) are shown. The heat maps were generated using MeV software, v. 4.9. A colour scale corresponding to upregulation and downregulation is shown. (This figure is available in colour at JXB online.)
Fig. 7.
Fig. 7.
Co-expression networks of soybean PK subfamilies. Two independent co-expression networks were generated using tissue (A) and stress response (B) gene expression data. Nodes indicate subfamilies and edges indicate significant co-expression between subfamilies. Green nodes with blue-coloured edges indicate co-expression events between subfamilies that are common in tissue and stress networks. (This figure is available in colour at JXB online.)

References

    1. Antolín-Llovera M, Ried MK, Binder A, Parniske M. 2012. Receptor kinase signaling pathways in plant–microbe interactions. Annual Review of Phytopathology 50, 451–473. - PubMed
    1. Brameier M, Krings A, MacCallum RM. 2007. NucPred—predicting nuclear localization of proteins. Bioinformatics 23, 1159–1160. - PubMed
    1. Champion A, Kreis M, Mockaitis K, Picaud A, Henry Y. 2004. Arabidopsis kinome: after the casting. Functional and Integrative Genomics 4, 163–187. - PubMed
    1. Chern M, Fitzgerald HA, Canlas PE, Navarre DA, Ronald PC. 2005. Overexpression of a rice NPR1 homolog leads to constitutive activation of defense response and hypersensitivity to light. Molecular Plant–Microbe Interactions 18, 511–520. - PubMed
    1. Colcombet J, Hirt H. 2008. Arabidopsis MAPKs: a complex signalling network involved in multiple biological processes. Biochemical Journal 413, 217–226. - PubMed

Publication types