. 2014:9:4334-4342.
doi: 10.1039/C3RA46839A.

The systematic study of circulating tumor cell isolation using lithographic microfilters

Affiliations

The systematic study of circulating tumor cell isolation using lithographic microfilters

Daniel L Adams et al. RSC Adv. 2014.

Abstract

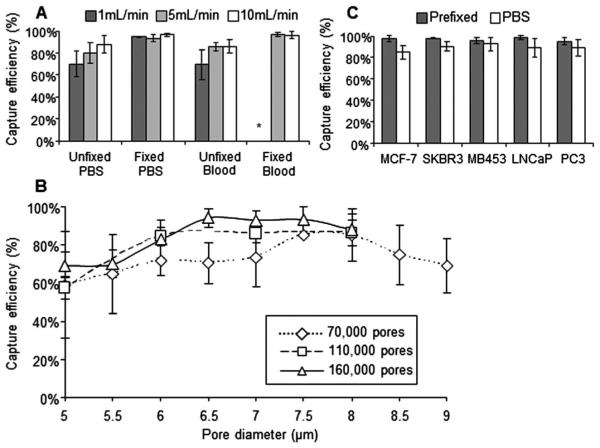
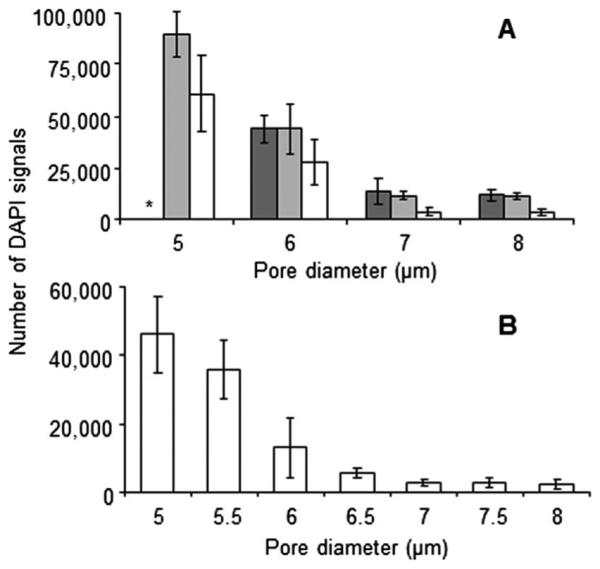
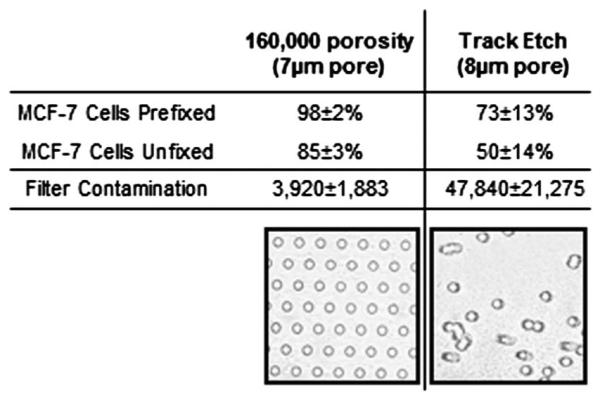
Circulating tumor cells (CTCs) disseminated into peripheral blood from a primary, or metastatic, tumor can be used for early detection, diagnosis and monitoring of solid malignancies. CTC isolation by size exclusion techniques have long interested researchers as a simple broad based approach, which is methodologically diverse for use in both genomic and protein detection platforms. Though a variety of these microfiltration systems are employed academically and commercially, the limited ability to easily alter microfilter designs has hindered the optimization for CTC capture. To overcome this problem, we studied a unique photo-definable material with a scalable and mass producible photolithographic fabrication method. We use this fabrication method to systematically study and optimize the parameters necessary for CTC isolation using a microfiltration approach, followed by a comparison to a "standard" filtration membrane. We demonstrate that properly designed microfilters can capture MCF-7 cancer cells at rate of 98 ± 2% if they consist of uniform patterned distributions, ≥160 000 pores, and 7 μm pore diameters.


Figures

Fig. 1
Fig. 1
Images of the surface of a wafer membrane. (A) A photo of a single wafer batch with 30 fabricated microfilters, a 160 000 pore design and a 7 μm diameter pore opening (left). (B) A scanning electron microscope image (SEM) showing the hexagonal array pattern of the microfilter pores (upper right). (C) Enlarged SEM shows a single round uniform pore (lower right).
Fig. 2
Fig. 2
Capture efficiency experiments. (A) Flow rate and fixation affects capture efficiencies of MCF-7 cells spiked into blood or PBS, either fixed or unfixed. Samples were run at 1 mL min−1 (dark gray), 5 mL min−1 (light gray), or 10 mL min−1 (white) (upper left panel) (n = 3). *All 3 filters clogged with blood clots (B) Capture efficiencies of MCF-7 cells using porosity microfilters designs of 70 000 (diamond), 110 000 (square) or 160 000 (triangle) and pore diameters from 5–9 μm (lower panel, n = 3). (C) Capture efficiency of 5 cell lines using the 160 000 pore design, compared by spiking enumerated cells into blood with Prefixation Buffer (gray), or 1XPBS (white) (upper right panel) (n = 3; ~50 spiked cells).
Fig. 3
Fig. 3
Blood cell contamination experiments. (A) DAPI contamination count after filtering whole human blood are compared using porosity microfilters of 70 000 (dark gray), 110 000 (light gray) or 160 000 (white). From a single blood donor, 7.5 mL whole blood with Prefixation Buffer is filtered, washed and mounted, with DAPI. A fluorescent microscope was used to count DAPI events (upper panel) (n = 5). *White blood cell plaque built up on filter. (B) The 160 000 microfilter design was tested with blood samples from healthy donors (n = 5). Pore diameters from 5–8 μm were compared (lower panel). A contamination plateau was seen at the ~7 μm pore diameter.
Fig. 4
Fig. 4
Capture efficiencies and contamination rates of Track-etch versus 160 000 pore design. Capture efficiency and standard deviation of MCF-7 cells either prefixed or unfixed (PBS) are shown using the 160 000 pore design or the 8 μm Track etch membrane (n = 3). DAPI contamination and standard deviation is compared from a single blood donor. 7.5 mL whole blood with Prefixation Buffer is filtered, washed and mounted with DAPI using the 160 000 pore design or the 8 μm Track etch membrane. Additionally, representative images of either the 160 000 pore array pattern filter or a standard 8 μm Track etch membrane are shown.
Fig. 5
Fig. 5
Cancer cells captured regardless of cell health or protein expression. (A–D) MCF-7 cells pre-stained by Acridine orange and DAPI, filtered and imaged on a microfilter (upper row). (A) DAPI (blue) (B) Acridine Orange (green) (C) Visible light (D) Merged. Cell A-unhealthy late stage apoptotic cell, Cell B-unhealthy early stage apoptotic cell, Cell C-healthy cell. (E–I) Representative of the 5 spiked cell lines using the immunofluorescent assay, high resolution image example of PC-3 cells on a microfilter: (E) merged, (F) DAPI (blue), (G) FITC-Cytokeratin 8, 18, 19 (green) (H) PE-EpCAM (red) and (I) Cy5-CD45 (absent). The left cell has no cytokeratin expression while the right cell has high cytokeratin, microfiltration catches both types.
Fig. 6
Fig. 6
CTCs from a metastatic cancer patient can be identified after filtration. (A–C) Merged image of DAPI (blue), cytokeratin (green), EpCAM (red) and CD45 (magenta) on microfilter after filtration and immunofluorescent assay. CTCs can be easily identified by DAPI and cytokeratin stain presence (A) Under 10× magnification a representative image, from one of the 10 patient samples, of a CTC cluster can be seen by cytokeratin+, DAPI+, CD45-(scale bar,100 μm). (B) Under 40× magnification the CTC cluster can be easily seen and identified (scale bar, 50 μm). (C) Under 40× magnification and image enlarged, detailed cytological structures of the CTC cluster can be easily seen (scale bar, 10 μm). (D) DAPI (blue) and the abnormal chromatin pattern associated with cancerous cells are seen (scale bar, 10 μm). (E) Cytokeratin is identified with a filamentous stain pattern (scale bar, 10 μm). (F) EpCAM of these CTCs is either negative or below the threshold of the assay, antibody capture systems would likely not capture this cell (scale bar, 10 μm). (G) CD45 is negative in these CTCs, this is the standard negative control marker used for CTC identification (scale bar, 10 μm).

Similar articles

Cited by

References

    1. Allard WJ, Matera J, Miller MC, Repollet M, Connelly MC, Rao C, Tibbe AG, Uhr JW, Terstappen LW. Clin. Cancer Res. 2004;10:6897–6904. - PubMed
    1. Cohen SJ, Punt CJ, Iannotti N, Saidman BH, Sabbath KD, Gabrail NY, Picus J, Morse M, Mitchell E, Miller MC, Doyle GV, Tissing H, Terstappen LW, Meropol NJ. J. Clin. Oncol. 2008;26:3213–3221. - PubMed
    1. Cristofanilli M, Budd GT, Ellis MJ, Stopeck A, Matera J, Miller MC, Reuben JM, Doyle GV, Allard WJ, Terstappen LW, Hayes DF. N. Engl. J. Med. 2004;351:781–791. - PubMed
    1. Hou JM, Krebs MG, Lancashire L, Sloane R, Backen A, Swain RK, Priest LJ, Greystoke A, Zhou C, Morris K, Ward T, Blackhall FH, Dive C. J. Clin. Oncol. 2012;30:525–532. - PubMed
    1. Lianidou ES, Markou A. Clin. Chem. Lab. Med. 2011;49:1579–1590. - PubMed