

rre37 Overexpression alters gene expression related to the tricarboxylic acid cycle and pyruvate metabolism in Synechocystis sp. PCC 6803
- PMID: 25614900
- PMCID: PMC4295605
- DOI: 10.1155/2014/921976
rre37 Overexpression alters gene expression related to the tricarboxylic acid cycle and pyruvate metabolism in Synechocystis sp. PCC 6803
Abstract
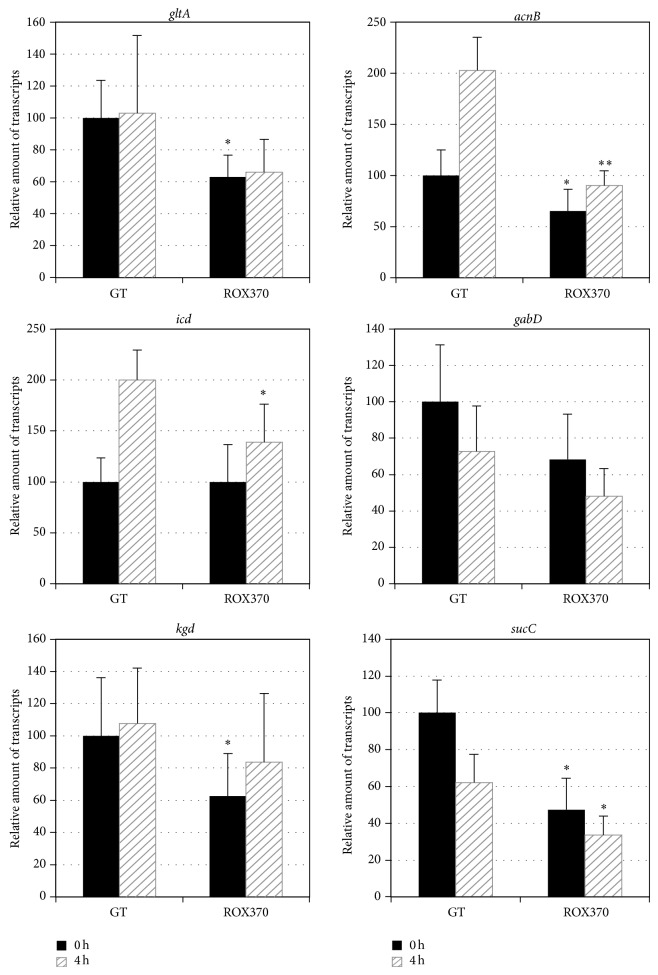
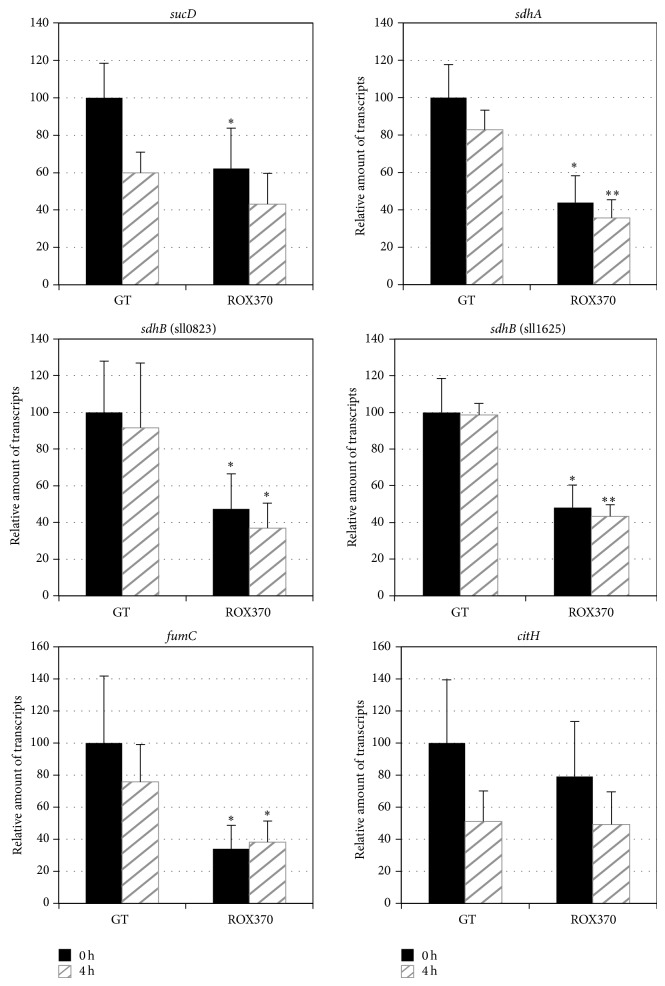
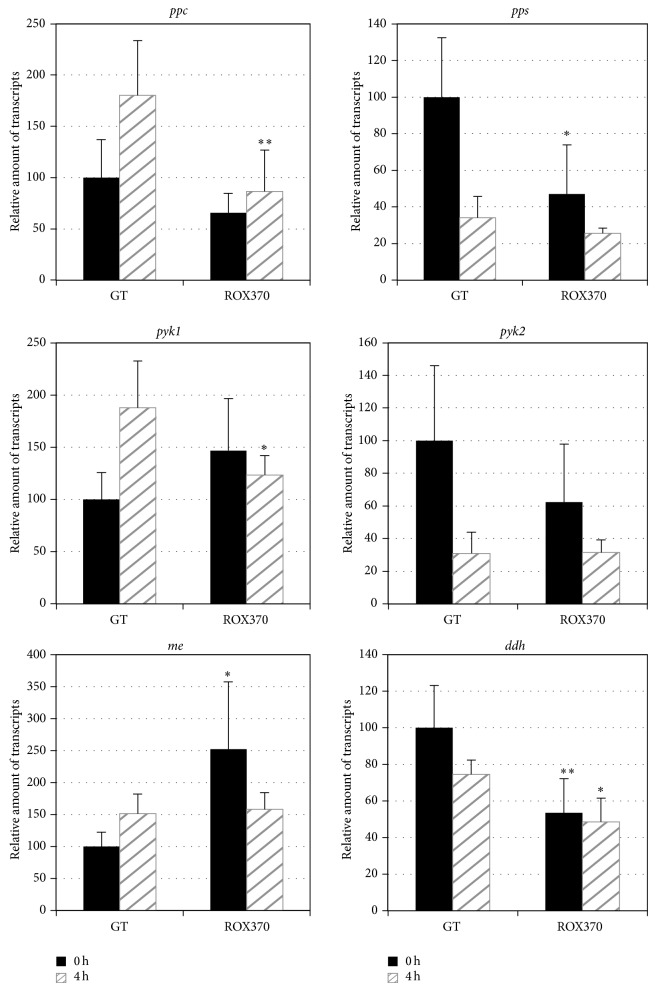
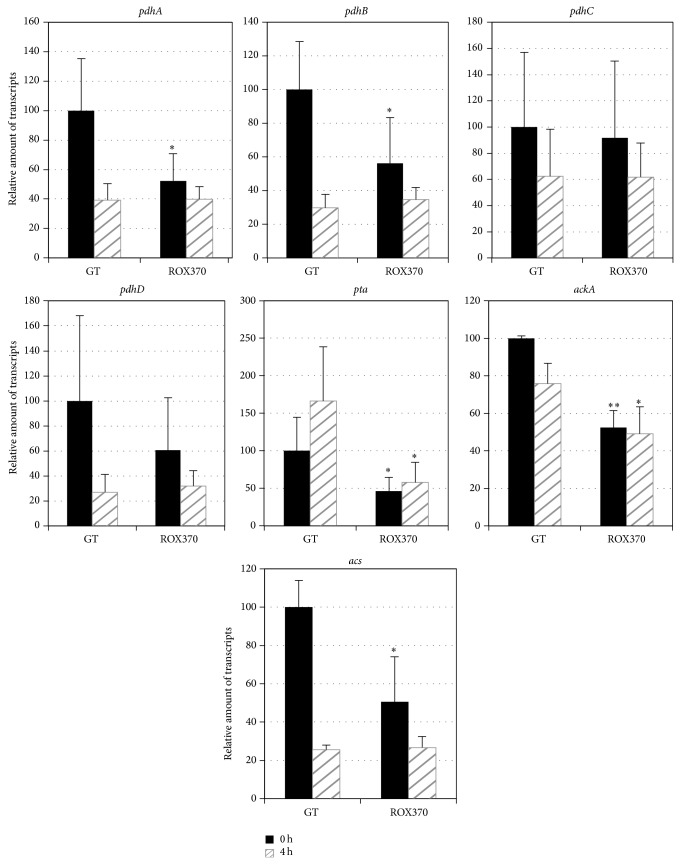
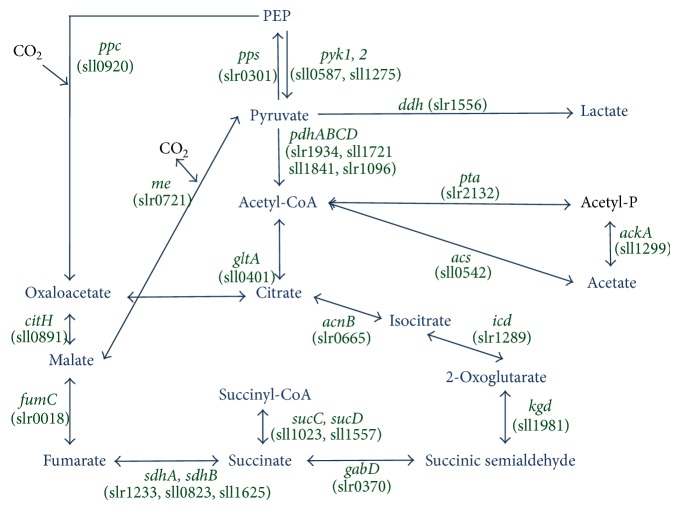
The tricarboxylic acid (TCA) cycle and pyruvate metabolism of cyanobacteria are unique and important from the perspectives of biology and biotechnology research. Rre37, a response regulator induced by nitrogen depletion, activates gene expression related to sugar catabolism. Our previous microarray analysis has suggested that Rre37 controls the transcription of genes involved in sugar catabolism, pyruvate metabolism, and the TCA cycle. In this study, quantitative real-time PCR was used to measure the transcript levels of 12 TCA cycle genes and 13 pyruvate metabolism genes. The transcripts of 6 genes (acnB, icd, ppc, pyk1, me, and pta) increased after 4 h of nitrogen depletion in the wild-type GT strain but the induction was abolished by rre37 overexpression. The repression of gene expression of fumC, ddh, and ackA caused by nitrogen depletion was abolished by rre37 overexpression. The expression of me was differently affected by rre37 overexpression, compared to the other 24 genes. These results indicate that Rre37 differently controls the genes of the TCA cycle and pyruvate metabolism, implying the key reaction of the primary in this unicellular cyanobacterium.
Figures
Similar articles
-
One day of nitrogen starvation reveals the effect of sigE and rre37 overexpression on the expression of genes related to carbon and nitrogen metabolism in Synechocystis sp. PCC 6803.J Biosci Bioeng. 2015 Aug;120(2):128-34. doi: 10.1016/j.jbiosc.2014.12.020. Epub 2015 Jan 29. J Biosci Bioeng. 2015. PMID: 25641577
-
Rre37 stimulates accumulation of 2-oxoglutarate and glycogen under nitrogen starvation in Synechocystis sp. PCC 6803.FEBS Lett. 2014 Jan 31;588(3):466-71. doi: 10.1016/j.febslet.2013.12.008. Epub 2013 Dec 24. FEBS Lett. 2014. PMID: 24374346
-
Pathway-level acceleration of glycogen catabolism by a response regulator in the cyanobacterium Synechocystis species PCC 6803.Plant Physiol. 2014 Apr;164(4):1831-41. doi: 10.1104/pp.113.232025. Epub 2014 Feb 12. Plant Physiol. 2014. PMID: 24521880 Free PMC article.
-
A response regulator Rre37 and an RNA polymerase sigma factor SigE represent two parallel pathways to activate sugar catabolism in a cyanobacterium Synechocystis sp. PCC 6803.Plant Cell Physiol. 2011 Feb;52(2):404-12. doi: 10.1093/pcp/pcq204. Epub 2011 Jan 6. Plant Cell Physiol. 2011. PMID: 21216748
-
Understanding Sugar Catabolism in Unicellular Cyanobacteria Toward the Application in Biofuel and Biomaterial Production.Subcell Biochem. 2016;86:511-23. doi: 10.1007/978-3-319-25979-6_20. Subcell Biochem. 2016. PMID: 27023248 Review.
Cited by
-
Regulatory Diversity and Functional Analysis of Two-Component Systems in Cyanobacterium Synechocystis sp. PCC 6803 by GC-MS Based Metabolomics.Front Microbiol. 2020 Mar 17;11:403. doi: 10.3389/fmicb.2020.00403. eCollection 2020. Front Microbiol. 2020. PMID: 32256471 Free PMC article.
-
Pyruvate kinase 2 from Synechocystis sp. PCC 6803 increased substrate affinity via glucose-6-phosphate and ribose-5-phosphate for phosphoenolpyruvate consumption.Plant Mol Biol. 2024 May 17;114(3):60. doi: 10.1007/s11103-023-01401-0. Plant Mol Biol. 2024. PMID: 38758412 Free PMC article.
References
-
- Kaneko T., Sato S., Kotani H., et al. Sequence analysis of the genome of the unicellular cyanobacterium synechocystis sp. strain PCC6803. II. Sequence determination of the entire genome and assignment of potential protein-coding regions. DNA Research. 1996;3(3):109–136. doi: 10.1093/dnares/3.3.109. - DOI - PubMed
-
- Muro-Pastor M. I., Reyes J. C., Florencio F. J. Cyanobacteria perceive nitrogen status by sensing intracellular 2-oxoglutarate levels. The Journal of Biological Chemistry. 2001;276(41):38320–38328. - PubMed
-
- Tanigawa R., Shirokane M., Maeda S.-I., Omata T., Tanaka K., Takahashi H. Transcriptional activation of NtcA-dependent promoters of Synechococcus sp. PCC 7942 by 2-oxoglutarate in vitro . Proceedings of the National Academy of Sciences of the United States of America. 2002;99(7):4251–4255. doi: 10.1073/pnas.072587199. - DOI - PMC - PubMed
Publication types
MeSH terms
Substances
LinkOut - more resources
Full Text Sources
Other Literature Sources
Research Materials
Miscellaneous
