. 2015 Jan 23:6:6072.
doi: 10.1038/ncomms7072.

An IL-27/NFIL3 signalling axis drives Tim-3 and IL-10 expression and T-cell dysfunction

Affiliations

An IL-27/NFIL3 signalling axis drives Tim-3 and IL-10 expression and T-cell dysfunction

Chen Zhu et al. Nat Commun. .

Erratum in

Abstract

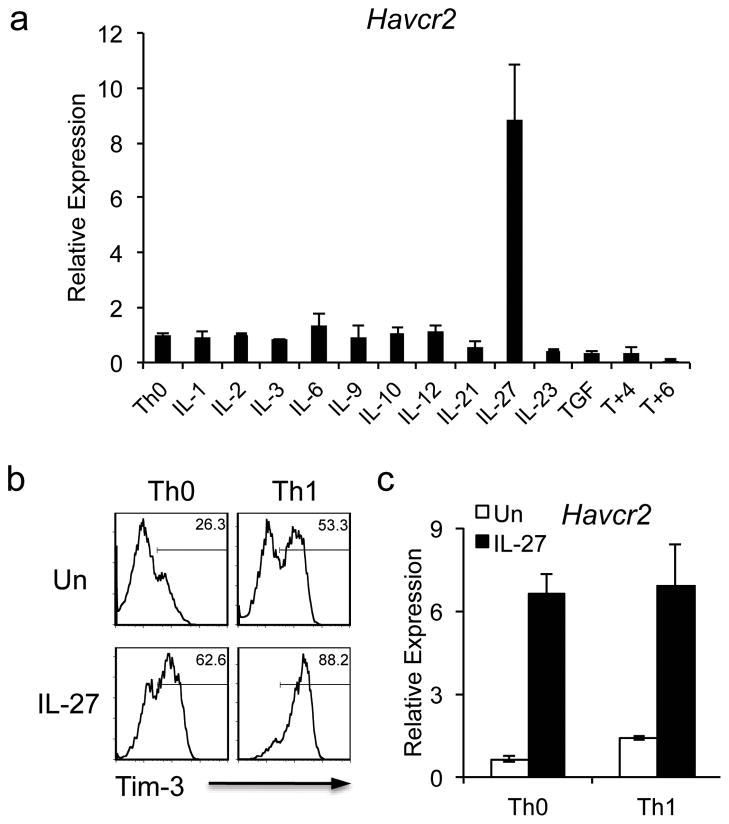
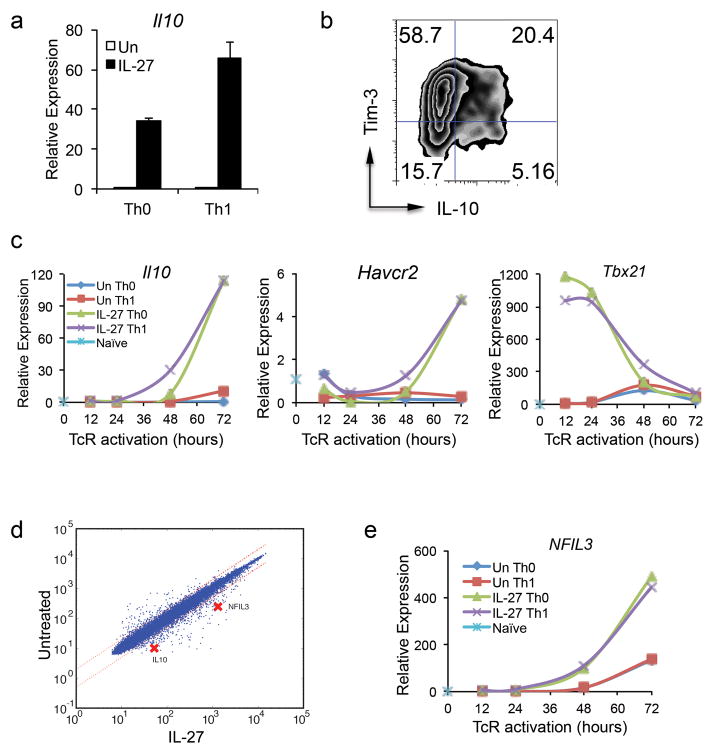
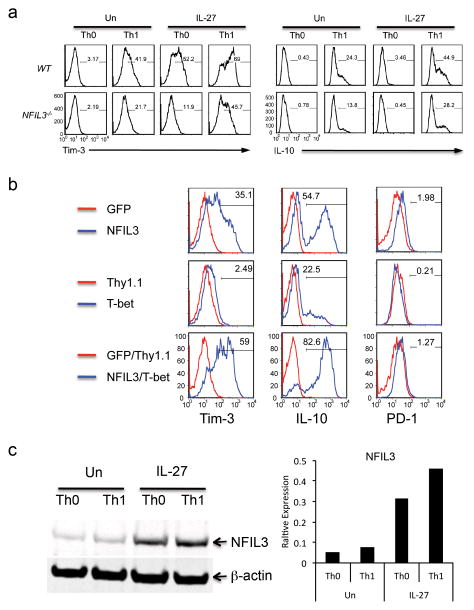
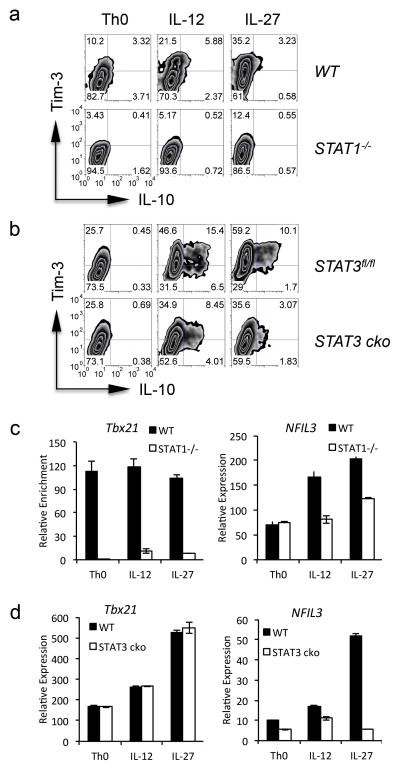
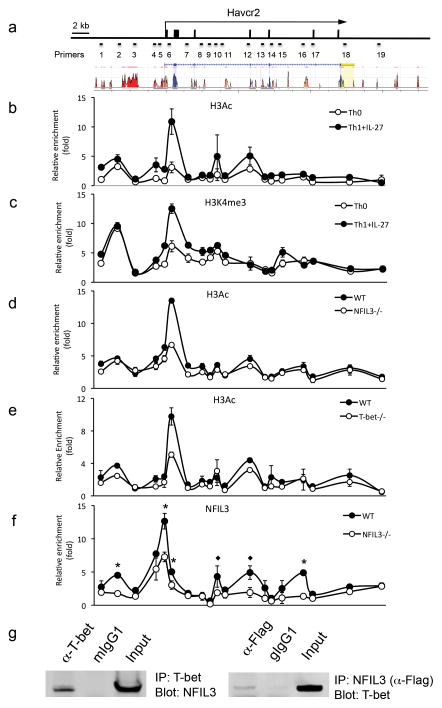
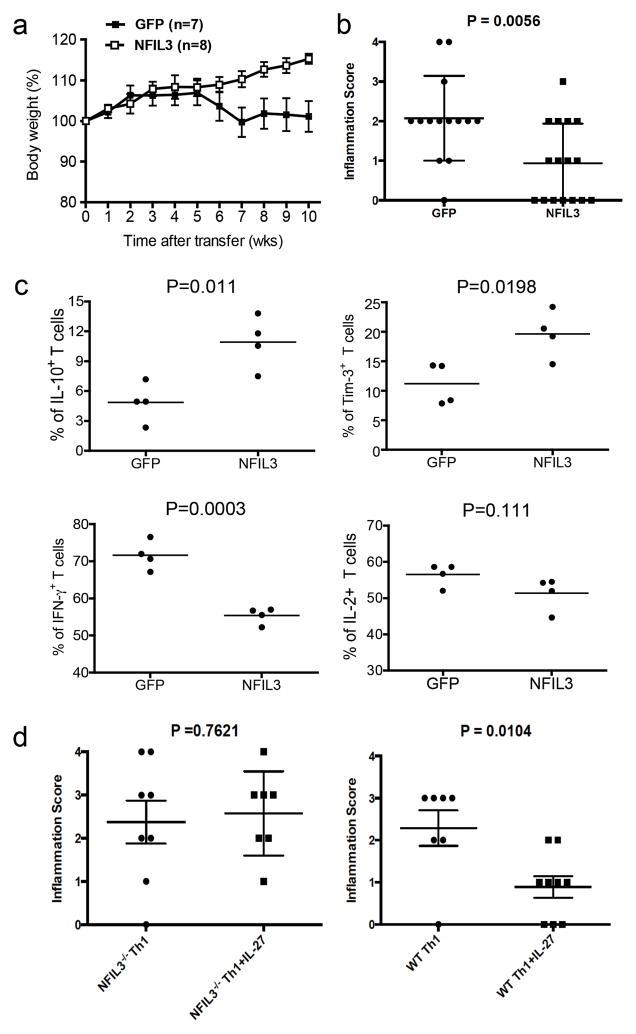
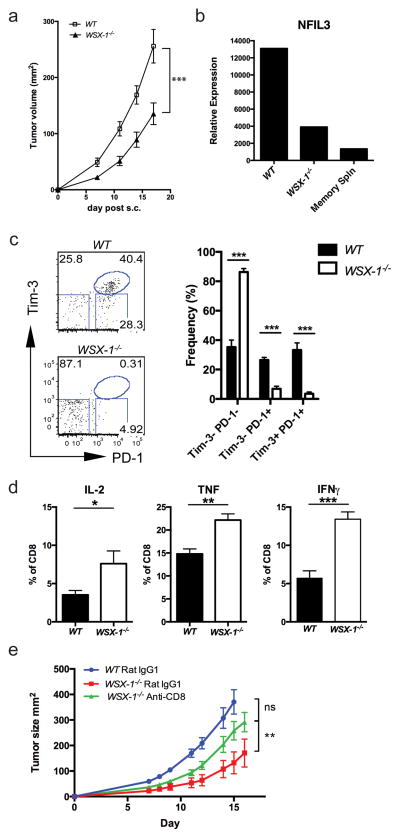
The inhibitory receptor T-cell immunoglobulin and mucin domain-3 (Tim-3) has emerged as a critical regulator of the T-cell dysfunction that develops in chronic viral infections and cancers. However, little is known regarding the signalling pathways that drive Tim-3 expression. Here, we demonstrate that interleukin (IL)-27 induces nuclear factor, interleukin 3 regulated (NFIL3), which promotes permissive chromatin remodelling of the Tim-3 locus and induces Tim-3 expression together with the immunosuppressive cytokine IL-10. We further show that the IL-27/NFIL3 signalling axis is crucial for the induction of Tim-3 in vivo. IL-27-conditioned T helper 1 cells exhibit reduced effector function and are poor mediators of intestinal inflammation. This inhibitory effect is NFIL3 dependent. In contrast, tumour-infiltrating lymphocytes from IL-27R(-/-) mice exhibit reduced NFIL3, less Tim-3 expression and failure to develop dysfunctional phenotype, resulting in better tumour growth control. Thus, our data identify an IL-27/NFIL3 signalling axis as a key regulator of effector T-cell responses via induction of Tim-3, IL-10 and T-cell dysfunction.


Conflict of interest statement

Conflict of Interest Statement

VKK and ACA are paid consultants for Novartis Pharmaceuticals, which has interests in cancer immunotherapy. All other authors declare no competing financial interests.

Figures

Figure 1
Figure 1
IL-27 induces Tim-3 expression. (a) Naïve CD4 T cells were activated by anti-CD3 and anti-CD8 antibodies in the presence of different cytokines. 72 hours after activation, cells were harvested for quantitative PCR analysis of Tim-3 (Havcr2) transcription. Havcr2 expression was normalized to that of β-actin. (b) and (c) Naïve CD4+ T cells were activated with anti-CD3 and anti-CD28 antibodies under neutral (Th0) or Th1 (IL-12 treatment) conditions with or without IL-27. To analyze Tim-3 protein expression, the cells were restimulated with anti-CD3 and anti-CD28 antibodies on day 5 for 24 hours before examination of Tim-3 expression by flow cytometry (c). The transcription of Tim-3 (Havcr2) was examined by quantitative PCR (qPCR) 72 hours after activation (b). Data are representative of at least 3 independent experiments with similar results (a, b: mean ± s.d.).
Figure 2
Figure 2
An IL-27-induced NFIL3 and T-bet regulate the expression of both Tim-3 and IL-10. Naïve CD4+ T cells were differentiated under Th0 or Th1 (by IL-12 treatment) condition with or without IL-27. (a) IL-10 (Il10) mRNA expression was detected by qPCR 72 hours after TcR activation (mean± s.d.). (b) To detect Tim-3 and IL-10 co-expression in IL-27-treated Th1 cells, the cells were restimulated with anti-CD3 and anti-CD28 antibodies on day 5 after TcR activation for 24 hours before subjected to flow cytometry analysis. (c) and (e) Naïve CD4+ T cells were activated with anti-CD3 and anti-CD28 antibodies under Th0 or Th1 culture condition with or without IL-27. RNA was isolated at 12, 24, 48, and 72 hours after TcR activation for qPCR to determine the expression kinetics of IL-10, Tim-3, T-bet (Tbx21), and NFIL3. Data are representative of at least 3 independent experiments with similar results. (d) Gene profile studies. Naïve CD4+ T cells from C57BL/6 mice were stimulated with anti-CD3 and anti-CD28 antibodies in the presence of IL-27 for 60 hours. The cells were subjected to gene profile analysis. The scatter plot represents comparative transcriptome analysis between cells under neutral culture condition and cells treated with IL-27.
Figure 3
Figure 3
IL-27-mediated Tim-3 expression is dependent on the functional cooperation between T-bet and NFIL3. (a) Naïve CD4+ T cells from wild type (WT) C56BL/6 mice and NFIL3−/− mice were activated with anti-CD3 and anti-CD28 under Th0 or Th1 (IL-12 treatment) condition with or without IL-27. Five days after TcR activation, cells were restimulated with anti-CD3 and anti-CD28 for 24 hours and subjected to detection of the expression of Tim-3 and IL-10 by flow cytometry. (b) Naïve CD4+ T cells were transduced with retrovirus carrying NFIL3 cDNA (NFIL3), T-bet cDNA (T-bet), or both NFIL3 and T-bet. Retrovirus empty vector-transduced T cells were used as controls (GFP for NFIL3, Thy1.1 for T-bet). Four days after TcR activation, the expression of Tim-3, IL-10 and PD-1 was examined by flow cytometry. The percentage represents the expression of Tim-3, IL-10, or PD-1 in NFIL3- or T-bet-transduced, or NFIL3/T-bet-cotransduced cells relative to GFP- or Thy1.1-expressing empty vector-transduced, or GFP/Thy1.1 empty vector-cotransduced cells respectively. (c) Naïve CD4+ T cells were activated by anti-CD3 and anti-CD28 under Th0 and Th1 condition (IL-12 treatment) with or without IL-27. Three days after TcR activation, the expression of NFIL3 expression was detected by Western blot (left) and its relative expression to β-actin was quantified by LI-COR Odyssey Imaging System (right). Data are representative of at least 3 independent experiments with similar results.
Figure 4
Figure 4
STAT1/T-bet and STAT3/NFIL3 mediate IL-27-induced Tim-3, and IL-10, expression. (a) and (b) Naïve CD4+ T cells purified from STAT1−/− mice (STAT1−/−) (a) or STAT3fl/fl x CD4-Cre mice (STAT3 cko) (b) and their wild type littermates (WT for STAT1−/− and STAT3fl/fl for STAT3 cko) were activated with anti-CD3 and anti-CD28 antibodies under neutral (Th0) condition, or under the stimulation of IL-12 or IL-27. Five days after activation, the cells were restimulated by anti-CD3 and anti-CD28 for 24 hours and were subjected to the detection of Tim-3 and IL-10 by flow cytometry. (c) and (d) Naïve CD4+ T cells as described in (a) and (b) were stimulated with anti-CD3 and anti-CD28 antibodies for 72 hours and were subjected to qPCR analysis for the transcription of T-bet (Tbx21) and NFIL3. The expression was normalized to the β-actin. Data are representative of at least 2 independent experiments with similar results (a, b: mean ± s.d.).
Figure 5
Figure 5
IL-27-induced permissive chromatin modification in the Tim-3 locus is both NFIL3 and T-bet dependent. (a) Mouse Tim-3 locus and the location of PCR primers for ChIP-qPCR analysis. The histogram represent CNSs which stand for 70% or greater identity over at least 100 bp stretches of the genomic DNA sequences between human and mouse Tim-3 locus (Blue: coding exons, red: intergenic regions; Orange: intronic regions; yellow: UTRs). ChIP PCR primers were marked according to their relative location in the Tim-3 locus (b) and (c) Naïve CD4+ T cells from C57BL/6 mice were activated by anti-CD3 and anti-CD28 antibodies under Th0 or IL-27-treated Th1 condition. The cells were restimulated on day 5 for 24 hours and were subjected to ChIP-qPCR for detection of H3Ac (b) and H3K4me3 (c) enrichment in the Tim-3 locus. (d) and (e) In a similar experimental setting, H3Ac enrichment in the Tim-3 locus was examined in NFIL3−/− CD4+ T cells and T-bet−/− CD4+ T cells. (f) NFIL3−/− and WT CD4+ T cells were activated by anti-CD3 and anti-CD28 antibodies under Th1 culture condition in the presence of IL-27. Four days after T cell activation, the cells were subjected to ChIP-qPCR to analyze NFIL3 enrichment in the Tim-3 locus. NFIL3 enriched areas marked with * represent the potential NFIL3 binding sites in both human and mouse homologous sequences, whereas those marked with ◆ represent the potential NFIL3 binding sites only in mouse sequences. (g) Expression plasmids for NFIL3 and T-bet were transiently transfected into 293T cells. Whole cell lysates were harvested 48 hours after transfection for co-IP to detect the interaction between NFIL3 and T-bet. Data are representative of at least 2 independent experiments with similar results (a, b, c, d, and e: mean ± s.d.).
Figure 6
Figure 6
Ectopic expression of NFIL3 in CD4+ T cells attenuates gut pathology in adoptively transferred enteritis/colitis. Naïve CD4+ T cells from C57BL/6 mice were transduced with NFIL3-expressing retrovirus (NFIL3) or control empty retrovirus (GFP). Cells were injected i.p. into Rag1−/− recipient mice to induce gut inflammation (0.7 × 10⁷ cells/mouse). (a) Wasting disease was monitored for 10 weeks after transfer. Statistical analysis was performed on the combination of total animals from two independent experiments. Data are shown as mean ± SEM. Mann Whitney test two-tailed P=0.0064. (b) Immunopathology of gut inflammation. Two randomly selected tissue sections from each animal were graded for crypt damage and T cell infiltration. Two scores were given to each animal to represent the overall gut immunopathology. Data are shown as mean ± SEM. Unpaired t test two-tailed P=0.0056. (c) The recipient mice were sacrificed 6 weeks after T cell transfer for ex vivo analysis of cytokine production (IL-2, IL-10, and IFN-γ) and Tim-3 expression by flow cytometry. (d) Naïve CD4+ T cells from WT FoxP3-GFP KI and NFIL3−/− x FoxP3-GFP KI mice (CD4+CD62L+GFP) were differentiated into Th1 cells with or without the presence of IL-27. On day 6, GFP+ (FoxP3+) cells were isolated by cell sorting and were injected i.p. into Rag1−/− recipients to induce colitis. Colon pathology was analyzed 8 weeks after transfer. Each score represents the pathology from one recipient mouse (NFIL3−/− Th1 n=8; NFIL3−/− Th1+IL-27 n=7; WT Th1 n=7; WT Th1+IL-27 n=9. Data are shown as mean ± SEM, t test).
Figure 7
Figure 7
IL-27R deficient mice (WSX-1−/−) are resistant to tumor growth. (a) B16F10 melanoma cells were implanted into C57BL/6 (WT) and WSX-1−/− mice and tumor growth was monitored in two dimensions by caliper as the product of two perpendicular diameters. Statistics was based on combination of total animals from two independent experiments (WT: n=16; WSX-1−/−: n=14. Data are shown as mean ± SEM, P<0.0001, linear regression). (b) Tumor-infiltrating lymphoctyes (TILs) from these mice were isolated and were subjected to RT-qPCR analysis for NFIL3 expression. (c) The expression of Tim-3 and PD-1 on CD8+ TILs from WT (n=5) and WSX-1−/− (n=5) recipient tumor-bearing mice was determined by flow cytometry. Tim-3PD-1: P<0.0001; Tim-3PD-1+: P<0.0001; Tim-3+PD-1+: P=0.0004, t test. (d) Production of IL-2, IFN-γ and TNF from peripheral CD8+ T cells from WT and WSX-1−/− mice was determined by flow cytometry. Data are representative of at least 2 independent experiments with similar results (b, c, and d: mean ± SEM. IL-2: P=0.013; TNF: P=0.0012; IFNγ: P=0.0002, t test). (e) WT and WSX-1−/− mice were implanted with 5×10⁵ B16F10 tumor cells. On days 1, 2, 8, and 9, 100 μg of anti-CD8 antibody (53–5.8) or Rat IgG1 was injected i.p.. Tumor growth was monitored in two dimensions by caliper. (WT: n=9; WSX-1−/− Rat IgG1: n=7; WSX-1−/− Anti-CD8: n=9. P=0.0021, linear regression)

Similar articles

Cited by

References

    1. Monney L, et al. Th1-specific cell surface protein Tim-3 regulates macrophage activation and severity of an autoimmune disease. Nature. 2002;415:536–541. - PubMed
    1. Zhu C, et al. The Tim-3 ligand galectin-9 negatively regulates T helper type 1 immunity. Nature immunology. 2005;6:1245–1252. - PubMed
    1. Jones RB, et al. Tim-3 expression defines a novel population of dysfunctional T cells with highly elevated frequencies in progressive HIV-1 infection. The Journal of experimental medicine. 2008;205:2763–2779. - PMC - PubMed
    1. McMahan RH, et al. Tim-3 expression on PD-1+ HCV-specific human CTLs is associated with viral persistence, and its blockade restores hepatocyte-directed in vitro cytotoxicity. J Clin Invest. 2010;120:4546–4557. - PMC - PubMed
    1. Jin HT, et al. Cooperation of Tim-3 and PD-1 in CD8 T-cell exhaustion during chronic viral infection. Proceedings of the National Academy of Sciences of the United States of America. 2010;107:14733–14738. - PMC - PubMed

Publication types

MeSH terms