. 2015 Apr 1:109:469-79.
doi: 10.1016/j.neuroimage.2015.01.005. Epub 2015 Jan 20.

Cortical structural abnormalities in very preterm children at 7 years of age

Affiliations

Cortical structural abnormalities in very preterm children at 7 years of age

Yuning Zhang et al. Neuroimage. .

Abstract

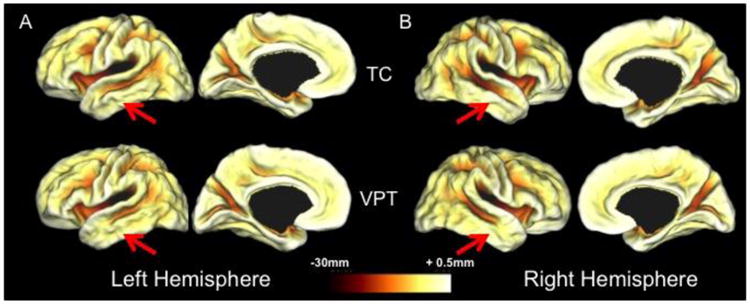
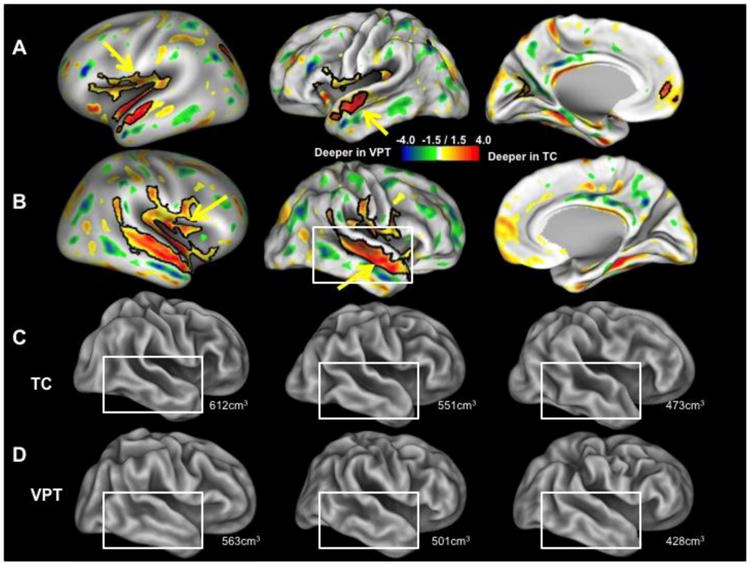
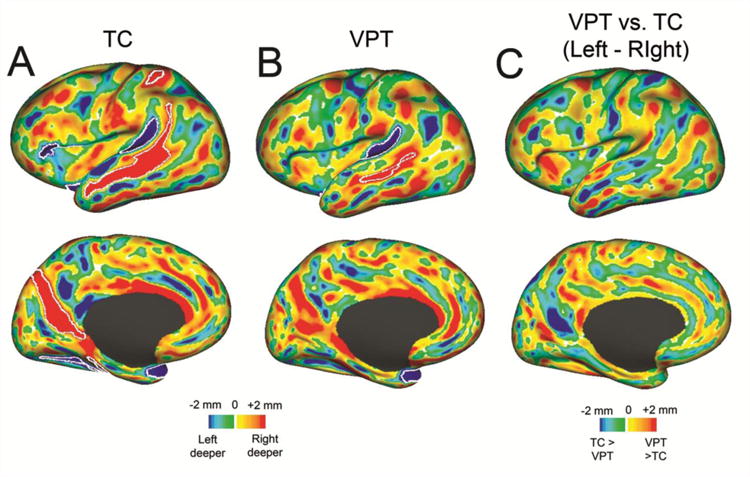
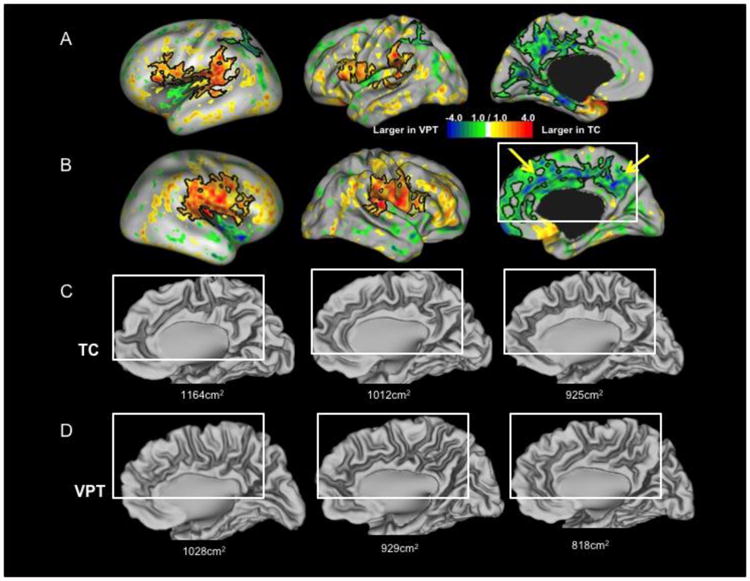
We analyzed long-lasting alterations in brain morphometry associated with preterm birth using volumetric and surface-based analyses applied to children at age 7 years. Comparison of 24 children born very preterm (VPT) to 24 healthy term-born children revealed reductions in total cortical gray matter volume, white matter volume, cortical surface area and gyrification index. Regional cortical shape abnormalities in VPT children included the following: shallower anterior superior temporal sulci, smaller relative surface area in the inferior sensori-motor cortex and posterior superior temporal cortex, larger relative surface area and a cingulate sulcus that was shorter or more interrupted in medial frontoparietal cortex. These findings indicate a complex pattern of regional vulnerabilities in brain development that may contribute to the diverse and long-lasting neurobehavioral consequences that can occur after very premature birth.

Keywords: Cortical surface; Folding; MRI; Relative surface area; Structural abnormality; Very preterm; Volume.


Figures

Figure 1
Figure 1
Average midthickness surfaces of left (A) and right (B) hemispheres for TC and VPT children with average sulcal depth maps overlaid. The color bar shows the scale of the sulcal depths in mm. The most obvious structural differences based on visual inspection were found in the anterior portion of the superior temporal sulcus in both hemispheres (red arrows), which are shallower in VPT-born children.
Figure 2
Figure 2
Group differences in sulcal depth. The top two rows show sulcal depth t-maps of the left (A) and right (B) hemispheres generated by a two-sample t-test comparing the surfaces of 24 VPT and 24 TC children. In the left panels of these two rows, the t-maps are overlaid on the inflated average surfaces of the 48 subjects in this study. In the middle and right panels, the t-maps are overlaid on the average midthickness cortical surfaces. The black contours outline regions that are statistically different (p<0.05) using TFCE. The bottom two rows show lateral views of the inflated right hemispheres of individuals from the TC (C) and VPT (D) groups. In each of these two rows, the left panel shows the individual with the largest total brain volume in its population, the middle panel shows the individual closest to the population mean, and the right panel shows the individual with the smallest total brain volume (total brain volume is labeled on the right corner of each surface). White boxes delineate the approximate region having a visible sulcal depth difference between groups.
Figure 3
Figure 3
Sulcal Depth Asymmetry Analysis. A. Lateral (top) and medial (bottom) sulcal depth t-maps (left-right) for the TC group. Red=right deeper; blue=left deeper. White borders encircle vertices that exceeded the 95th percentile on the paired t-test (TFCE). B. Corresponding panels for the VPT infants. There are more significant clusters in the TC group than the VPT group. The cluster in the superior temporal sulcus of TC (7742 mm2) is larger than that of VPT (2345 mm2), but this difference is not statistically significant C. The t-map resulting from a two sample t-test between the VPT and TC left-right differences. Red=VPT.left-right>TC.left-right; blue=TC.left-right>VPT.left-right. No vertices survived TFCE thresholding.
Figure 4
Figure 4
Relative surface area t-maps of the left (A) and right (B) hemispheres generated by a two-sample t-test comparing the cortical surfaces of 24 VPT and 24 TC children. The t-maps are overlaid on the inflated surface of the average cortical surfaces of the 48 subjects (left panel) and the average midthickness cortical surface of the 48 subjects in this study (middle and right panels). The black contours outline regions that are statistically different (p<0.05) using TFCE. The bottom two rows show the medial cortex of the right hemispheres of TC (C) and VPT (D) children. Surfaces from the individuals in each group with the lowest CSA are shown in the left panel, surfaces from those with CSA closest to the mean are shown in the center panel, and surfaces from those with the highest CSA are shown in the right panel (CSA is labeled on the bottom of each surface). White boxes show the approximate region of visible differences between TC and VPT subjects.
Figure 5
Figure 5
Abnormal sulcal patterns in medial fronto-parietal cortex. (A) The medial fronto-parietal region of interest is highlighted (green) on the average fiducial surface of the TC and VPT children. (B and C) Skeletons of all sulci (left) and the longest sulcus (right) within the medial fronto-parietal cortex of surfaces from TC (panel B) and VPT (panel C) children were projected onto their respective average midthickness surfaces (surfaces not shown). Red arrows indicate regions that show discernible group differences.

References

    1. Aeby A, Van Bogaert P, David P, Balériaux D, Vermeylen D, Metens T, De Tiège X. Nonlinear microstructural changes in the right superior temporal sulcus and lateral occipitotemporalgyrus between 35 and 43 weeks in the preterm brain. Neuroimage. 2012;63:104–110. - PubMed
    1. Ajayi-Obe M, Saeed N, Cowan FM, Rutherford MA, Edwards AD. Reduced development of cerebral cortex in extremely preterm infants. Lancet. 2000;356:1162–1163. - PubMed
    1. Amin SB, Prinzing D, Myers G. Hyperbilirubinemia and language delay in premature infants. Pediatrics. 2009;123:327–331. - PMC - PubMed
    1. Anticevic A, Repovs G, Dierker DL, Harwell JW, Coalson TS, Barch DM, Van Essen DC. Automated landmark identification for human cortical surface-based registration. Neuroimage. 2012;59:2539–2547. - PMC - PubMed
    1. Ball G, Boardman JP, Rueckert D, Aljabar P, Arichi T, Merchant N, Gousias IS, Edwards AD, Counsell SJ. The effect of preterm birth on thalamic and cortical development. Cereb Cortex. 2012;22:1016–1024. - PMC - PubMed

Publication types

LinkOut - more resources