. 2015 Jan 23:6:6094.
doi: 10.1038/ncomms7094.

Site- and allele-specific polycomb dysregulation in T-cell leukaemia

Affiliations

Site- and allele-specific polycomb dysregulation in T-cell leukaemia

Jean-Marc Navarro et al. Nat Commun. .

Abstract

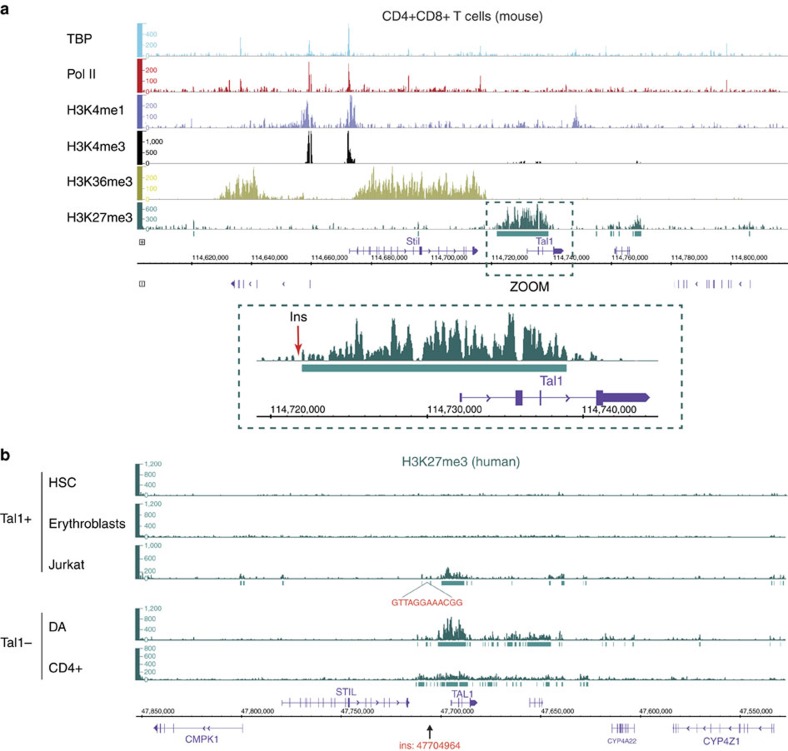
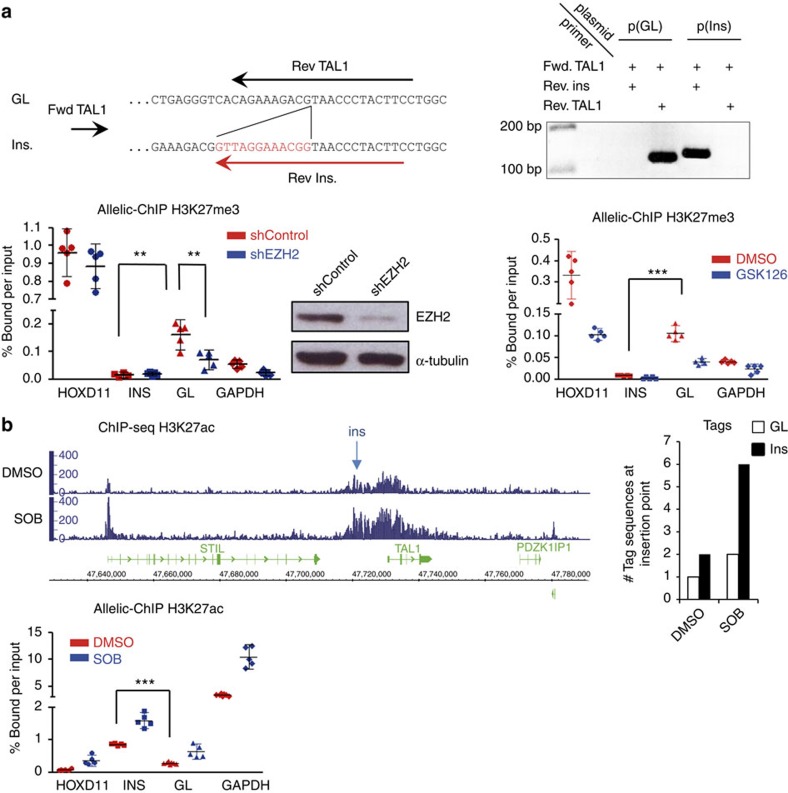
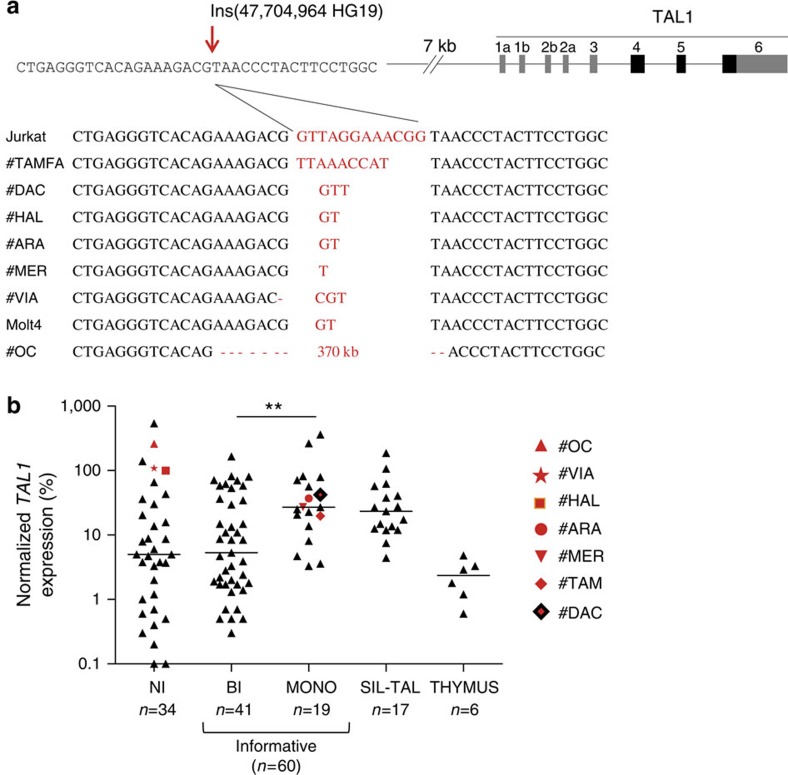
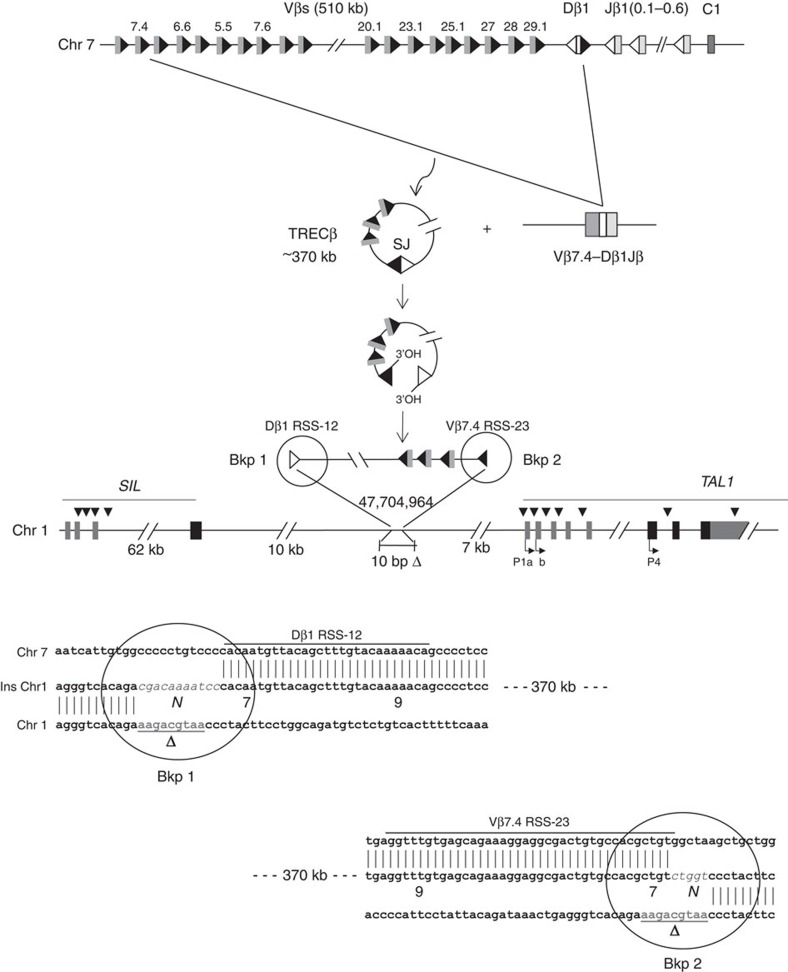
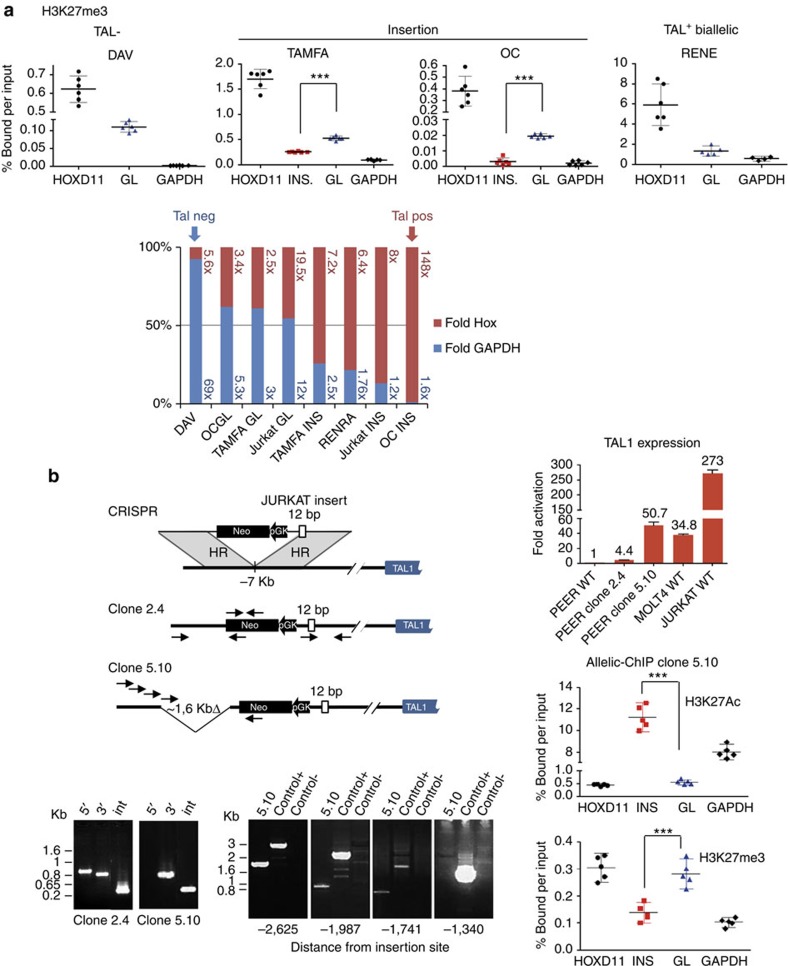
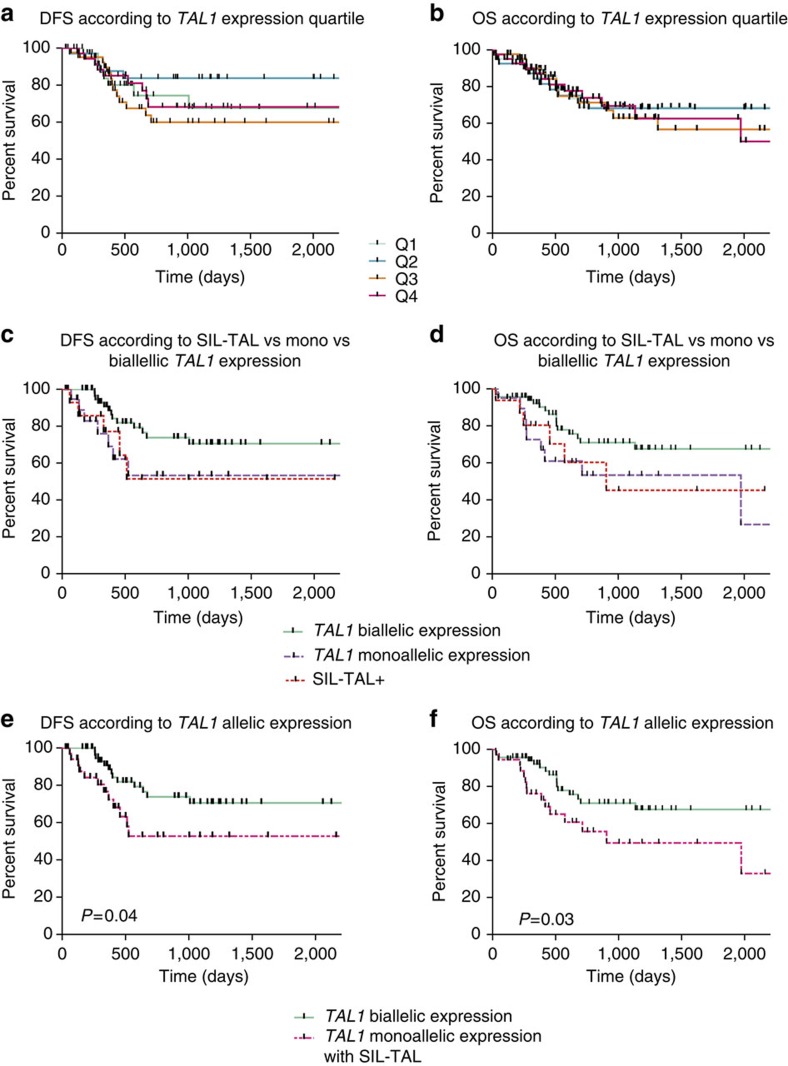
T-cell acute lymphoblastic leukaemias (T-ALL) are aggressive malignant proliferations characterized by high relapse rates and great genetic heterogeneity. TAL1 is amongst the most frequently deregulated oncogenes. Yet, over half of the TAL1(+) cases lack TAL1 lesions, suggesting unrecognized (epi)genetic deregulation mechanisms. Here we show that TAL1 is normally silenced in the T-cell lineage, and that the polycomb H3K27me3-repressive mark is focally diminished in TAL1(+) T-ALLs. Sequencing reveals that >20% of monoallelic TAL1(+) patients without previously known alterations display microinsertions or RAG1/2-mediated episomal reintegration in a single site 5' to TAL1. Using 'allelic-ChIP' and CrispR assays, we demonstrate that such insertions induce a selective switch from H3K27me3 to H3K27ac at the inserted but not the germline allele. We also show that, despite a considerable mechanistic diversity, the mode of oncogenic TAL1 activation, rather than expression levels, impact on clinical outcome. Altogether, these studies establish site-specific epigenetic desilencing as a mechanism of oncogenic activation.


Figures

Figure 1
Figure 1. ChIP-seq analysis of the TAL1 locus in TAL1-expressing and TAL1-repressed cells.
(a) ChIP-seq profiles of chromatin marks in normal mouse CD4+CD8+ thymocytes. The TAL1 genomic area on chromosome 4 (including the adjacent STIL gene, which is physiologically expressed at that developmental stage) is shown for TATA-binding protein-GTF recruited to promoters (TBP), Polymerase II (Pol II), H3K4me1 (active chromatin mark for enhancer/regulatory regions), H3K4me3 (active chromatin marks for promoters), H3K36me3 (active chromatin marks for gene bodies) and H3K27me3 (repressive chromatin mark dependent on the PcG). The TAL1 region is zoomed, and the insertion breakpoint localization to the human orthologue region (114,722,607) is indicated by a red arrow. (b) ChIP-seq profiles of polycomb repressive chromatin mark H3K27me3 in normal human TAL1+ (HSC; erythroblasts) and TAL1 (peripheral CD4+ T cells) lineages, compared with TAL1+ (Jurkat) and TAL1 (DA) T-ALL cells. The TAL1 gene and surrounding area on chromosome 1 (including the STIL gene) is shown. The insertion breakpoint localization (47704964, HG19 coordinates) is indicated by an arrow. All profiles were input subtracted, except for HSC and erythroblasts for which input data were not available. Significantly enriched areas are represented as green rectangles under the lanes (MACS2 peaks).
Figure 2
Figure 2. Site- and allele-specific analysis of histone methylation/acetylation marks at the insertion breakpoint in Jurkat.
(a) Allelic-ChIP assay of H3K27me3 marks. Top panel: the assay to discriminate the germline (GL) from the inserted allele (Ins.) by substituting one of the GL primers allowing detection of the GL configuration at the insertion site (Rev. TAL1), with an insertion-specific primer allowing detection of the inserted configuration (Rev. Ins, overlapping the 12-bp insertion). Primer pairs were tested on GL p(GL) or inserted p(Ins) cloned fragments (and on cell lines containing (Jurkat) or not (DND) the insertion) to exclusively amplify each configuration, and do not crossreact. Bottom middle panel: western blot of EZH2 protein content on shMock or EZH2 knockdown conditions. Allelic-ChIP assays were performed in presence of a non-silencing sh-RNA (shControl) or a sh-RNA-targeting EZH2 (shEZH2) (left panel) or after the incubation of Jurkat cells with GSK126 (0.5 μM, 72H) or vehicle (dimethyl sulphoxide, DMSO; right panel). GAPDH and HoxD11 were used as controls for activated/repressed genes, modulated according to the polycomb-dependent H3K27me3 marks. Note that EZH2 knockdown/inhibition triggered only partial decrease of H3K27me3 marks at the PcG-repressed HoxD11 control gene, possibly due to incomplete knockdown/inhibition and/or redundancy of polycomb components in the adult lymphoid lineage. (b) Enrichment of acetylation marks at the TAL1 locus. H3K27Ac ChIP was performed with Jurkat cells incubated with vehicle (DMSO) or the histone deacetylase inhibitor sodium butyrate (SOB) (5 mM, 4H); DNA was then analysed by ChIP-seq (left panel) or by allelic-ChIP (bottom panel). For the ChIP-Seq, quantification of the number of tag sequences at the insertion point is shown (right panel). ***P<0.001; **P<0.001; *P<0.05, unpaired t-test. Errors bars represent 95% confidence interval.
Figure 3
Figure 3. Micro- and episomal insertions are recurrently found in monoallelic TAL1+ ‘unresolved cases’.
(a) Nucleotide sequences of episomal/microinsertions. All insertions were specifically and exclusively located at the indicated genomic position, and are pictured in red. Nucleotide deletions are indicated by a red dash. No SNPs are referenced at this position (Supplementary Fig. 8); (b) Relative TAL1 expression in T-ALL patients (n=111) according to biallelic (BI), or monoallelic (MONO) expression; patients with micro/episomal insertions are indicated in red; SIL-TAL cases are shown separately; informative cases: the presence of SNPs in TAL1 3’UTR allows to determine if the expression is mono- or biallelic. NI: non-informative cases (absence of SNPs in TAL1 3′ UTR does not allow to determine if the expression is mono- or biallelic). The average physiological TAL1 levels in thymus is shown as reference (Thymus); Horizontal bars indicate median expression levels; **indicates significant difference between BI and MONO expression (Mann–Whitney U-test, P<0,01); note that a number of biallelic patients are reaching/below physiological thymus levels, and might result from the presence of residual TAL1-expressing erythroblasts among tumoral cells; TAL1 expression was analyzed by Taqman assay and is normalized to ABL (see Methods).
Figure 4
Figure 4. Schematic representation of the episomal reintegration in Patient OC.
The TCRβ locus is displayed (top lane, not to scale). A functional Vβ7.4-to-Dβ1 rearrangement generating an excised TRECβ, and containing a (Vβ7.4/Dβ1) signal joint (SJ) is represented. The episome might have been open at the SJ by a nick–nick process generating 3′ hydroxyl ends before integration in chromosome 1. The episome is integrated in reverse orientation 10 kb downstream of the STIL gene, and 7 kb upstream of the TAL1 gene (middle lane). A 10-bp deletion (Δ, underlined) occurred at the insertion site. Localization of cryptic RSSs used by illegitimate V(D)J-mediated SIL-TAL deletion, and by t(1;14) TCRδ/TAL1 translocations are indicated by black arrow heads. TAL1 promoters (P1a, P1b, P4) are indicated. The breakpoints sequences (Bkp1/2) are shown (bottom lane). N, N regions; Vβ7.4 and Dβ1 RSSs are indicated, with heptamers (7) and nonamers (9) depicted.
Figure 5
Figure 5. Insertional mutagenesis is associated with epigenetic modulation and TAL1 gene expression.
(a) Allelic-ChIP analysis of H3K27me3 marks at the insertion breakpoint in primary patients. See legend to Fig. 2a. Marks at the GL alleles in one TAL1+ biallelic (RENE) and in one TAL1 (DAV) patients were performed as controls. ***P<0.001, unpaired t-test; Relative-fold plots: Inserted and/or GL allele ChIP values were calculated as fold increases relative to GAPDH (numbers in blue) or HoxD11 (numbers in red), and folds plotted as relative percentages (GAPDH relative folds: blue histograms; HOXD11 relative folds: red histograms). Blue histograms over 50% indicate higher differences with the expressed than the repressed control genes and correspond to (partially) repressed TAL1 expression; conversely, red histograms over 50% indicate higher differences with the repressed than the expressed control genes and correspond to (partially) derepressed TAL1 expression; histograms are ordered according to decreasing TAL1 repression. (b) Epigenetic modulation and TAL1 gene expression by DNA editing mimicking insertional mutagenesis. Left panel: schematic representation of the CRISPR design for homologous recombination at the TAL1 locus, and configuration of two edited clones in the PEER cell line. The locations of PCR primers (plain arrows) for detecting successful targeted events and for genome walking are indicated. Bottom left panel: successful homologous recombination was confirmed by PCR of the expected genome-donor and donor-insert boundaries. Top right panel: RQ-PCR analysis of TAL1 expression after editing. Transcripts were normalized to ABL and reported as relative values to non-edited PEER cells. Four PCR replicates were performed on 1 (clone 2.4, due to impaired growth) or 2 (clone 5.10) independent RNA extractions. Bottom right panel: allelic-ChIP assays of H3K27me3 and H3K27ac marks in edited clone 5.10. See legend to Fig. 2a. ***P<0.001, unpaired t-test.
Figure 6
Figure 6. Survival analysis.
Kaplan–Meier analysis showing DFS and OS of 165 protocolar patients treated in the GRAALL trial according to: (a,b) TAL1 expression quartiles; (cf) the mode of TAL1 expression. P values are indicated, log-rank (Mantle–Cox) test.

References

    1. Teitell M. A. & Pandolfi P. P. Molecular genetics of acute lymphoblastic leukemia. Annu. Rev. Pathol. 4, 175–198 (2009). - PubMed
    1. Van Vlierberghe P., Pieters R., Beverloo H. B. & Meijerink J. P. Molecular-genetic insights in paediatric T-cell acute lymphoblastic leukaemia. Br. J. Haematol. 143, 153–168 (2008). - PubMed
    1. Sanda T. et al. Core transcriptional regulatory circuit controlled by the TAL1 complex in human T cell acute lymphoblastic leukemia. Cancer Cell 22, 209–221 (2012). - PMC - PubMed
    1. Mouthon M. A. et al. Expression of tal-1 and GATA-binding proteins during human hematopoiesis. Blood 81, 647–655 (1993). - PubMed
    1. Herblot S., Steff A. M., Hugo P., Aplan P. D. & Hoang T. SCL and LMO1 alter thymocyte differentiation: inhibition of E2A-HEB function and pre-T alpha chain expression. Nat. Immunol. 1, 138–144 (2000). - PubMed

Publication types

MeSH terms