. 2015 Jan 23;11(1):e1004944.
doi: 10.1371/journal.pgen.1004944. eCollection 2015 Jan.

The Arabidopsis SWI2/SNF2 chromatin Remodeler BRAHMA regulates polycomb function during vegetative development and directly activates the flowering repressor gene SVP

Affiliations

The Arabidopsis SWI2/SNF2 chromatin Remodeler BRAHMA regulates polycomb function during vegetative development and directly activates the flowering repressor gene SVP

Chenlong Li et al. PLoS Genet. .

Abstract

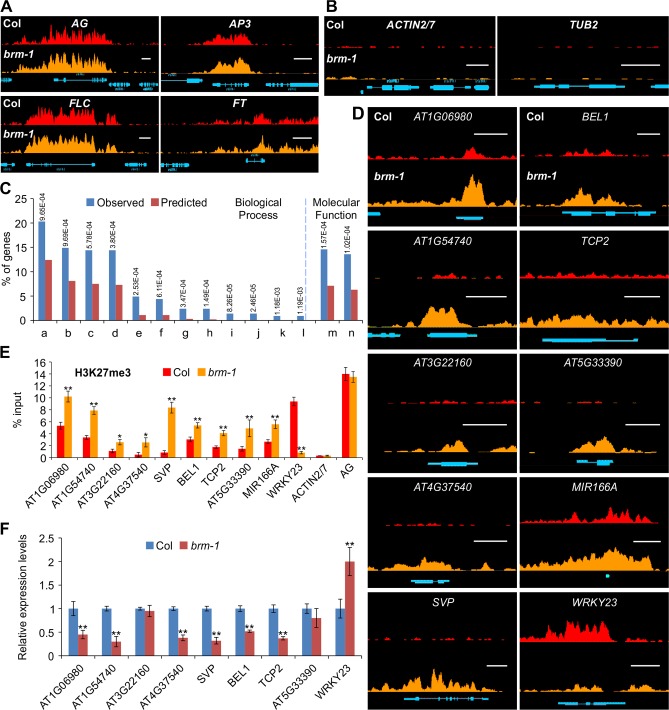
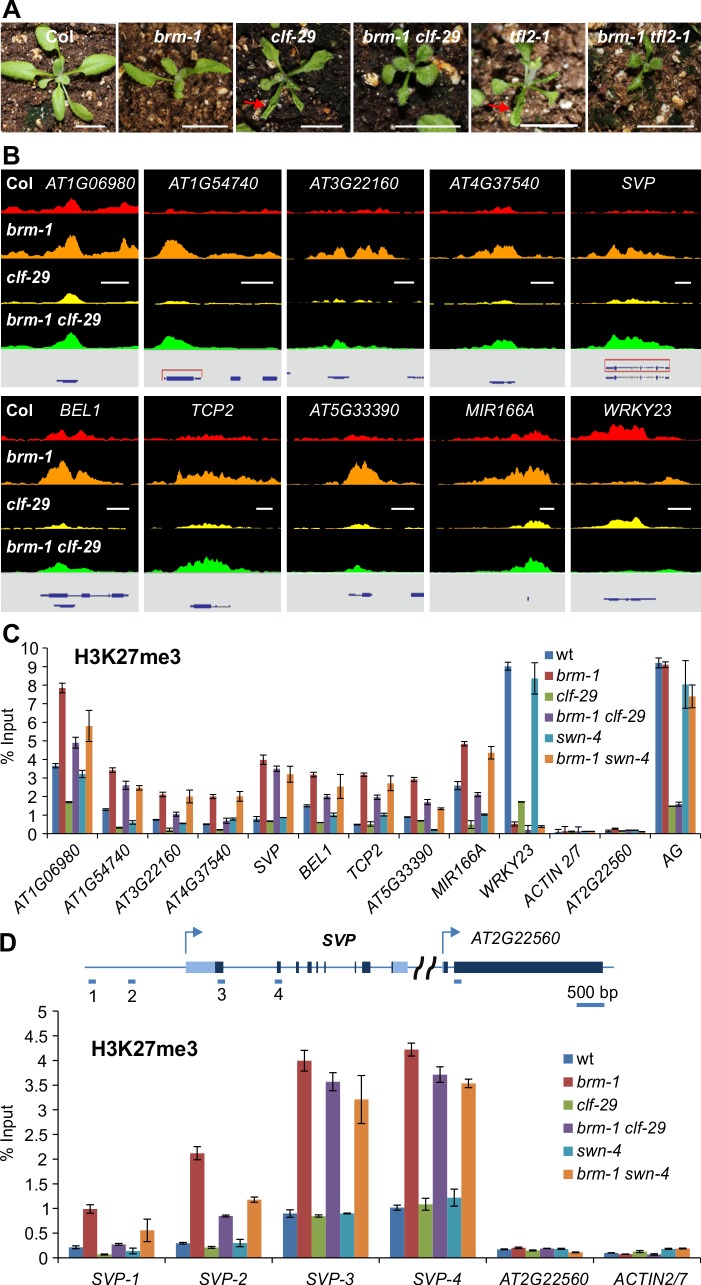
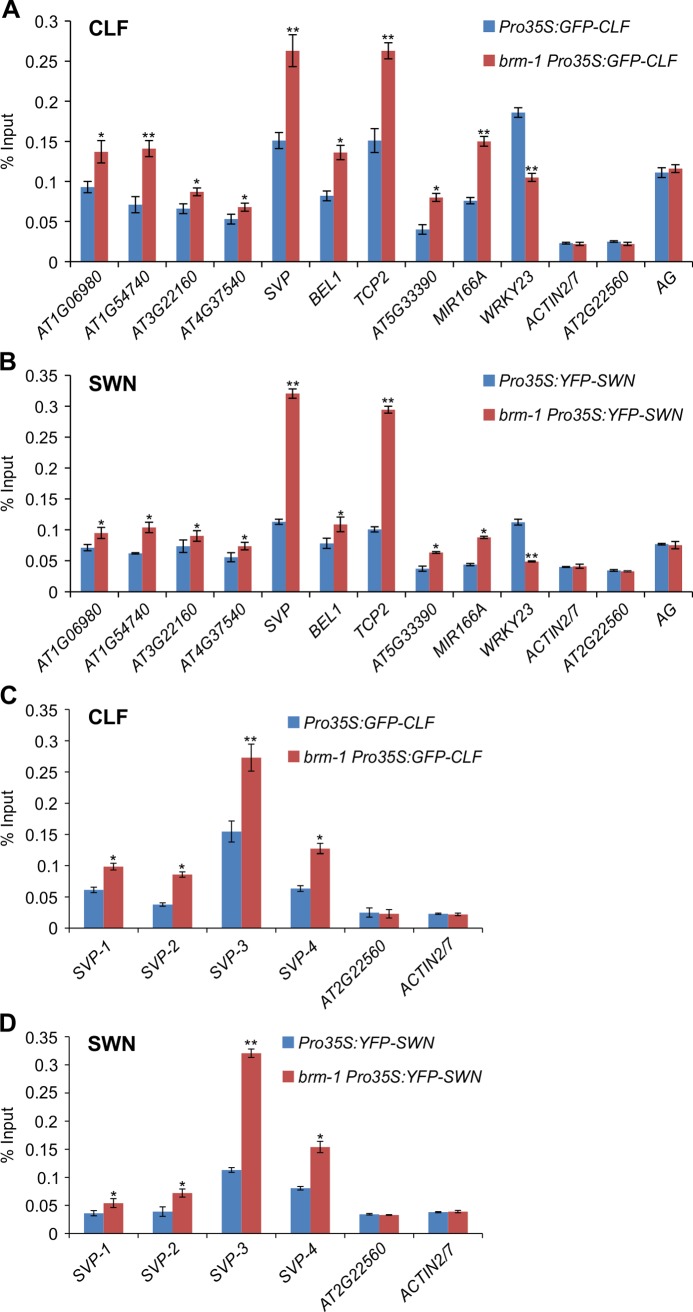
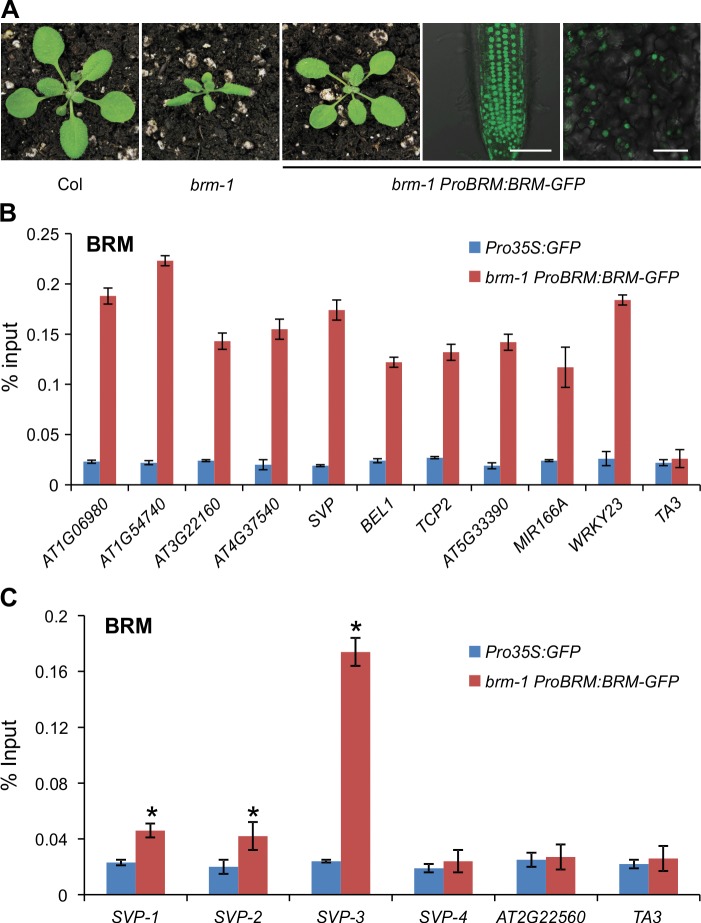
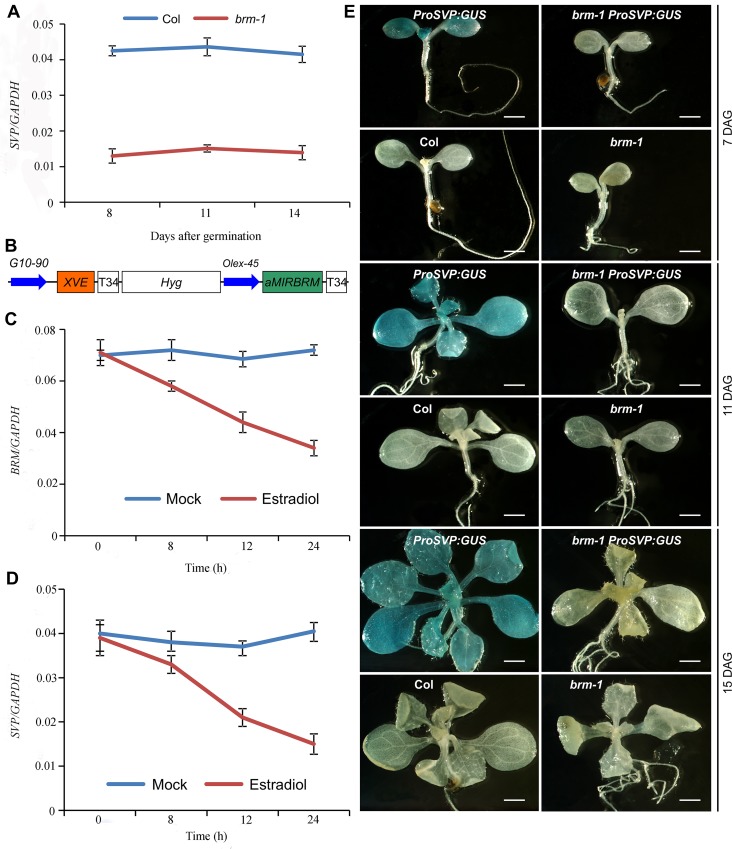
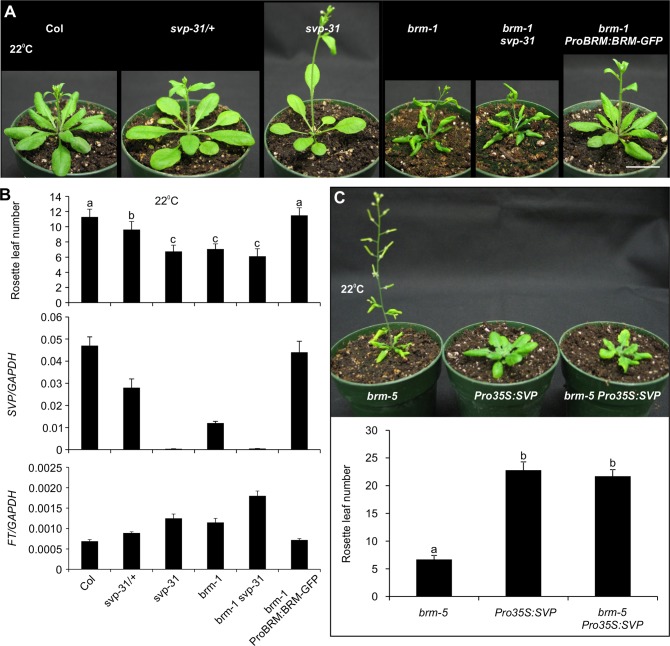
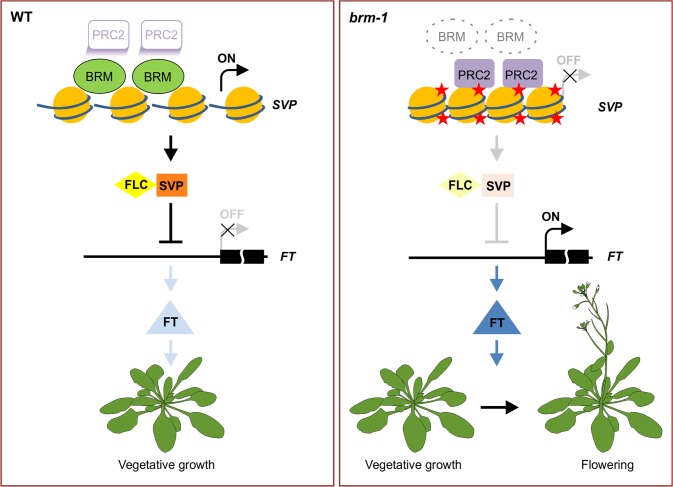
The chromatin remodeler BRAHMA (BRM) is a Trithorax Group (TrxG) protein that antagonizes the functions of Polycomb Group (PcG) proteins in fly and mammals. Recent studies also implicate such a role for Arabidopsis (Arabidopsis thaliana) BRM but the molecular mechanisms underlying the antagonism are unclear. To understand the interplay between BRM and PcG during plant development, we performed a genome-wide analysis of trimethylated histone H3 lysine 27 (H3K27me3) in brm mutant seedlings by chromatin immunoprecipitation followed by next generation sequencing (ChIP-seq). Increased H3K27me3 deposition at several hundred genes was observed in brm mutants and this increase was partially supressed by removal of the H3K27 methyltransferase CURLY LEAF (CLF) or SWINGER (SWN). ChIP experiments demonstrated that BRM directly binds to a subset of the genes and prevents the inappropriate association and/or activity of PcG proteins at these loci. Together, these results indicate a crucial role of BRM in restricting the inappropriate activity of PcG during plant development. The key flowering repressor gene SHORT VEGETATIVE PHASE (SVP) is such a BRM target. In brm mutants, elevated PcG occupancy at SVP accompanies a dramatic increase in H3K27me3 levels at this locus and a concomitant reduction of SVP expression. Further, our gain- and loss-of-function genetic evidence establishes that BRM controls flowering time by directly activating SVP expression. This work reveals a genome-wide functional interplay between BRM and PcG and provides new insights into the impacts of these proteins in plant growth and development.


Conflict of interest statement

The authors have declared that no competing interests exist.

Figures

Figure 1
Figure 1. Loss-of-function of BRM results in changes of H3K27me3 distribution over several hundred endogenous genes.
(A) ChIP-seq data for the well-known H3K27me3 target genes AG, AP3, FLC and FT from wild type Col (red; top) and brm-1 (orange; bottom). Gene structures are shown underneath each panel. Scale bars, 1Kb. The plants used were 14-day-old seedlings. (B) ChIP-seq data showing no H3K27me3 signal at two constitutively expressed genes ACTIN2/7 and TUB2 in wild-type Col (red; top) and brm-1 (orange; bottom). Gene structures are shown underneath each panel. Scale bars, 1Kb. (C) Gene Ontology (GO) analysis of the genes showing increased H3K27me3 levels in brm-1. Numbers on the top are P values (hypergeometric test) for GO category enrichment generated by comparing the percentage of the corresponding categories in the genes that showed increased H3K27me3 levels with those in the whole genome. (a) Regulation of biological process;(b) Regulation of metabolic process; (c) Regulation of macromolecule metabolic process;(d) Regulation of gene expression; (e) Response to auxin stimulus; (f) Tissue development; (g) Gene silencing by miRNA; (h) Meristem maintenance; (i) Meristem determinacy; (j) Floral meristem determinacy; (k) Leaf shaping; (l) Maintenance of floral meristem identity; (m) Transcription regulator activity; (n) Transcripiton factor activity. (D) ChIP-seq data showing changes in H3K27me3 levels at 10 selected genes in brm-1. Nine of them showed an increase and one showed a decrease in H3K27me3 levels. Data for the wild-type Col are shown in red at the top, and brm-1 is shown in orange at the bottom. Gene structures are shown underneath each panel. Scale bars, 1Kb. (E) ChIP-qPCR validation using independent samples. Data are shown as percentage of input. ACTIN2/7 and AG were used as control loci that exhibited no change in H3K27me3 deposition. Error bars indicate standard deviations from three biological replicates.*: P < 0.05; **: P < 0.01. (F) Expression analysis of selected genes by qRT-PCR. The expression of each gene was normalized to that of GAPDH, and the expression level in Col was set to 1. Error bars indicate standard deviations from three biological replicates.*: P < 0.05; **: P < 0.01.
Figure 2
Figure 2. Removal of CLF or SWN activity in brm background results in a substantial decrease of H3K27me3 deposition.
(A) Loss of BRM activity partially rescues the up-wardly leaf curling phenotypes of clf-29 and tfl2-1. Scale bar: 1 cm. (B) ChIP-seq data comparing H3K27me3 levels at 10 selected genes in Col, brm-1, clf-29 and brm-1 clf-29. Data for the wild type Col are shown in red, brm-1 in orange, clf-29 in yellow, and brm-1 clf-29 in green. Gene structures are shown underneath each panel. Scale bars, 1Kb. (C) ChIP-qPCR validation of the H3K27me3 ChIP-seq data using independent samples; and ChIP-qPCR detection of H3K27me3 levels in swn-4 and brm-1 swn-4 mutants. ChIP signals are shown as percentage of input. ACTIN2/7 and AT2G22560 (a flanking gene of SVP) were used as negative control loci; and AG was used as a positive control locus. Error bars indicate standard deviations from three biological replicates. (D) Top panel: schematic representation of the genomic region covering SVP and the flanking gene AT2G22560. Dark and light blue boxes indicate exon and intron, respectively. Arrows indicate the transcription start sites. Short blue lines indicate the positions of primer pairs used. Bottom panel: ChIP-qPCR determining the levels of H3K27me3 across the SVP locus. ChIP signals are shown as percentage of input. Error bars indicate standard deviations from three biological replicates.
Figure 3
Figure 3. Physical occupancy of CLF and SWN at selected genes in brm mutants.
(A) Analysis of CLF occupancy at selected genes as determined by ChIP-qPCR using anti-GFP antibody in brm-1 Pro35S:GFP-CLF and Pro35S:GFP-CLF plants. (B) Analysis of SWN occupancy at selected genes as determined by ChIP-qPCR using anti-GFP antibody in brm-1 Pro35S:YFP-SWN and Pro35S:YFP-SWN plants. (C) and (D) ChIP-qPCR to determine the levels of CLF (C) and SWN (D) occupancy across the SVP locus. The primers used are the same as those in Fig. 2D. ChIP signals are shown as percentage of input. ACTIN2/7 and AT2G22560 were used as negative control loci. AG was a positive control locus. Error bars indicate standard deviations among three biological replicates. *: P < 0.05; **: P < 0.01.
Figure 4
Figure 4. Physical occupancy of BRM at selected genes.
(A) ProBRM:BRM-GFP could complement the brm-1 phenotype. GFP signals were detected by confocal microscopy in 14-day-old brm-1 ProBRM:BRM-GFP roots and leaves, respectively. Scale bar: 50 μm. (B) BRM occupancy at selected genes as determined by ChIP using anti-GFP antibody in brm-1 ProBRM:BRM-GFP plants with Pro35S:GFP plants as control. ChIP signals are shown as percentage of input. TA3, a transposable element gene that is not targeted by BRM [34], was used as a negative control locus. (C) ChIP-qPCR to determine the occupancy of BRM across the SVP locus. ChIP signals are shown as percentage of input. The position of primer pairs used is the same as in Fig. 2D. AT2G22560, a flanking locus of SVP, was used as a negative control locus. Error bars indicate standard deviations among three biological replicates. *: P < 0.05.
Figure 5
Figure 5. SVP expression is tightly controlled by BRM.
(A) The expression of SVP is drastically decreased in developing brm-1 seedlings compared with that in Col (grown at 22°C) as determined by qRT-PCR. (B) Schematic diagram of the region between the right and left T-DNA borders of the XVE::aMIRBRM construct. The precursor of aMIRBRM was inserted behind a LexA operator sequence fused to the-45 35S minimal promoter (OLexA-45). Other components of the vector were described previously (Curtis and Grossniklaus 2003). (C) BRM expression in 7-old-day XVE::aMIRBRM transgenic seedlings mock treated or treated with 10μm β-estradiol for 0, 8, 12, and 24h, respectively. (D) SVP expression in 7-day-old XVE::aMIRBRM transgenic seedlings mock treated or treated with 10μm β-estradiol for 0, 8, 12, and 24h, respectively. The expression of each gene in A, C, and D was normalized to that of GAPDH. Error bars indicate standard deviations among three technical replicates from one representative experiment. (E) GUS activity patterns of ProSVP:GUS in Col and brm-1 backgrounds in 7, 11, and 14-DAG (days after germination) seedlings. Col and brm-1 were included as negative controls. Scale bar: 0.5 mm.
Figure 6
Figure 6. BRM represses flowering mainly through regulating SVP transcription.
(A) Comparison of flowering phenotypes of plants with various genetic backgrounds shortly after bolting. For direct comparison, pictures of wild-type and brm-1 ProBRM:BRM-GFP, svp-31 /+ (heterozygous) and svp-31, and brm-1 and brm-1 svp-31 were taken at the same age, respectively. All plants were grown at 22°C under long-day conditions. Scale bar: 2 cm. (B) Reduction of SVP expression is associated with the early flowering of brm-1 at 22°C. Top panel: rosette leaf number at bolting of plants in different genetic backgrounds. Error bar indicates standard deviations from at least 20 plants. Lowercase letters indicate significant differences between genetic backgrounds, as determined by Post-hoc Tukey’s HSD test. Middle panel: expression analysis of SVP. Bottom panel: expression analysis of FT. The expression of SVP and FT was calculated relative to that of GAPDH. Error bars indicate standard deviations among three technical replicates from one representative experiment. (C) Overexpression of SVP rescues the early flowering phenotype of brm mutant. Top panel: flowering phenotype of brm-5, Pro35S:SVP and brm-5 Pro35S:SVP plants grown for five weeks at 22°C under long-day conditions. Scale bar: 2 cm. Bottom panel: rosette leaf number of brm-5, Pro35S:SVP and brm-5 Pro35S:SVP plants at bolting. Lowercase letters indicate significant differences between genetic backgrounds, as determined by Post-hoc Tukey’s HSD test.
Figure 7
Figure 7. A model for BRM in preventing inappropriate PcG activities at SVP to promote vegetative growth.
In wild-type plants, BRM is physically present at the target chromatin sites, and suppresses the inappropriate silencing of target genes by PcG, thus maintaining the expression of the target loci where such expression is needed at the specific developmental phase. Without BRM, PcG is allowed access to some inappropriate genomic sites, resulting in increased H3K37me3 levels and consequently down-regulation of the expression of the genes. For example, SVP is highly expressed in wild-type seedlings and its downstream target FT is repressed, therefore, vegetative growth is promoted. Conversely, SVP expression is repressed by the mistargeting of PRC2 in brm mutants, and FT is de-repressed as a result to lead to early flowering. Red star: the H3K27me3 mark.

Similar articles

Cited by

References

    1. He Y (2012) Chromatin regulation of flowering. Trends Plant Sci 17: 556–562. 10.1016/j.tplants.2012.05.001 - DOI - PubMed
    1. Boss PK, Bastow RM, Mylne JS, Dean C (2004) Multiple pathways in the decision to flower: enabling, promoting, and resetting. Plant Cell 16: S18–S31. 10.1105/tpc.015958 - DOI - PMC - PubMed
    1. Mouradov A, Cremer F, Coupland G (2002) Control of flowering time interacting pathways as a basis for diversity. Plant Cell 14: S111–S130. 10.1105/tpc.001362 - DOI - PMC - PubMed
    1. Andrés F, Coupland G (2012) The genetic basis of flowering responses to seasonal cues. Nat Rev Genet 13: 627–639. 10.1038/nrg3291 - DOI - PubMed
    1. Li D, Liu C, Shen L, Wu Y, Chen H, et al. (2008) A repressor complex governs the integration of flowering signals in Arabidopsis . Dev Cell 15: 110–120. 10.1016/j.devcel.2008.05.002 - DOI - PubMed

Publication types

MeSH terms