. 2015 Jan 1;71(Pt 1):136-53.
doi: 10.1107/S1399004714021683. Epub 2015 Jan 1.

Tools for macromolecular model building and refinement into electron cryo-microscopy reconstructions

Affiliations

Tools for macromolecular model building and refinement into electron cryo-microscopy reconstructions

Alan Brown et al. Acta Crystallogr D Biol Crystallogr. .

Abstract

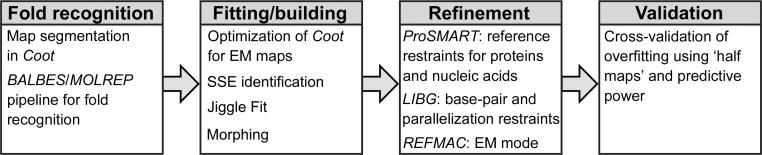
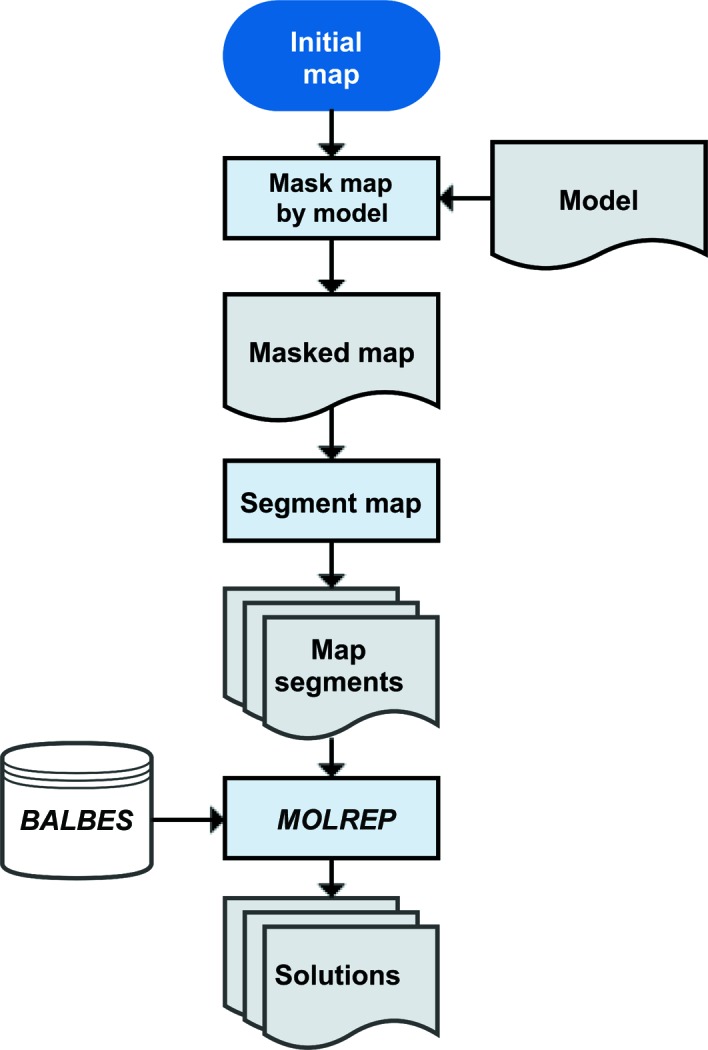
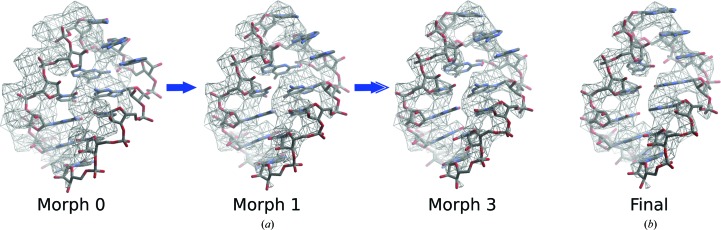
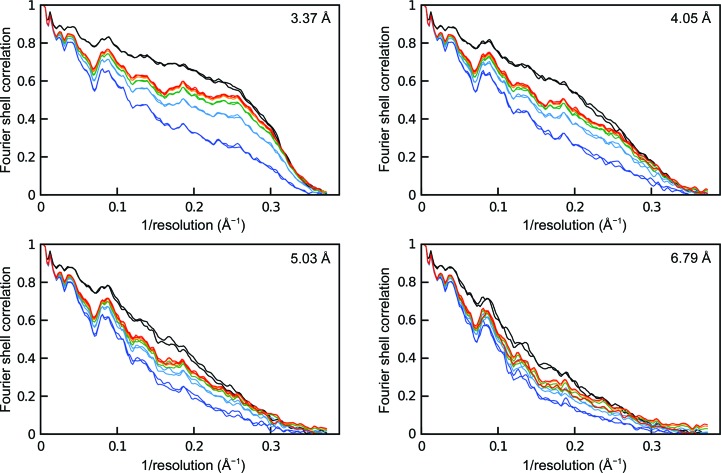
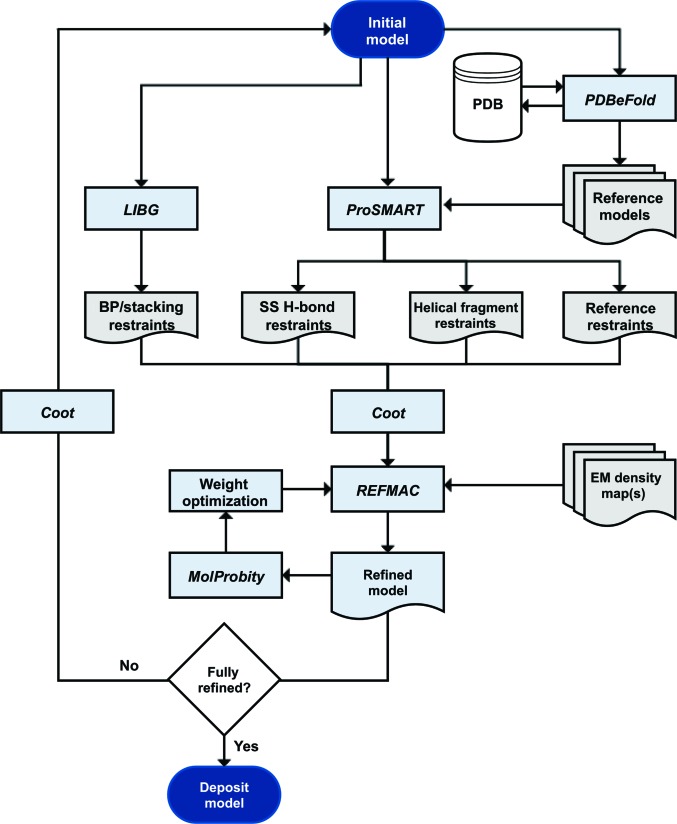
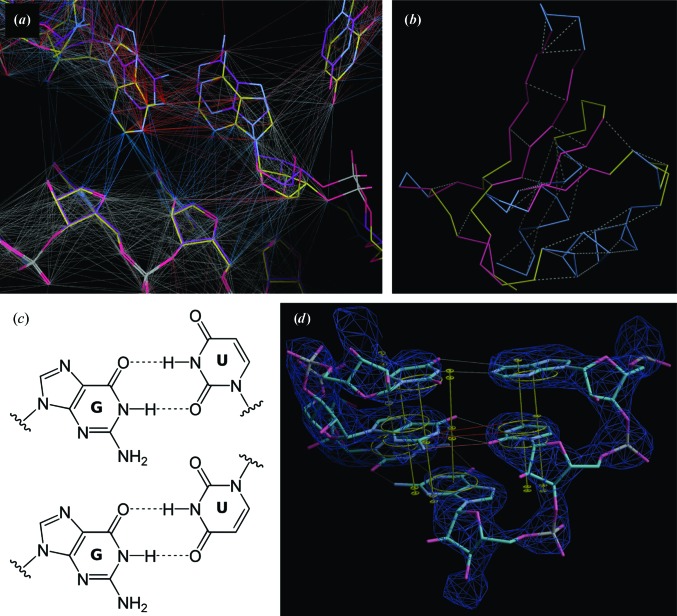
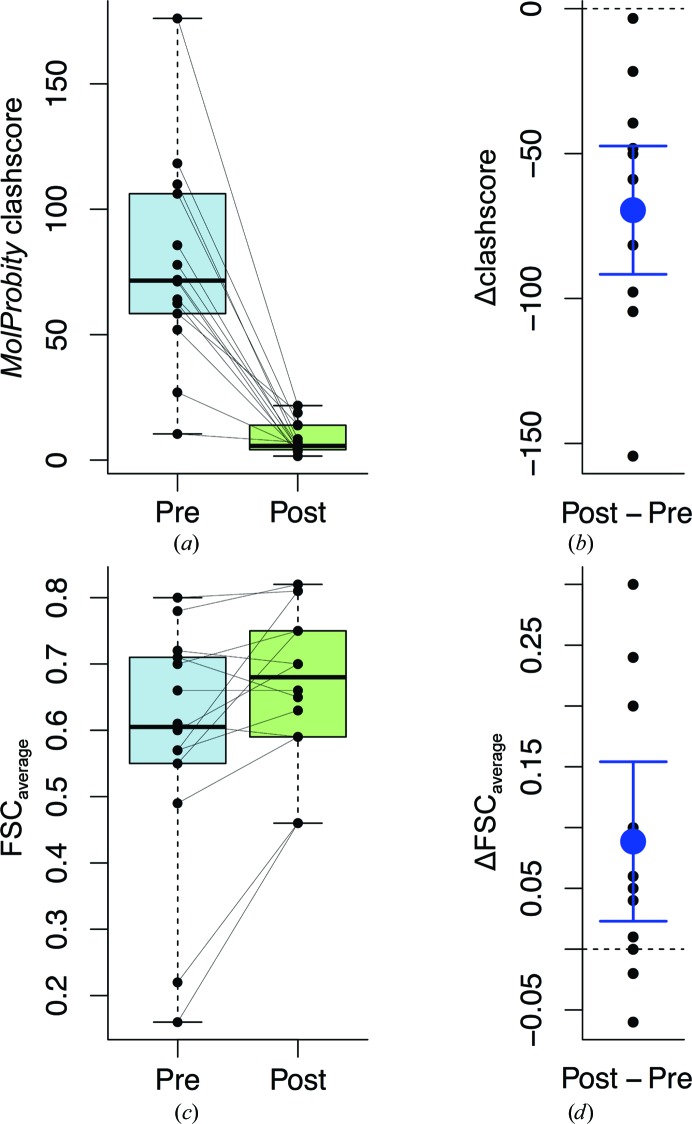
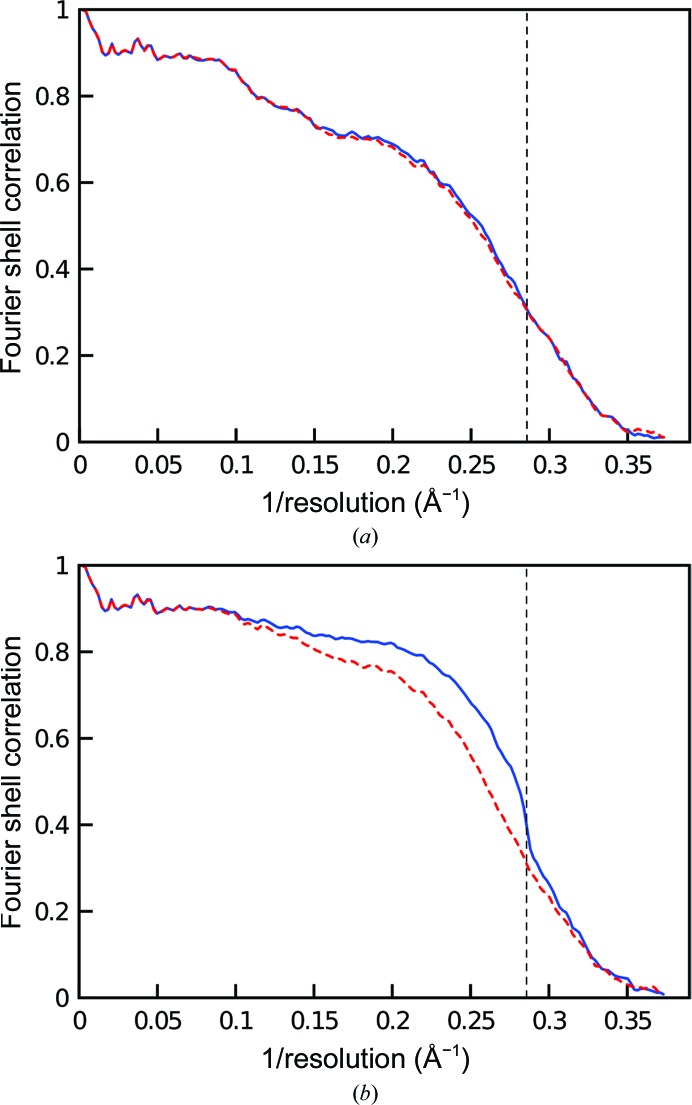
The recent rapid development of single-particle electron cryo-microscopy (cryo-EM) now allows structures to be solved by this method at resolutions close to 3 Å. Here, a number of tools to facilitate the interpretation of EM reconstructions with stereochemically reasonable all-atom models are described. The BALBES database has been repurposed as a tool for identifying protein folds from density maps. Modifications to Coot, including new Jiggle Fit and morphing tools and improved handling of nucleic acids, enhance its functionality for interpreting EM maps. REFMAC has been modified for optimal fitting of atomic models into EM maps. As external structural information can enhance the reliability of the derived atomic models, stabilize refinement and reduce overfitting, ProSMART has been extended to generate interatomic distance restraints from nucleic acid reference structures, and a new tool, LIBG, has been developed to generate nucleic acid base-pair and parallel-plane restraints. Furthermore, restraint generation has been integrated with visualization and editing in Coot, and these restraints have been applied to both real-space refinement in Coot and reciprocal-space refinement in REFMAC.

Keywords: LIBG; electron cryo-microscopy reconstructions; model building; refinement.


Figures

Figure 1
Figure 1
Tools to facilitate the interpretation of EM data with atomic models.
Figure 2
Figure 2
Flowchart of the BALBESMOLREP pipeline implemented for fold recognition using map-masking and segmentation tools in Coot.
Figure 3
Figure 3
Fold recognition can identify template molecules for model building. (a) Density map corresponding to the final model of the mitoribosomal protein mL38 with the segmented search map indicated. (b) Top solution from the BALBESMOLREP pipeline. (c, d) Final refined model of mL38 in (c) cartoon and (d) full-atom representation.
Figure 4
Figure 4
(a, b) Jiggle Fit improves local fit to density. (a) Randomly rotated and displaced models (by up to 1 Å, left) can be jiggled into their corresponding densities in a manner not dependent on resolution (right). (b) The dependence of Jiggle Fit on resolution and displacement from the correct solution. For clarity, four resolutions are shown: 3.37 Å (unfilled squares), 4.05 Å (triangles), 5.03 Å (circles) and 6.79 Å (filled squares). (c, d) Jiggle Fit coupled to SSE identification. (c) Examples of density for an α-helix at (from left to right) 6.8, 5.0 and 3.2 Å resolution, showing loss of pitch and side-chain densities at lower resolution. (d) Resolution dependence of Jiggle Fit in determining helix orientation.
Figure 5
Figure 5
Example of model morphing. (a) Section of RNA taken from the complete rigid-body docking of bacterial rRNA into the mitochondrial ribosome map (morph 0) and morphed in Coot for three iterations. (b) The final refined structure of mitochondrial rRNA.
Figure 6
Figure 6
FSC curves following the progress of morphing at 3.37, 4.05, 5.03 and 6.79 Å resolution. Black lines represent the fit of mitochondrial rRNA to both mitochondrial half maps at the given resolution. Dark blue lines represent the initial fit of bacterial rRNA to both mitochondrial half maps. The bacterial rRNA was morphed four times: iterations 1 (light blue), 2 (green), 3 (orange) and 4 (red). Excluding the fourth iteration at 6.79 Å resolution, the FSC curves for both half maps overlap, demonstrating that morphing does not result in overfitting.
Figure 7
Figure 7
Flowchart showing the overall scheme for restrained refinement of models against EM data. ProSMART generates three classes of restraint: (i) reference restraints, (ii) helical fragment restraints and (iii) secondary-structure hydrogen-bond restraints (which include helix, sheet and loop restraints). Alongside reciprocal-space refinement in REFMAC, real-space refinement tools in Coot can be used to optimize the fit to density.
Figure 8
Figure 8
Restraint visualization in Coot. (a) Restraints were generated using ProSMART for an initial model of the mitoribosome (yellow) using the bacterial ribosome (purple) as a reference and were visualized in Coot. There are conformational differences between the two rRNA chains despite the sequence identity in the displayed region. Consequently, the local interatomic distances are conserved along the chain (grey) but are shorter across the chain (blue). Interatomic vectors coloured red indicate that the distances in the target structure are longer than in the reference structure. (b) Visualization of ProSMART hydrogen-bond restraints in Coot. (c) G:U base pair shown in (top) wobble and (bottom) reverse wobble configuration. (d) A G:U base pair with both pairs of LIBG restraints displayed in Coot. Only the distance restraints that best describe the orientation of the bases (grey, G:U wobble) are used as targets during refinement. Restraints for the reverse wobble configuration are shown in red. Parallel-plane restraints are shown in yellow.
Figure 9
Figure 9
Box-and-whisker plots for refinement of EM structures at 4 Å resolution or better. (a) MolProbity clashscores before (pre) and after (post) restrained refinement with REFMAC. (b) Improvement in clashscores showing the mean of the differences and 95% confidence intervals. (c) FSCaverage before and after restrained refinement. (d) Improvement in FSCaverage showing the mean of the differences and 95% confidence intervals.
Figure 10
Figure 10
Effect of overfitting on FSC curves. (a) A refined structure that does not display the hallmarks of overfitting. FSCwork is shown with a continuous blue line and FSCtest with a dashed red line. The resolution cutoff applied during refinement is shown as a vertical dashed line. (b) An overfitted structure showing disagreement between FSCwork and FSCtest and a sharp decrease at the resolution limit applied during refinement.

References

    1. Alexandrov, N. & Shindyalov, I. (2003). Bioinformatics, 19, 429–430. - PubMed
    1. Allegretti, M., Mills, D. J., McMullan, G., Kühlbrandt, W. & Vonck, J. (2014). eLife, 3, e01963. - PMC - PubMed
    1. Amunts, A., Brown, A., Bai, X.-C., Llácer, J. L., Hussain, T., Emsley, P., Long, F., Murshudov, G., Scheres, S. H. W. & Ramakrishnan, V. (2014). Science, 343, 1485–1489. - PMC - PubMed
    1. Bai, X.-C., Fernandez, I. S., McMullan, G. & Scheres, S. H. W. (2013). eLife, 2, e00461. - PMC - PubMed
    1. Baker, M. L., Baker, M. R., Hryc, C. F., Ju, T. & Chiu, W. (2012). Biopolymers, 97, 655–668. - PMC - PubMed

Publication types

MeSH terms

Substances