. 2015 Apr;100(4):499-510.
doi: 10.3324/haematol.2014.112276. Epub 2015 Jan 23.

Generation of a poor prognostic chronic lymphocytic leukemia-like disease model: PKCα subversion induces up-regulation of PKCβII expression in B lymphocytes

Affiliations

Generation of a poor prognostic chronic lymphocytic leukemia-like disease model: PKCα subversion induces up-regulation of PKCβII expression in B lymphocytes

Rinako Nakagawa et al. Haematologica. 2015 Apr.

Abstract

Overwhelming evidence identifies the microenvironment as a critical factor in the development and progression of chronic lymphocytic leukemia, underlining the importance of developing suitable translational models to study the pathogenesis of the disease. We previously established that stable expression of kinase dead protein kinase C alpha in hematopoietic progenitor cells resulted in the development of a chronic lymphocytic leukemia-like disease in mice. Here we demonstrate that this chronic lymphocytic leukemia model resembles the more aggressive subset of chronic lymphocytic leukemia, expressing predominantly unmutated immunoglobulin heavy chain genes, with upregulated tyrosine kinase ZAP-70 expression and elevated ERK-MAPK-mTor signaling, resulting in enhanced proliferation and increased tumor load in lymphoid organs. Reduced function of PKCα leads to an up-regulation of PKCβII expression, which is also associated with a poor prognostic subset of human chronic lymphocytic leukemia samples. Treatment of chronic lymphocytic leukemia-like cells with the selective PKCβ inhibitor enzastaurin caused cell cycle arrest and apoptosis both in vitro and in vivo, and a reduction in the leukemic burden in vivo. These results demonstrate the importance of PKCβII in chronic lymphocytic leukemia-like disease progression and suggest a role for PKCα subversion in creating permissive conditions for leukemogenesis.


Figures

Figure 1.
Figure 1.
PKCα-KR-expressing cells phenotypically resemble human CLL cells according to surface protein expression. (A) MIEV- or PKCα-KR-HPC-OP9 co-cultures were analyzed by flow cytometry at d10. FACS plots shown are live- and size- (FSC/SSC) and hemopoietic lineage (CD45+)-gated prior to analysis for CD5 vs. CD19, CD23 vs. CD19 and IgM vs. CD19 as indicated. Percentages are indicated in the corner of the quadrants. (B) The mean fluorescence intensity (MFI) of CD19, CD5, CD23 and IgM was calculated for a minimum of three individual biological replicates. Data are presented as mean (± SEM). P values were generated using a Student unpaired t-test to compare groups (*P<0.05; **P<0.005; ***P<0.001). (C) A histogram comparing the surface expression of CD23 on GFP+CD45+CD19+CD5+-gated MIEV or PKCα-KR cells, against relative cell number (RCN).
Figure 2.
Figure 2.
CLL-like cells disseminate into primary and secondary lymphoid organs. MIEV- and PKCα-KR-HPCs were injected (i.p.) into RAG-1−/− neonates. (A) Kaplan-Meier curves comparing the survival rates in mice adoptively-transferred with MIEV-HPCs [500K-pale gray line, square (n=5) or PKCα-KR-HPC (500K-mid-gray line, triangle (n=5); 300K-dark gray line, circle (n=6); 100K-dotted line (n=4)]. Log-rank (Mantel-Cox) test showed an overall significant difference (P=0.0013). The log-rank test of trend revealed a significant linear trend between the number of cells injected and the survival of mice (P=0.0001). (B) Spleen weights from RAG−/−, MIEV-HPC and PKCα-KR-HPC mice are shown as a percentage of total body weight. A Student unpaired t-test was performed; *P<0.05. The graphs were generated from six spleens per condition. (C) Five-week post-reconstitution mice were sacrificed. Paraffin-embedded spleens from RAG−/− host mice (top) MIEV (middle) or PKCα-KR (bottom) were sectioned and stained with either H&E (left) or anti-B220 antibody (brown; right); 40 × magnification shown. (D) Single cell suspensions were prepared from organs as indicated and analyzed by flow cytometry for CLL cell markers, CD19 and CD5 after live- and size-(FSC/SSC) and GFP+CD45+ gating. (E) The percentage of GFP+CD19+ cells or GFP+CD19+CD5+ cells within total hematopoietic CD45+ cells in the indicated organs is shown for mice reconstituted with MIEV- or PKCα-KR-HPC as indicated. A Student unpaired t-test was performed; *P<0.05, ** P<0.005, ***P<0.001. The graphs were generated using data from ten individual mice.
Figure 3.
Figure 3.
PKCα-KR-transduced CLL-like cells resemble poor prognostic CLL patients’ samples. (A) MIEV- or PKCα-KR-HPC were analyzed by flow cytometry for intracellular levels of ZAP-70 at d12 of co-culture. Solid line, PKCα-KR; dotted line, MIEV; shaded, isotype control. A representative blot of three independent cultures is shown. (B) The percentage of ZAP-70+ cells was analyzed by flow cytometry in B lineage cells isolated from the spleens of ICR-WT, Eμ-TCL-1 Tg and PKCα-KR-HPC mice. Isotype control and ICR-T-cell-positive control are shown. (C) Protein lysates were prepared from MIEV-FL or PKCα-KR-FL co-cultures at d10 and d16. Western blots were carried out, immunoblotting for phosphorylated and total ERK1/2, phosphorylated and total S6, and an additional loading control, GAPDH. (D) Proliferation was assessed by culturing 50,000 MIEV- or PKCα-KR cells from early (d6 – d10) and late (d15 – d20) stages of the cultures and incubating cells with BrdU for 2 h prior to the end of the 24 h timepoint. Data are represented as mean (± SEM) of at least three biological replicates, each carried out in technical triplicates. (E) Ki-67 expression levels (MFI) were analyzed in CD19-MACS-purified ICR-WT and PKCα-KR-HPC spleens. (F) RNA was isolated from MIEV- or PKCα-KR-OP9 cells derived from early (d6 – d10) and late (d15 – d20) stages of the cultures and subjected to quantitative reverse transcription-PCR to evaluate the levels of aicda expression. Results are expressed as 2(−ΔΔCT) relative to the GAPDH reference gene. Data are represented as mean (± SEM) of at least three biological replicates, each carried out in technical triplicates. A Student unpaired t-test was performed; *P<0.05, ** P<0.005.
Figure 4.
Figure 4.
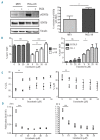
CLL cells isolated from mouse models and CLL patients samples exhibit altered PKC isoform expression profiles. (A) Protein lysates were prepared from MIEV- or PKCα-KR-HPC derived cells at the indicated times, separated by gel electrophoresis and immunoblotted for PKC substrates using the anti-phospho-Ser PKC substrate antibody (pSer-PKC-substrate). GAPDH was included as a protein loading control. (B) Protein kinase assay was carried out on cells prepared from d17 MIEV- or PKCα-KR-OP9 co-cultures. A Student unpaired t-test was performed; *P<0.05. (C) Protein lysates were prepared from MIEV- or PKCα-KR-OP9 co-cultures and immunoblotted for PKCβI, PKCβII and GAPDH as a protein loading control. (D) Protein lysates were prepared from earlier and later MIEV- or PKCα-KR-OP9 co-cultures as indicated and immunoblotted for PKCβII and GAPDH as a protein loading control. (E) Protein lysates were prepared from B lineage cells of freshly isolated peripheral blood samples derived from healthy donors or CLL patients. Membranes were immunoblotted for PKCα, PKCβII and GAPDH as a protein loading control. (F) Protein lysates were prepared from MACS-isolated spleen B cells from age-matched C57BL/6 (n=5), Eμ-TCL-1 Tg (n=5) and PKCα-KR-expressing (n=4) mice and immunoblotted for PKCα, PKCβII and GAPDH as a protein loading control. A representative blot (left) and the mean expression (±SEM) of PKCα (left) and PKCβII (right) as a ratio of GAPDH are shown. (G) Protein lysates were prepared from MACS-isolated spleen B cells of Eμ-TCL-1 Tg (n=5), PKCα-KR-expressing (n=4) and age-matched C57BL/6 (n=5) mice and immunoblotted for pERK/ERK and pS6/S6. A representative blot (left) and the mean expression (±SEM) of pERK as a ratio of ERK (left) and pS6 as a ratio of S6 (right) are shown.
Figure 5.
Figure 5.
Enzastaurin induced cell cycle arrest and apoptosis in CLL-like cells. MIEV- or PKCα-KR-HPC-derived cells were cultured for 24 hr in the presence of enzastaurin (ENZA) as indicated. (A) Protein lysates were prepared from late co-cultures (post-d15) of MIEV- or PKCα-KR-expressing cells. Proteins separated by gel electrophoresis and immunoblotted for phos-pho-GSK3βS9, GSK3β and tubulin as a protein loading control. Densitometry was performed on the blots, assessing the phospho-GSK3βS9 signal compared with GSK3β signal strength. The mean percentage (± SEM) of phospho-GSK3β signal reduction from untreated cells in three independent experiments is shown. (B) Flow cytometry was used to assess the level of apoptosis induced by enzastaurin treatment of MIEV- vs. PKCα-KR cells and splenic B lineage cells isolated from age-matched C57BL/6 vs. Eμ-TCL-1 transgenic mice. Annexin V+DAPI cells represent early apoptotic cells. Data are represented as mean (± SEM) of three biological replicates. (C) PI analysis was used to calculate the phases of the cell cycle (G0/G1 and G2M shown). Data shown exclude the sub-G0 population. Data are represented as mean (± SEM) of at least three biological replicates. Open circle (○) PKCα-KR; filled circle (•) MIEV. (D) MIEV- or PKCα-KR-expressing cells were cultured for 24 or 48 h in the presence of ENZA, as indicated. Cells were incubated with BrdU for 2 h prior to the end of the timepoint. Absorbance values were read at 492 nm to 370 nm after addition of TMB substrate. Data shown are the mean (± SEM) of at least three biological replicates, each carried out in technical triplicates. P values were generated using the Student unpaired t-test *P<0.05, **P<0.005, ***P<0.001.
Figure 6.
Figure 6.
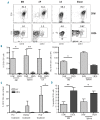
Enzastaurin (ENZA) reduced leukemic burden and selectively induced apoptosis in CLL-like cells in vivo. CLL-like diseased mice were generated by adoptively transferring 4×10⁵ PKCα-KR-FL cells into RAG-1−/− neonates. Four to six weeks after injection, on confirmation of a population of CLL-like cells in the blood (≥ 0.4%), mice were dosed with either ENZA or vehicle control 5% dextrose in water (D5W) for up to 21 days. Thereafter, blood, bone marrow (BM), spleen (SP) and lymph nodes (LN) were analyzed for leukemic burden and level of apoptosis by flow cytometry as indicated. (A) Representative flow cytometric analysis of vehicle- or ENZA-treated mice. Data shown were analyzed for CLL cell markers, CD19 and CD5 after live- and size- (FSC/SSC), GFP+ and CD45+ gating. The percentage of GFP+ CLL-like cells within the total population is shown. (B) Percentages (left) and numbers (right) of the GFP+CD45+CD19+CD5+ population are shown in the ENZA- and D5W-treated mice in the organs indicated. (C) Percentages of GFP+CD45+CD19+CD5+ cells in the blood before, during, and after ENZA-treatment and vehicle administration. (D) Percentages of annexin V+7-AAD apoptosing cells were calculated within the GFP+CD19+ population of ENZA-and vehicle-treated mice. Data shown are the mean (± SEM) of six individual mice. P values were generated using the Student unpaired t-test *P<0.05, **P<0.005.

References

    1. Dighiero G. CLL Biology and prognosis. Hematology Am Soc Hematol Educ Program. 2005:278–84. - PubMed
    1. Hanada M, Delia D, Aiello A, Stadtmauer E, Reed JC. bcl-2 gene hypomethylation and high-level expression in B-cell chronic lymphocytic leukemia. Blood. 1993;82(6):1820–1828. - PubMed
    1. Messmer BT, Messmer D, Allen SL, et al. In vivo measurements document the dynamic cellular kinetics of chronic lymphocytic leukemia B cells. J Clin Invest. 2005;115(3):755–764. - PMC - PubMed
    1. Ghia P, Chiorazzi N, Stamatopoulos K. Microenvironmental influences in chronic lymphocytic leukaemia: the role of antigen stimulation. J Intern Med. 2008;264(6):549–562. - PubMed
    1. Herishanu Y, Pérez-Galán P, Liu D, et al. The lymph node microenvironment promotes B-cell receptor signaling, NF-kappaB activation, and tumor proliferation in chronic lymphocytic leukemia. Blood. 2011;117(2):563–574. - PMC - PubMed

Publication types

MeSH terms

Substances