. 2015 Apr;14(4):841-53.
doi: 10.1074/mcp.M114.044222. Epub 2015 Jan 22.

Deep proteomics of mouse skeletal muscle enables quantitation of protein isoforms, metabolic pathways, and transcription factors

Affiliations

Deep proteomics of mouse skeletal muscle enables quantitation of protein isoforms, metabolic pathways, and transcription factors

Atul S Deshmukh et al. Mol Cell Proteomics. 2015 Apr.

Abstract

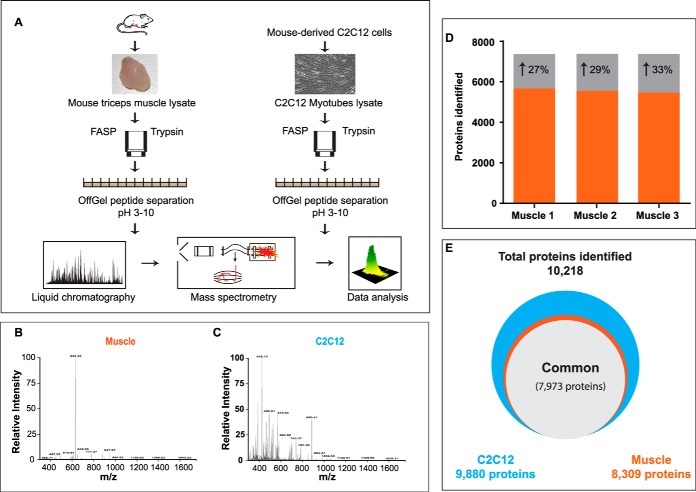
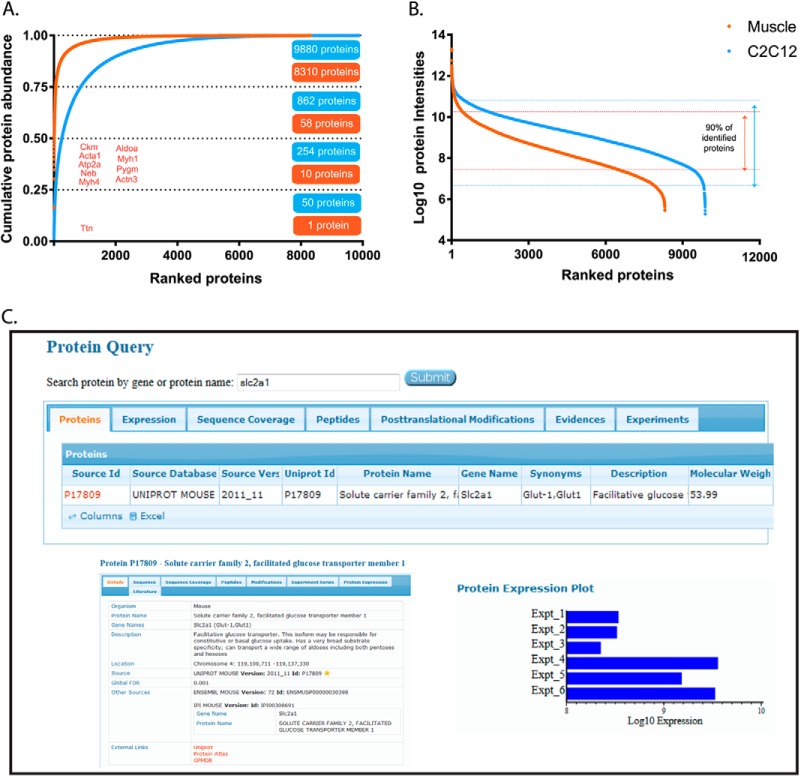
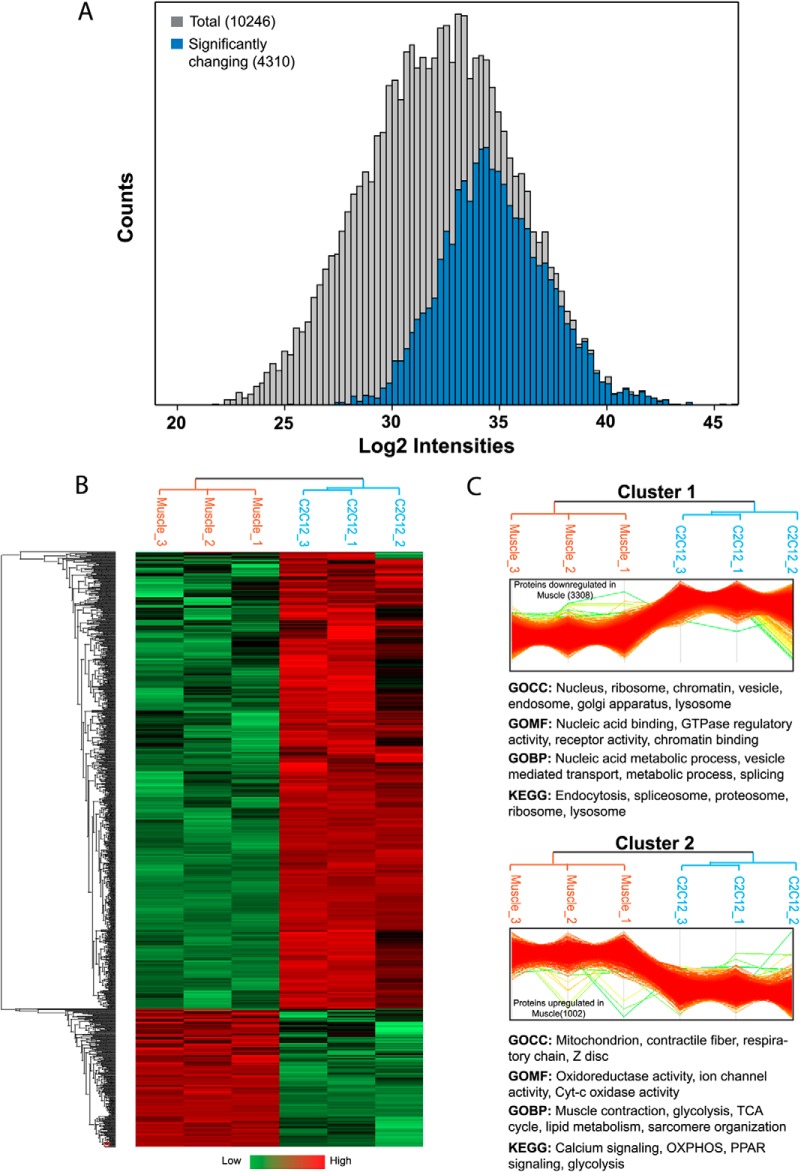
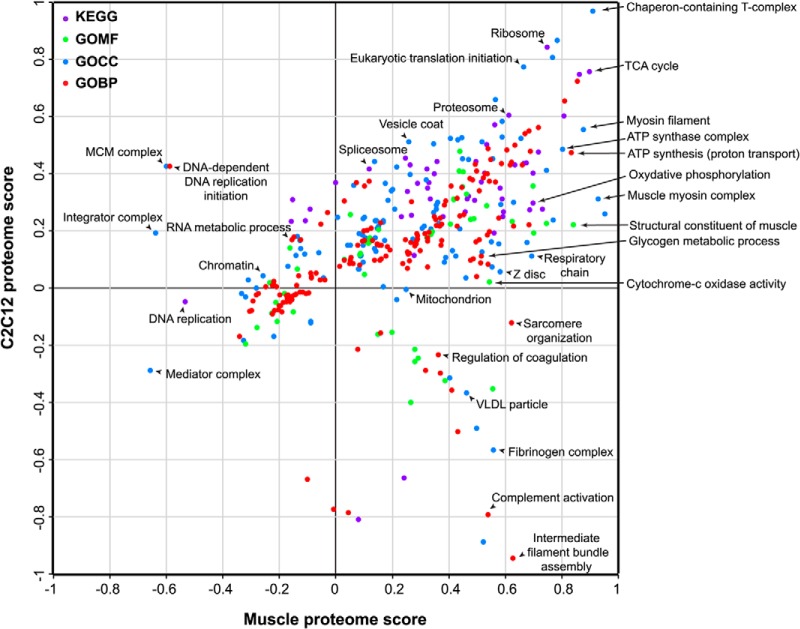
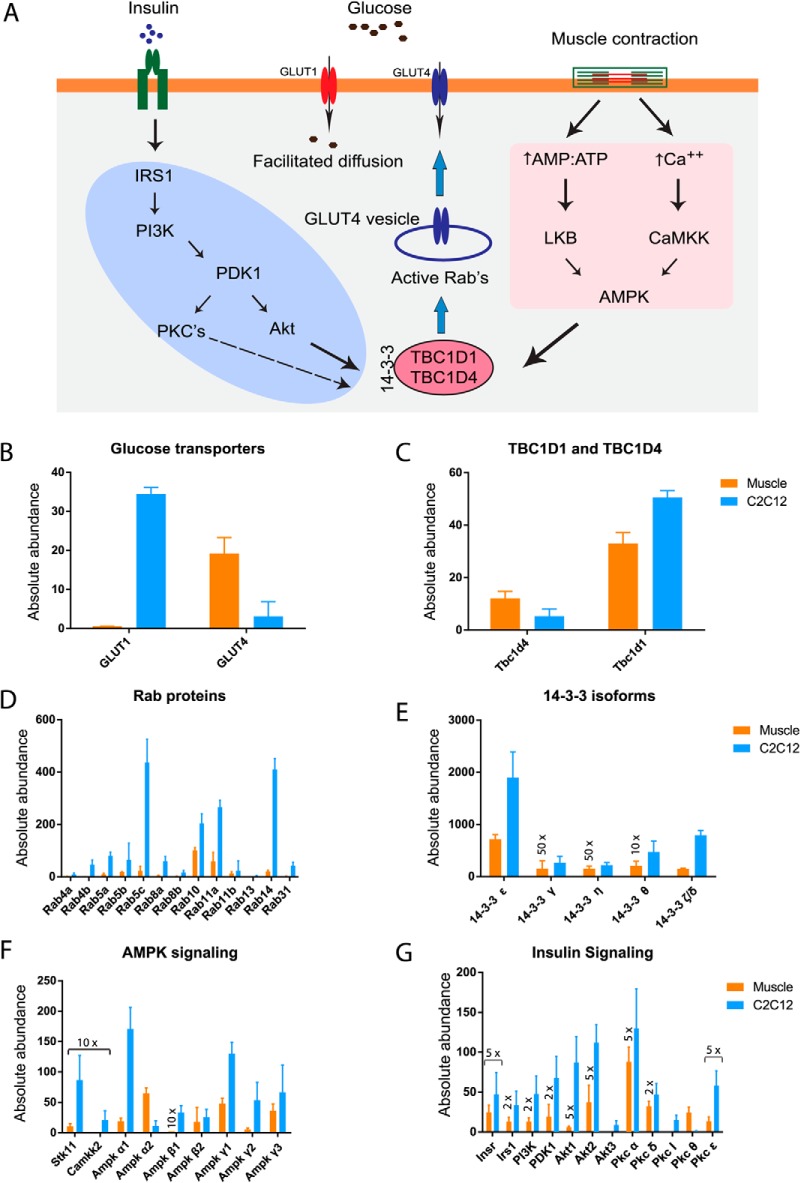
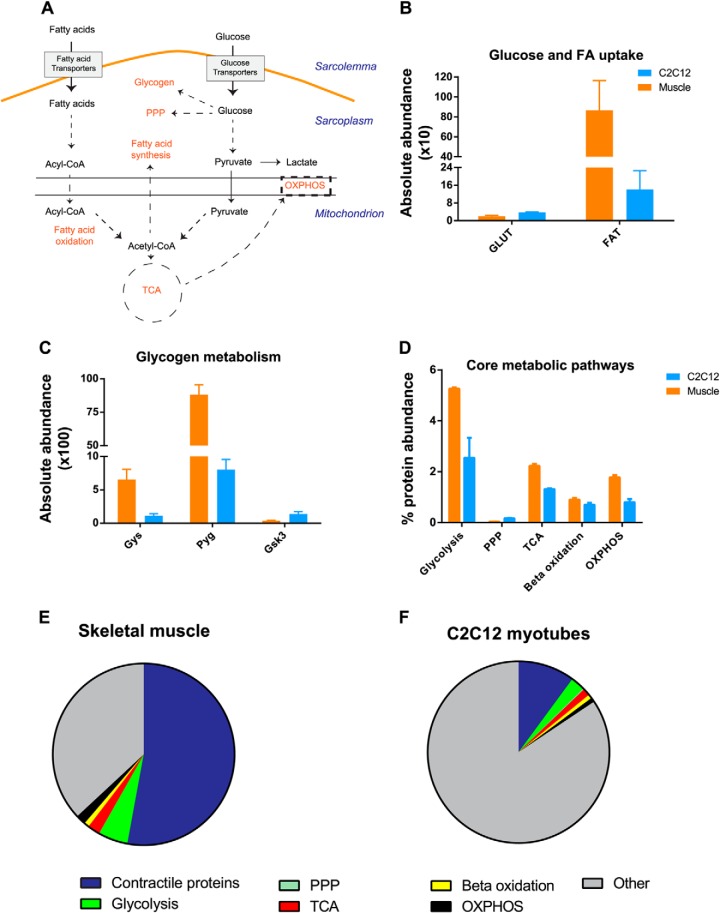
Skeletal muscle constitutes 40% of individual body mass and plays vital roles in locomotion and whole-body metabolism. Proteomics of skeletal muscle is challenging because of highly abundant contractile proteins that interfere with detection of regulatory proteins. Using a state-of-the art MS workflow and a strategy to map identifications from the C2C12 cell line model to tissues, we identified a total of 10,218 proteins, including skeletal muscle specific transcription factors like myod1 and myogenin and circadian clock proteins. We obtain absolute abundances for proteins expressed in a muscle cell line and skeletal muscle, which should serve as a valuable resource. Quantitation of protein isoforms of glucose uptake signaling pathways and in glucose and lipid metabolic pathways provides a detailed metabolic map of the cell line compared with tissue. This revealed unexpectedly complex regulation of AMP-activated protein kinase and insulin signaling in muscle tissue at the level of enzyme isoforms.


Figures

Fig. 1.
Fig. 1.
Proteome analysis of mouse skeletal muscle. A, Protein lysates (triplicate) from mouse triceps muscle and C2C12 were digested on FASP filter and peptides were separated on an OFFGEL fractionator. Each fraction was analyzed by LCMS on a Q Exactive mass spectrometer. Representative spectrum from skeletal muscle, B, and C2C12 myotubes, C, at MS and MSMS levels. D, Number of protein identification without match between runs (black) and with match between runs option (gray). E, Total number of proteins identified in skeletal muscle and C2C12 cells.
Fig. 2.
Fig. 2.
Cumulative and ranked protein abundance. A, Cumulative protein mass from highest to lowest abundant proteins. B, Ranked protein abundances from highest to the lowest. C, Screenshot of the MaxQB database. Query protein for glucose transporter slc2a1 (I) returns the search results (II). Selection of protein slc2a1 displays the details on this protein (III). By clicking the expression tab in II, protein expression plots in skeletal muscle (Expt_1, 2, 3) and C2C12 myotubes (Expt_4, 5, 6) are displayed (IV).
Fig. 3.
Fig. 3.
Functional differences between C2C12 myotubes and adult skeletal muscle. A, Histogram of total proteins identified in skeletal muscle and C2C12 myotubes (gray) and proteins that are significantly changing between the skeletal muscle and C2C12 myotubes (blue). B, Hierarchical clustering of significantly changing proteins. Cluster 1 (3,308 proteins) represents significantly down-regulated and Cluster 2 (1,002 proteins) significantly up-regulated proteins in skeletal muscle. Annotation categories below the respective clusters are representative examples from significantly enriched categories.
Fig. 4.
Fig. 4.
2D annotation distribution. Scatter plot of normalized annotation changes between skeletal muscle and C2C12 myotubes. Calculation of significance is detailed under “Experimental Procedures.” The annotations analyzed were: KEGG (purple), GOMF (green), GOCC (blue), and GOBP (red).
Fig. 5.
Fig. 5.
Absolute abundance of insulin and AMPK signaling. A, Proteins involved in insulin and AMPK mediated glucose uptake in skeletal muscle (33, 38). Absolute abundance (described under “Experimental Procedures”) of glucose transporter 1 and 4. B, Rab GTPases-activating proteins, C, Rab proteins, D, protein 14–3-3 isoforms, E, members of AMPK, F. and insulin G, signaling. Error bar are standard deviation of median.
Fig. 6.
Fig. 6.
A proteomic view of skeletal muscle metabolism. A, Schematic representation of glucose and lipid metabolism in skeletal muscle. B, Summed absolute abundance of glucose transporters (GLUT) and fatty acid transporters (FAT). C, Absolute abundance of glycogen synthase (Gys), glycogen phosphorylase (Pyg) and glycogen synthase kinase 3 (Gsk3). D, Total abundance (%) of metabolic pathways. Total abundance is calculated by summing up absolute abundance of individual enzyme from respective pathways (supplemental Table S6). E and F, Percent contribution abundance of contractile proteins, metabolic pathways and other process in skeletal muscle and C2C12 myotubes. Error bars are standard deviation of median.

References

    1. DeFronzo R. A., Gunnarsson R., Bjorkman O., Olsson M., Wahren J. (1985) Effects of insulin on peripheral and splanchnic glucose metabolism in noninsulin-dependent (type II) diabetes mellitus. J. Clin. Invest. 76, 149–155 - PMC - PubMed
    1. Chibalin A. V., Yu M., Ryder J. W., Song X. M., Galuska D., Krook A., Wallberg-Henriksson H., Zierath J. R. (2000) Exercise-induced changes in expression and activity of proteins involved in insulin signal transduction in skeletal muscle: differential effects on insulin-receptor substrates 1 and 2. Proc. Natl. Acad. Sci. U.S.A. 97, 38–43 - PMC - PubMed
    1. Booth F. W., Thomason D. B. (1991) Molecular and cellular adaptation of muscle in response to exercise: perspectives of various models. Physiol. Rev. 71, 541–585 - PubMed
    1. Hawley J. A. (2002) Adaptations of skeletal muscle to prolonged, intense endurance training. Clin. Exp. Pharmacol. Physiol. 29, 218–222 - PubMed
    1. DeFronzo R. A., Bonadonna R. C., Ferrannini E. (1992) Pathogenesis of NIDDM. A balanced overview. Diabetes Care 15, 318–368 - PubMed

Publication types