

Alzheimer-associated Aβ oligomers impact the central nervous system to induce peripheral metabolic deregulation
- PMID: 25617315
- PMCID: PMC4328648
- DOI: 10.15252/emmm.201404183
Alzheimer-associated Aβ oligomers impact the central nervous system to induce peripheral metabolic deregulation
Abstract
Alzheimer's disease (AD) is associated with peripheral metabolic disorders. Clinical/epidemiological data indicate increased risk of diabetes in AD patients. Here, we show that intracerebroventricular infusion of AD-associated Aβ oligomers (AβOs) in mice triggered peripheral glucose intolerance, a phenomenon further verified in two transgenic mouse models of AD. Systemically injected AβOs failed to induce glucose intolerance, suggesting AβOs target brain regions involved in peripheral metabolic control. Accordingly, we show that AβOs affected hypothalamic neurons in culture, inducing eukaryotic translation initiation factor 2α phosphorylation (eIF2α-P). AβOs further induced eIF2α-P and activated pro-inflammatory IKKβ/NF-κB signaling in the hypothalamus of mice and macaques. AβOs failed to trigger peripheral glucose intolerance in tumor necrosis factor-α (TNF-α) receptor 1 knockout mice. Pharmacological inhibition of brain inflammation and endoplasmic reticulum stress prevented glucose intolerance in mice, indicating that AβOs act via a central route to affect peripheral glucose homeostasis. While the hypothalamus has been largely ignored in the AD field, our findings indicate that AβOs affect this brain region and reveal novel shared molecular mechanisms between hypothalamic dysfunction in metabolic disorders and AD.
Keywords: Alzheimer's disease; ER stress; hypothalamus; inflammation; insulin resistance.
© 2015 The Authors. Published under the terms of the CC BY 4.0 license.
Figures
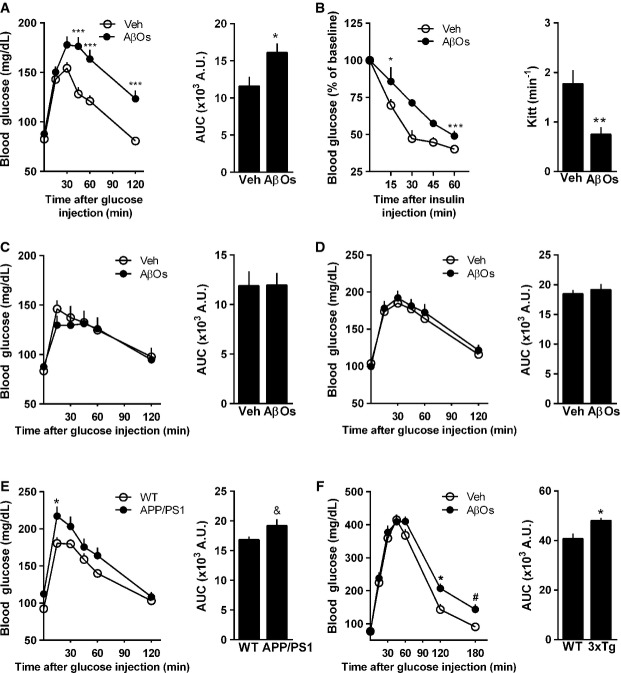
Adult Swiss mice (n = 11 Veh; 15 AβOs) received a single i.c.v. injection of vehicle or 10 pmol AβOs and were assessed in a glucose tolerance test (2 g glucose/kg body weight, i.p.) 7 days after injection. Blood levels of glucose were measured at several time points following glucose administration. Bar graph represents areas under the curves in the time course plot. Data are representative of three independent experiments with similar results. Left panel: ***P = 0.0006, two-way ANOVA followed by Bonferroni post hoc test; right panel: *P = 0.0207, Student's t-test.
Insulin tolerance test (1 IU insulin/kg body weight, i.p.) (n = 7 Veh; 8 AβOs). Blood levels of glucose were measured at several time points following insulin administration. Bar graph represents the kinetic constants for glucose disappearance (Kitt) calculated from the time course plot. Data are representative of two independent experiments with similar results. Left panel: *P = 0.0456 and ***P = 0.0007, two-way ANOVA followed by Bonferroni post hoc test; right panel: **P = 0.0033, Student's t-test.
Glucose tolerance test (2 g glucose/kg body weight, i.p.) in mice 7 days after a single intracaudal (C; n = 8 animals/group) or intraperitoneal (D; n = 13 animals/group) injection of AβOs (10 pmol) or vehicle.
Glucose tolerance test (2 g glucose/kg body weight, i.p.) in 8- to 13-month-old APP/PS1 mice (E; n = 9 animals/group) or 6-month-old 3xTg-AD male mice (F; n = 10 WT; 9 3xTg), or their corresponding wild-type littermates. Bar graph represents areas under the curves in the time course plots. In (E), left panel: *P = 0.0466, two-way ANOVA followed by Bonferroni post hoc test; right panel: &P = 0.072, Student's t-test. In (F), left panel: *P = 0.0171 and #P = 0.0781, two-way ANOVA followed by Bonferroni post hoc test; right panel: *P = 0.0101, Student's t-test.
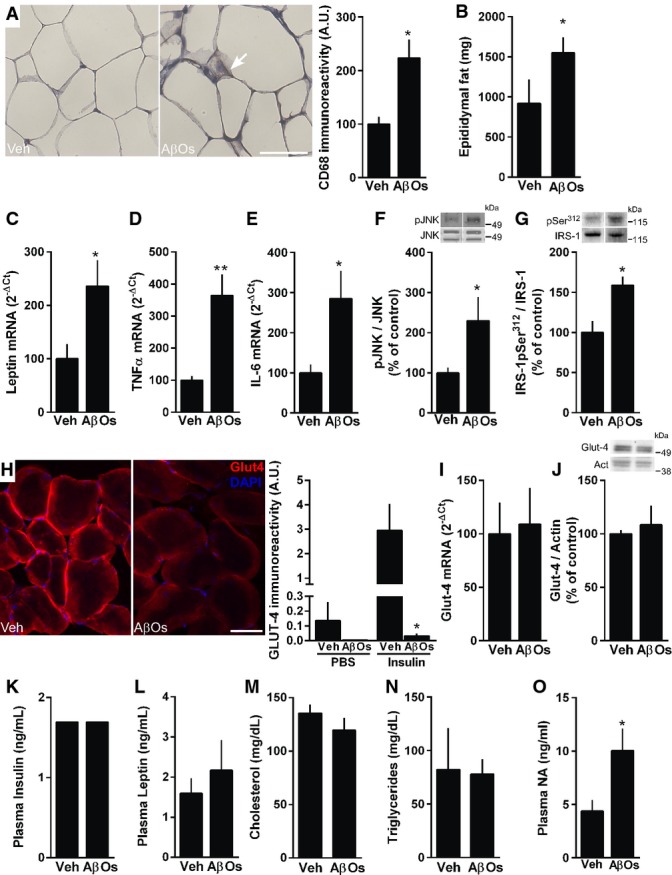
CD68 immunoreactivity in white adipose tissue (scale bar = 25 μm, images representative of one animal each from a total of four animals per experimental group). Arrow points to a region stained with CD68 antibody. *P = 0.0109, Student's t-test.
Epididymal fat mass was analyzed in mice (n = 6 animals/group) 7 days after i.c.v. injection of vehicle or AβOs. Data are representative of three independent experiments with similar results. *P = 0.0255.
Relative expression of leptin (C), TNF-α (D) and IL-6 (E), respectively, in white adipose tissue of mice (n = 7 Veh; 9 AβOs) 7 days after i.c.v. injection of vehicle or AβOs. In (C), *P = 0.0394; in (D), **P = 0.0038; in (E), *P = 0.0305; Student's t-test.
p-JNK (F; n = 5 animals/group) and IRS-1pSer312 (G; n = 6 animals/group) levels (normalized by total JNK and total IRS-1, respectively) in skeletal muscle of mice 7 days after i.c.v. injection of vehicle or AβOs. In (F), *P = 0.0464; in (G), *P = 0.0081; Student's t-test.
Representative images of GLUT-4 immunofluorescence in insulin-stimulated skeletal muscle from mice that were i.c.v.-injected with vehicle (Veh) or 10 pmol AβOs. Bar graphs show quantification of GLUT-4 surface immunoreactivity in skeletal muscle of mice that received intraperitoneal injections of PBS or insulin (1 IU/kg body weight) 7 days after i.c.v. injection of vehicle or AβOs, as indicated (n = 5 animals/group). Scale bar = 25 μm. *P = 0.0144, one-way ANOVA followed by Bonferroni post hoc test.
GLUT-4 mRNA (n = 4 animals/group) and total protein levels (normalized to actin levels; n = 5 Veh; 6 AβOs) were unchanged in skeletal muscle of Swiss mice injected with vehicle (Veh) or 10 pmol AβOs.
Plasma levels of insulin (K; n = 12 animals/group), leptin (L; n = 11 Veh; 12 AβOs), cholesterol (M; n = 8 Veh; 6 AβOs), triglycerides (N; n = 8 Veh; 6 AβOs) or noradrenaline (O; n = 7 Veh; 8 AβOs) measured 7 days after i.c.v. injection of vehicle (Veh) or 10 pmol AβOs. In (O), *P = 0.0361, Student's t-test.
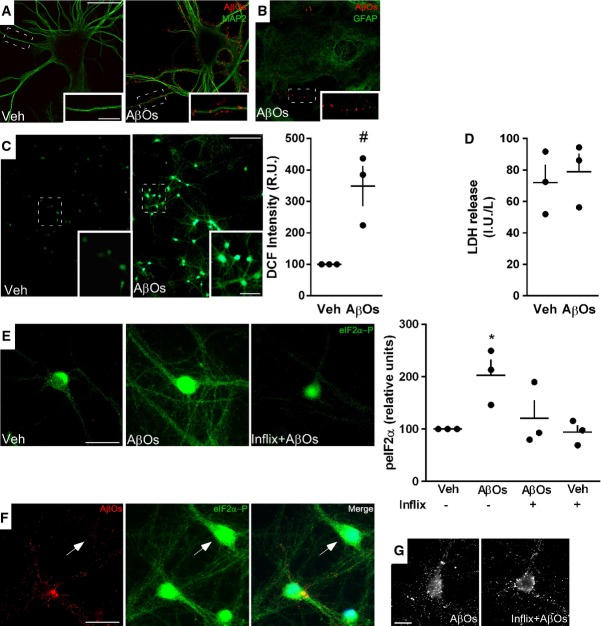
Representative immunocytochemistry images of mature hypothalamic neurons in culture exposed to vehicle (Veh) or AβOs (500 nM) for 3 h. Binding of AβOs was detected using anti-oligomer monoclonal antibody NU4 (red). Neurons were double-labeled using MAP-2 antibody (green). Images represent typical results from experiments with three independent hypothalamic cultures (three coverslips/experimental condition per independent experiment). Scale bar = 30 and 10 μm for main panels and insets, respectively.
Representative immunocytochemistry image of mature hypothalamic culture exposed to AβOs (500 nM) and immunolabeled with anti-GFAP (green) and NU4 (red) antibodies. Insets show AβOs binding to neuronal dendrites, whereas no binding was detected to GFAP-positive cells.
Representative DCF fluorescence images from hypothalamic neuronal cultures exposed to vehicle or AβOs (500 nM, 4 h). Insets show optical zoom images of the indicated areas. Scale bars = 100 and 50 μm for main panels and insets, respectively. Graph shows integrated DCF fluorescence intensities (relative units; see Materials and Methods) (n = 3 independent hypothalamic cultures; three wells/experimental condition per experiment; three images acquired per well). Bars represent means ± SEM. #P = 0.0604, one-sample t-test compared with a fixed value of 100 RUs.
LDH activity (IU/l) in culture media of hypothalamic cultures exposed to vehicle or AβOs (500 nM, 3 h).
Representative immunofluorescence images of eIF2α-P in hypothalamic cultures exposed to vehicle or AβOs (500 nM, 3 h) in the absence or presence of infliximab (1 μg/ml). Scale bar = 30 μm. Graph represents integrated immunofluorescence intensities of eIF2α-P levels from three independent hypothalamic cultures (three coverslips/experimental condition per experiment, 20 images per coverslip). Bars represent means ± SEM. *P = 0.0489, one-way ANOVA followed by Bonferroni post hoc test comparing AβO-treated versus vehicle-treated cultures.
Representative images of hypothalamic cultures exposed to AβOs (500 nM, 3 h) and double-labeled with NU4 (oligomer-sensitive) and eIF2α-P antibodies. Arrow points to a neuron presenting high levels of eIF2α-P in the absence of AβO binding. Nuclear staining (DAPI) is shown in blue. Scale bar = 30 μm.
Representative images of hypothalamic neurons labeled with NU4 antibody exposed to AβOs (500 nM, 3 h) in the absence or presence of infliximab (1 μg/ml). Similar patterns of AβO binding were observed in both conditions. Scale bar = 20 μm.
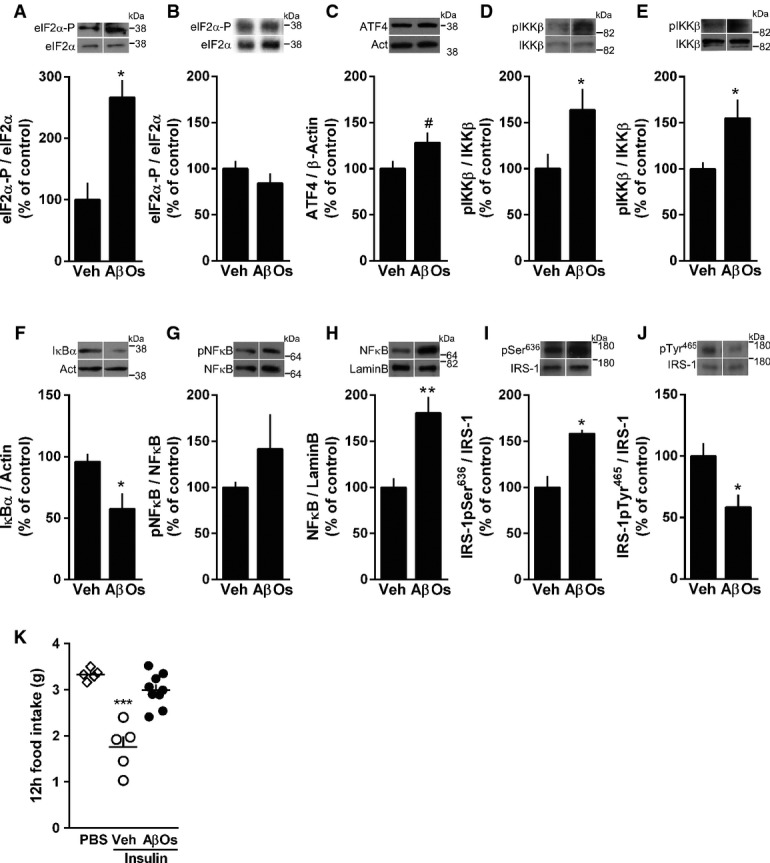
Western blot analysis of eIF2α-P levels in the hypothalamus of mice 4 h (A; n = 4 animals/group) or 7 days (B; n = 6 Veh; 5 AβOs) after a single i.c.v. injection of vehicle (Veh) or 10 pmol AβOs. Graphs show densitometric data normalized by total eIF2α levels. *P = 0.0213.
Western blot analysis of ATF4 levels in the hypothalamus of mice 4 h after i.c.v. injection of vehicle (Veh) or 10 pmol AβOs; graph shows densitometric data normalized by β-actin (n = 7 Veh; 8 AβOs). #P = 0.0731; Student's t-test.
Western blot analysis of hypothalamic phospho-IKKβ levels in the hypothalamus of mice 4 h (C; n = 6 animals/group) or 7 days (D; n = 4 Veh; 5 AβOs) after i.c.v. injection of vehicle or 10 pmol AβOs. Graphs show densitometric data normalized by total IKKβ levels. In (D), *P = 0.0437; in (E), *P = 0.0444; Student's t-test.
Western blot analysis of IκBα (F; n = 6 animals/group) and cytoplasmic phospho-p65-NF-κB (G; n = 4 Veh; 5 AβOs) in the hypothalamus of mice 4 h after i.c.v. injection of vehicle or 10 pmol AβOs. Graphs show densitometric data normalized by actin (F) or total NF-κB levels (G). *P = 0.0207.
Nuclear NF-κB levels in the hypothalamus 6 h after i.c.v. injection of vehicle or 10 pmol AβOs in mice. Graphs show NF-κB levels normalized by nuclear marker, lamin B (n = 6 animals/group). **P = 0.0024; Student's t-test.
IRS-1pSer636 (I; n = 4 animals/group) and pTyr465 (J; n = 6 Veh; 4 AβOs) levels in the hypothalamus 7 days after i.c.v. injection of vehicle or AβOs in mice. Graphs show IRS-1pSer or IRS-1pTyr levels normalized by total IRS-1. In (I), *P = 0.0043; in (J), *P = 0.0275; Student's t-test.
Twelve-hour food intake after a single i.c.v. infusion of insulin (200 mU) in mice. Experiment was performed 7 days after i.c.v. injection of vehicle or AβOs (n = 5 PBS; 5 Veh + Insulin; 9 AβOs + Insulin), data are representative of two independent experiments with similar results. ***P < 0.0001, one-way ANOVA followed by Bonferroni post hoc test comparing Veh-Insulin versus PBS groups.
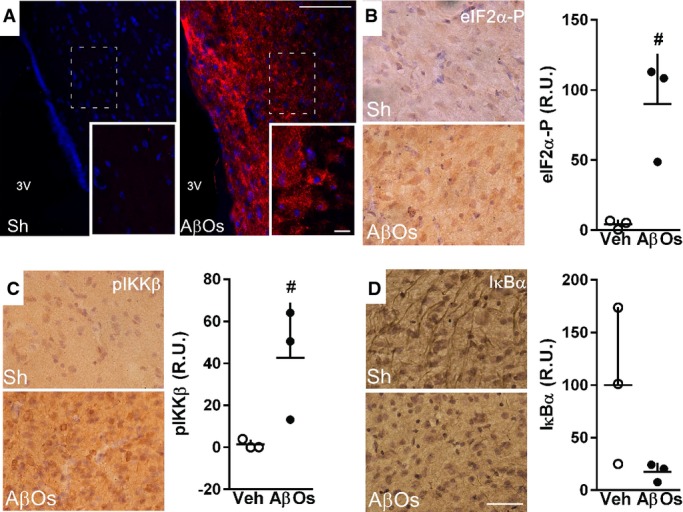
Representative images of AβO immunoreactivity (detected using anti-oligomer monoclonal antibody NU4) in the hypothalamus of control, sham-operated adult cynomolgus macaques (Sh; n = 3) or macaques that received i.c.v. injections of AβOs (n = 3; see Materials and Methods). Nuclear staining (DAPI) is shown in blue. Insets show optical zoom images of the areas indicated by white dashed rectangles in the main panels. Scale bars = 100 and 20 μm for main panels and insets, respectively.
Representative images showing eIF2α-P (B), phospho-IKKβ (C) and IκBα (D) immunoreactivities in the hypothalamus of cynomolgus macaques that received i.c.v. injections of AβOs or control (sham-operated; Sh) macaques (n = 3 animals/group). Graphs show immunolabeling optical density analysis from three images acquired in the hypothalamus of each macaque (three control versus three AβO-injected animals). In (B), #P = 0.0523; in (C) #P = 0.1123; unpaired Student's t-test with Welch's correction for unequal variances; AβO-injected monkeys compared to sham-operated monkeys. Scale bars = 50 μm
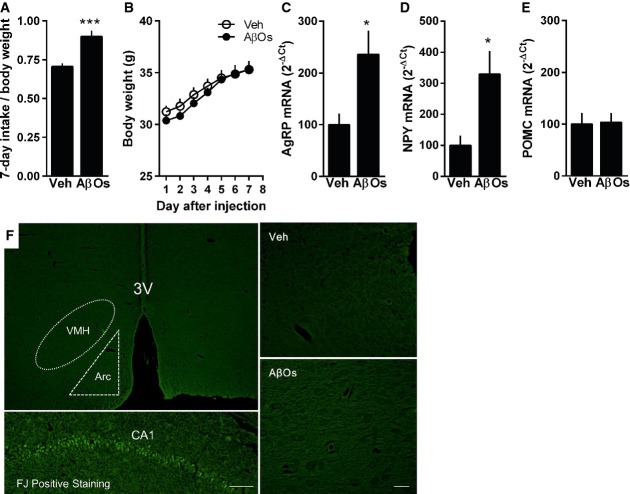
Accumulated chow intake (normalized by body weight) measured during 7 days following a single i.c.v. injection of vehicle or 10 pmol AβOs in mice (n = 13 Veh; 10 AβOs; data are representative of two independent experiments with similar results). ***P < 0.0001; Student's t-test.
Daily body weight measured during 7 days after i.c.v. injection of vehicle or AβOs (n = 7 animals/group; data are representative of two independent experiments with similar results).
Adult Swiss mice received a single i.c.v. injection of vehicle or 10 pmol AβOs, and hypothalamic levels of mRNA for AgRP (C; n = 6 Veh; 5 AβOs), NPY (D; n = 6 Veh; 5 AβOs) and POMC (E; n = 7 animals/group) were analyzed 7 days after injection. In (C), *P = 0.0191; in (D), *P = 0.0115; Student's t-test.
Swiss mice received a single i.c.v. injection of vehicle (Veh) or 10 pmol AβOs, and their brains were analyzed by Fluorojade staining of degenerating cells 7 days after the injection. Representative images of Fluorojade staining in the hypothalamus of vehicle- or AβO-injected mice (n = 4/group). Scale bar = 100 μm in left panels (top and bottom) and 20 μm in right panels (top and bottom). Positive control (bottom left panel) was the hippocampus of a mouse that received one i.c.v. injection of quinolinic acid (36.8 nmol) and was analyzed 24 h after.
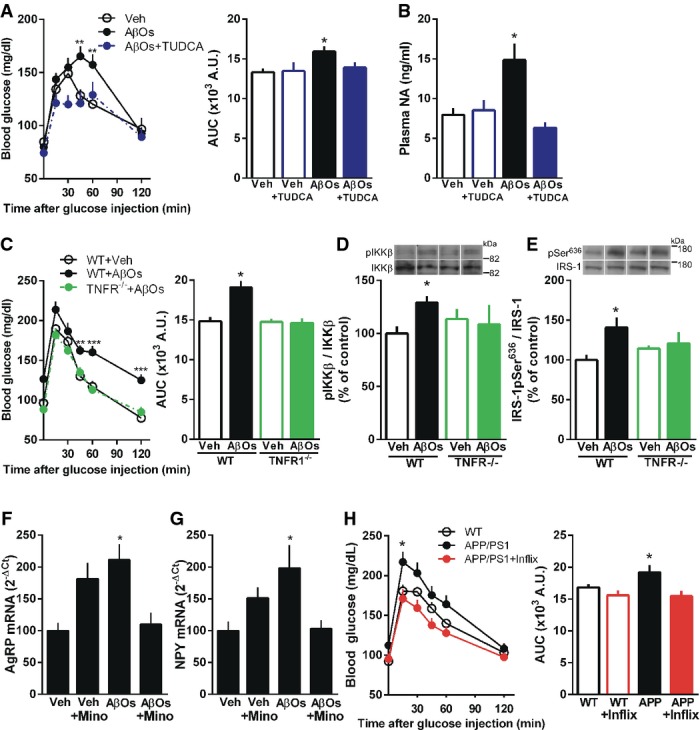
Glucose tolerance test (2 g glucose/kg body weight, i.p.) in mice that received i.c.v. injections of vehicle, vehicle + TUDCA, AβOs or AβOs + TUDCA (when used, TUDCA was administered in 5 i.c.v. injections of 5 μg TUDCA each, before and after oligomer injection; see Materials and Methods. Control groups received injections of saline). Glucose tolerance test (GTT) was performed 7 days after i.c.v. injection of vehicle or AβOs. Bar graph represents areas under the curves (AUC) in the time course plots (n = 15 Veh; 15 AβOs; 10 Veh + TUDCA; 16 AβOs + TUDCA). Data are representative of two independent experiments with similar results. Left panel: **P = 0.0048, **P = 0.003, two-way ANOVA followed by Bonferroni post hoc test; right panel: *P = 0.0384, one-way ANOVA followed by Bonferroni post hoc test.
Plasma noradrenaline (NA) levels measured 7 days after i.c.v. injection of vehicle, vehicle + TUDCA, AβOs or AβOs + TUDCA in mice (n = 7 animals/group). Data are representative of two independent experiments with similar results. *P = 0.0071, one-way ANOVA followed by Bonferroni post hoc test.
Glucose tolerance test (2 g glucose/kg body weight, i.p.) in TNFR1−/− mice or wild-type littermates performed 7 days after i.c.v. injection of vehicle or AβOs. Bar graph represents areas under the curves (AUC) in the time course plots (n = 8 WT + Veh; 7 WT + AβOs; 7 TNFR−/− + Veh; 8 TNFR−/− + AβOs). Left panel: **P = 0.0049, ***P < 0.0001, two-way ANOVA followed by Bonferroni post hoc test; right panel: *P = 0.0001, one-way ANOVA followed by Bonferroni post hoc test.
Western blot analysis of phospho-IKKβ (D; n = 6 WT + Veh; 6 WT + AβOs; 4 TNFR−/− + Veh; 6 TNFR−/− + AβOs) and IRS-1pSer636 levels (E; n = 6 WT + Veh; 5 WT + AβOs; 6 TNFR−/− + Veh; 5 TNFR−/− + AβOs) in the hypothalamus of wild-type (WT) or TNFR1−/− mice 10 days after i.c.v. injection of vehicle or AβOs. Representative images from Western blot experiments were always run on the same gels but represent noncontiguous lanes. In (D), *P = 0.0088, Student's t-test; in (E), *P = 0.0428, one-way ANOVA followed by Bonferroni post hoc test.
Adult Swiss mice pre-treated with minocycline or PBS received a single i.c.v. injection of vehicle or 10 pmol AβOs, and hypothalamic levels of mRNA for AgRP (F; n = 5 Veh; 6 AβOs; 5 Veh + Mino; 4 AβOs + Mino) and NPY (G; n = 14 Veh; 13 AβOs; 8 Veh + Mino; 9 AβOs + Mino) were analyzed 7 days after injection. In (F), *P = 0.0097, one-way ANOVA followed by Bonferroni post hoc test; in (G), *P = 0.0219, one-way ANOVA followed by Bonferroni post hoc test.
Glucose tolerance test (GTT) in APP/PS1 mice before and after i.c.v. injection of infliximab (0.2 μg daily for 4 days). Bar graph represents areas under the curves (AUC) in the time course plots (n = 9 animals/group). Left panel: *P = 0.0177, two-way ANOVA followed by Bonferroni post hoc test; right panel: *P = 0.0327, paired t-test.
References
-
- Arruda AP, Milanski M, Coope A, Torsoni AS, Ropelle E, Carvalho DP, Carvalheira JB, Velloso LA. Low-grade hypothalamic inflammation leads to defective thermogenesis, insulin resistance, and impaired insulin secretion. Endocrinology. 2011;152:1314–1326. - PubMed
-
- Bomfim TR, Forny-Germano L, Sathler LB, Brito-Moreira J, Houzel JC, Decker H, Silverman MA, Kazi H, Melo HM, McClean PL, et al. An anti-diabetes agent protects the mouse brain from defective insulin signaling caused by Alzheimer's disease- associated Abeta oligomers. J Clin Invest. 2012;122:1339–1353. - PMC - PubMed
-
- Costa RO, Lacor PN, Ferreira IL, Resende R, Auberson YP, Klein WL, Oliveira CR, Rego AC, Pereira CM. Endoplasmic reticulum stress occurs downstream of GluN2B subunit of N-methyl-d-aspartate receptor in mature hippocampal cultures treated with amyloid-beta oligomers. Aging Cell. 2012;11:823–833. - PubMed
Publication types
MeSH terms
Substances
LinkOut - more resources
Full Text Sources
Other Literature Sources
Medical
Molecular Biology Databases
