

From intracellular signaling to population oscillations: bridging size- and time-scales in collective behavior
- PMID: 25617347
- PMCID: PMC4332153
- DOI: 10.15252/msb.20145352
From intracellular signaling to population oscillations: bridging size- and time-scales in collective behavior
Abstract
Collective behavior in cellular populations is coordinated by biochemical signaling networks within individual cells. Connecting the dynamics of these intracellular networks to the population phenomena they control poses a considerable challenge because of network complexity and our limited knowledge of kinetic parameters. However, from physical systems, we know that behavioral changes in the individual constituents of a collectively behaving system occur in a limited number of well-defined classes, and these can be described using simple models. Here, we apply such an approach to the emergence of collective oscillations in cellular populations of the social amoeba Dictyostelium discoideum. Through direct tests of our model with quantitative in vivo measurements of single-cell and population signaling dynamics, we show how a simple model can effectively describe a complex molecular signaling network at multiple size and temporal scales. The model predicts novel noise-driven single-cell and population-level signaling phenomena that we then experimentally observe. Our results suggest that like physical systems, collective behavior in biology may be universal and described using simple mathematical models.
Keywords: FRET; dynamical systems; live microscopy; phenomenological modeling.
© 2015 The Authors. Published under the terms of the CC BY 4.0 license.
Figures
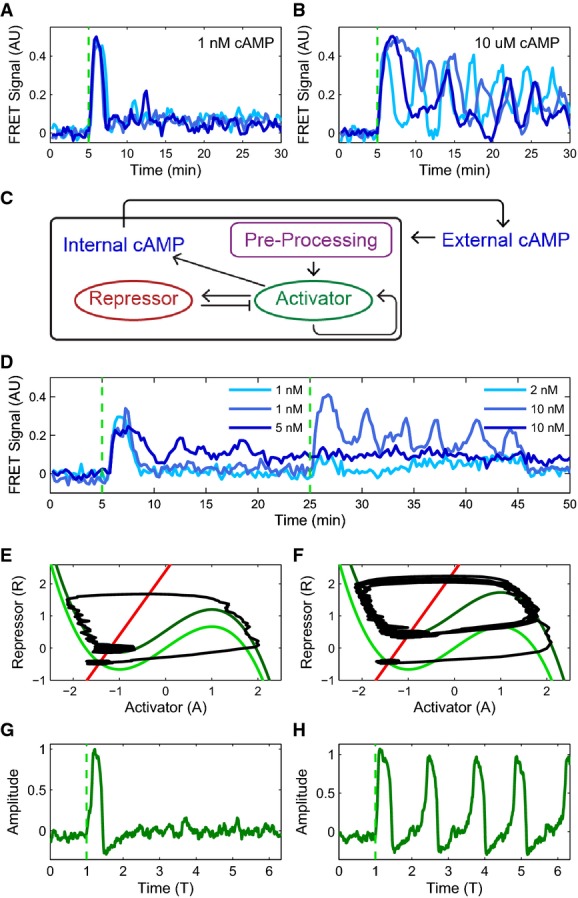
Experimental observation of a bifurcation: cytosolic cAMP responses to an externally applied cAMP stimulus of 1 nM (A) and 10 μM (B) at 5 min in three single Dictyostelium cells expressing an Epac1camps-FRET sensor (cells stimulated using a custom microfluidics device (see Supplementary Fig S2); FRET signal is a normalized ratiometric fluorescence intensity measurement proportional to cytosolically produced cAMP (Salonikidis et al, 2008); see Materials and Methods).
Schematic of proposed model (see text for details).
Cytosolic cAMP responses of single cells in microfluidic devices to successive externally applied cAMP stimuli of 1 nM (light and medium blue) or 5 nM (dark blue) followed by 2 nM (light blue) or 10 nM (medium and dark blue) step.
Phase portraits for a small (E) and a large (F) step stimulus (corresponding to (A) and (B), respectively), with repressor (R) nullcline (i.e., dR/dt = 0) shown in red and activator (A) nullclines (i.e., dA/dt = 0) shown in green (see text for model details). For the activator, two nullclines are shown corresponding to a pre-stimulus (light green) and a post-stimulus (dark green) regime. A fixed point for the dynamics occurs where the S-shaped activator nullcline intersects the repressor nullcline (red line). The response trajectory is shown in black. See Supplementary Fig S3 for details about the FHN model fixed point behavior.
Activator variable as a function of time for (G) a small stimulus (corresponding to A, E) and (H) a large stimulus (corresponding to B, F; green dashed line indicates stimulus onset).
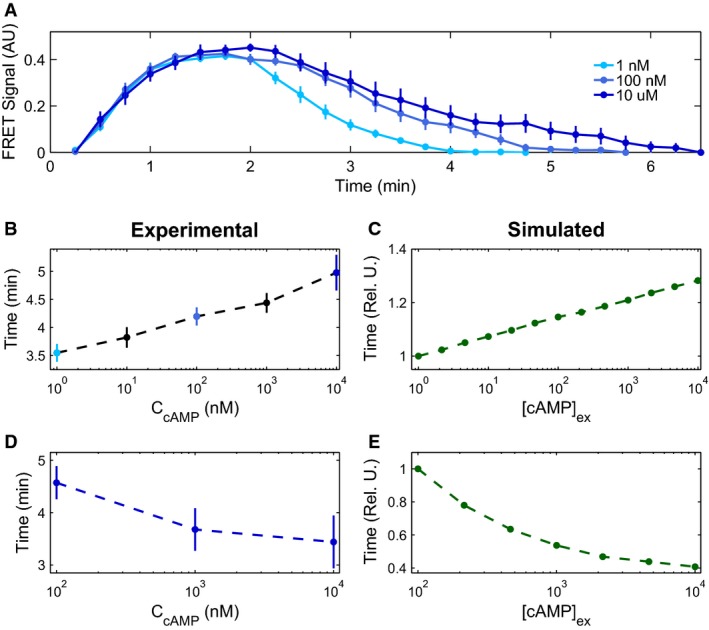
Experimental mean accommodation spikes of cells in microfluidic devices for externally applied cAMP stimuli of 1 nM (light blue), 100 nM (medium blue), and 10 μM (dark blue) (see main text for discussion). Error bars represent SEM.
Experimental (n = 16, 14, 14, 20, and 11 cells) (B) and modeled (C) mean initial accommodation spike widths. Error bars represent SEM. Colored data points in (B) correspond to data in (A), with additional mean accommodation spike widths taken at 10 nM and 1 μM.
Experimental (n = 11, 16, 10 cells) (D) and modeled (E) mean oscillation times, with experimental mean oscillations found by identifying the peak Fourier transform. Error bars represent errors by bootstrapping.
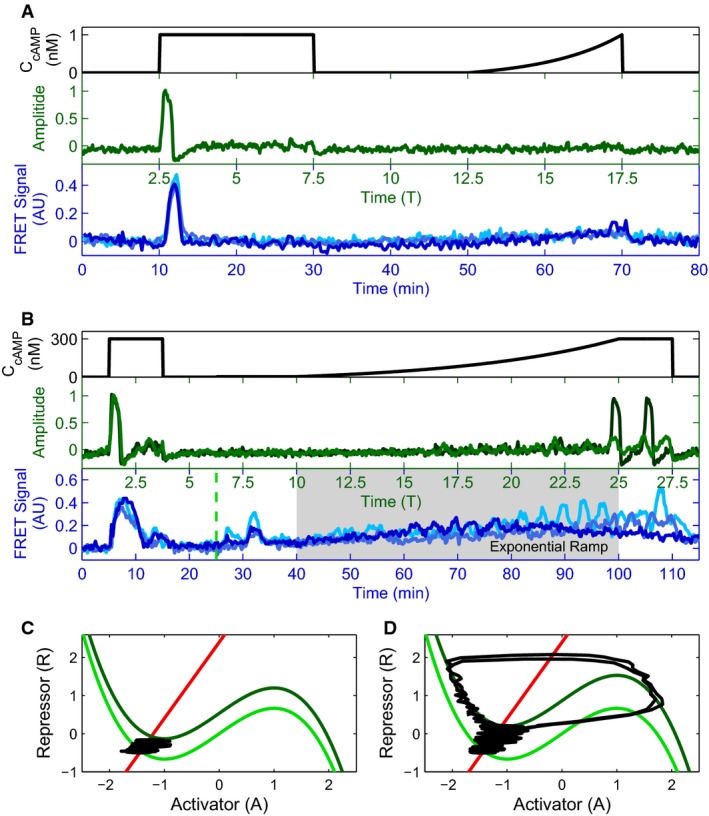
Externally applied cAMP stimuli (black) with a step and an exponential ramp to a final height of 1 nM cAMP (A), and with a small intermediate step (3 nM height, ranging from green dashed line at 25–40 min to give system time to equilibrate), and an exponential ramp to a final height of 300 nM cAMP (time of experimental ramp denoted with gray background, ranging from time 40–100 min) (B). Corresponding activator variable (green) and experimental data for three cells in microfluidic devices (blues) as a function of time are shown below. Model traces are shown for two different degrees of cellular excitability, ∈ = 0.1 (light green) and 0.2 (dark green), showing a diversity of responses similar to that seen experimentally.
Phase portraits for a small (C) and a large (D) exponential ramp stimulus (corresponding to (A) and (B), respectively); R nullcline shown in red, pre-stimulus A nullcline shown in light green, and post-stimulus A nullcline in dark green. The response trajectory is shown in black.
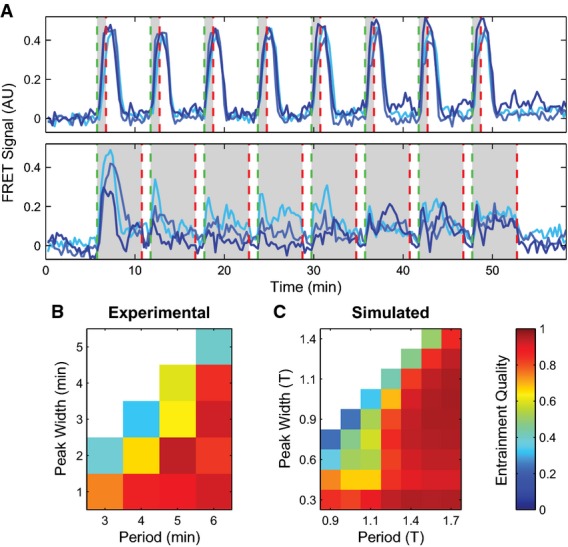
Cytosolic cAMP responses of single cells in microfluidic devices to externally applied 10 nM cAMP pulses of 1 min (top) and 5 min (bottom) with a 6-min period (green dashed lines indicate stimulus onsets; red dashed lines indicate stimulus conclusions).
Phase diagrams summarizing 63 single-cell experimental (B) and simulated (C) responses to various pulse widths and periods. “Entrainment Quality” is the mean Pearson correlation coefficient between the first period response and subsequent responses and is represented in color. Red regions display high correlation, while blue regions have low correlation.

A phase diagram showing the coordinated population firing rate spanning a range of cell densities and flow rates for the model (A) and experiments in macrofluidic dishes from Gregor et al (2010) (B), with the mean firing rate represented in color, and white vertical lines indicate nonlinear breaks in the x-axis.
Firing rates can also be considered as a function of the ratio between cell density and flow rate, ρ/J, as predicted by the model (C) and shown experimentally using macrofluidic dishes in Gregor et al (2010) (D). Low flow rates are not plotted in (D) because in this regime, the effect of extracellular PDE is non-negligible. Model firing rates are normalized to an arbitrarily high frequency (˜1/30) to scale maximum values to 1.
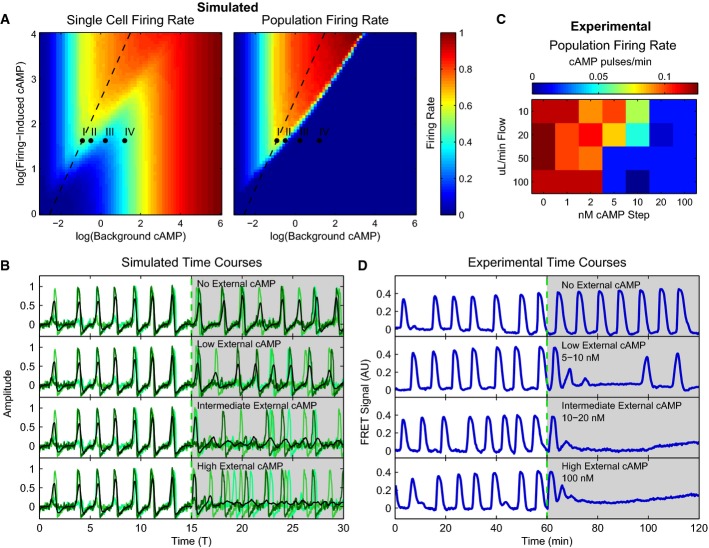
Firing rate phase diagrams for single cells in a population and the population as a whole as predicted by our model as a function of background and firing-induced cAMP.
Average “internal cAMP” responses of single simulated cells within a population (greens) and the population mean (black) responses at Points I–IV in (A) as simulated by the model.
Firing rate of 43 experimental populations in microfluidic devices with increasing external cAMP as a function of flow rate for cells plated at >0.5 ML (1 ML = 6,600 cells/mm2), imaged 2 mm from population edge. All spikes at least 0.3 FRET signal units in height.
Experimental population average cytosolic cAMP levels for experiments in microfluidic devices with 10 μl/min flow for no externally applied cAMP, 10 nM (low), 20 nM (intermediate), and 100 nM (high) steps of externally applied cAMP. Depending on fluid flow rates and externally applied cAMP levels, populations oscillate, have slow synchronous oscillations, do not oscillate but randomly fire, or oscillate asynchronously (stimulus onset for all assays is at 60 min).
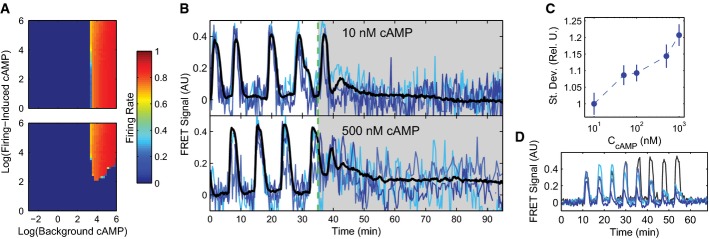
Firing rate phase diagrams for single cells in a population (top) and the population as a whole (bottom) as predicted by the model with minimal noise (σ = 0.01) as a function of background and firing-induced cAMP. See Supplementary Fig S4 for other noise-source cases.
Example single-cell (blues) and population (black) cytosolic cAMP traces taken from dual-expressing Epac1camps/mRFPmars tracer cells for oscillating populations at ˜0.4 ML density, 10 μl/min flow subjected to steps of 10 nM and 500 nM cAMP in microfluidic devices.
Mean standard deviations of the single-cell cytosolic cAMP levels for cells in 10 experimental populations inside microfluidic devices subjected to a step stimulus of cAMP as shown in (B) from 10 to 60 min post-stimulus. Values are normalized to the mean standard deviation of cells exposed to a 10 nM external cAMP step to show the relative increase in stochastic variability; errors by bootstrapping.
Single-cell cytosolic cAMP responses to eight 1-nM pulses, 6-min period with 1-min-long pulses (gray) and two 1-min, two 30-s, two 20-s, and two 10-s pulses (blues) given using microfluidic devices.
References
-
- Alcantara F, Monk M. Signal propagation during aggregation in the slime mould Dictyostelium discoideum. J Gen Microbiol. 1974;85:321–334. - PubMed
-
- Anderson PW. Basic Notions of Condensed Matter Physics. New York: Westview Press; 1997.
-
- Anderson JR, Chiu DT, Jackman RJ, Cherniavskaya O, McDonald JC, Wu H, Whitesides SH, Whitesides GM. Fabrication of topologically complex three-dimensional microfluidic systems in PDMS by rapid prototyping. Anal Chem. 2000;72:3158–3164. - PubMed
-
- Ballerini M, Cabibbo N, Candelier R, Cavagna A, Cisbani E, Giardina I, Orlandi A, Parisi G, Procaccini A, Viale M, Zdravkovic V. Empirical investigation of starling flocks: a benchmark study in collective animal behaviour. Anim Behav. 2008;76:201–215.
Publication types
MeSH terms
Grants and funding
LinkOut - more resources
Full Text Sources
Other Literature Sources
