. 2015 Jun 1;31(11):1745-53.
doi: 10.1093/bioinformatics/btv031. Epub 2015 Jan 22.

ASSIGN: context-specific genomic profiling of multiple heterogeneous biological pathways

Affiliations

ASSIGN: context-specific genomic profiling of multiple heterogeneous biological pathways

Ying Shen et al. Bioinformatics. .

Abstract

Motivation: Although gene-expression signature-based biomarkers are often developed for clinical diagnosis, many promising signatures fail to replicate during validation. One major challenge is that biological samples used to generate and validate the signature are often from heterogeneous biological contexts-controlled or in vitro samples may be used to generate the signature, but patient samples may be used for validation. In addition, systematic technical biases from multiple genome-profiling platforms often mask true biological variation. Addressing such challenges will enable us to better elucidate disease mechanisms and provide improved guidance for personalized therapeutics.

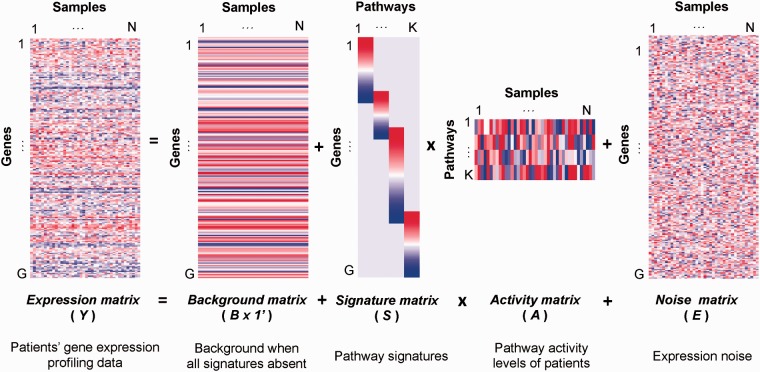
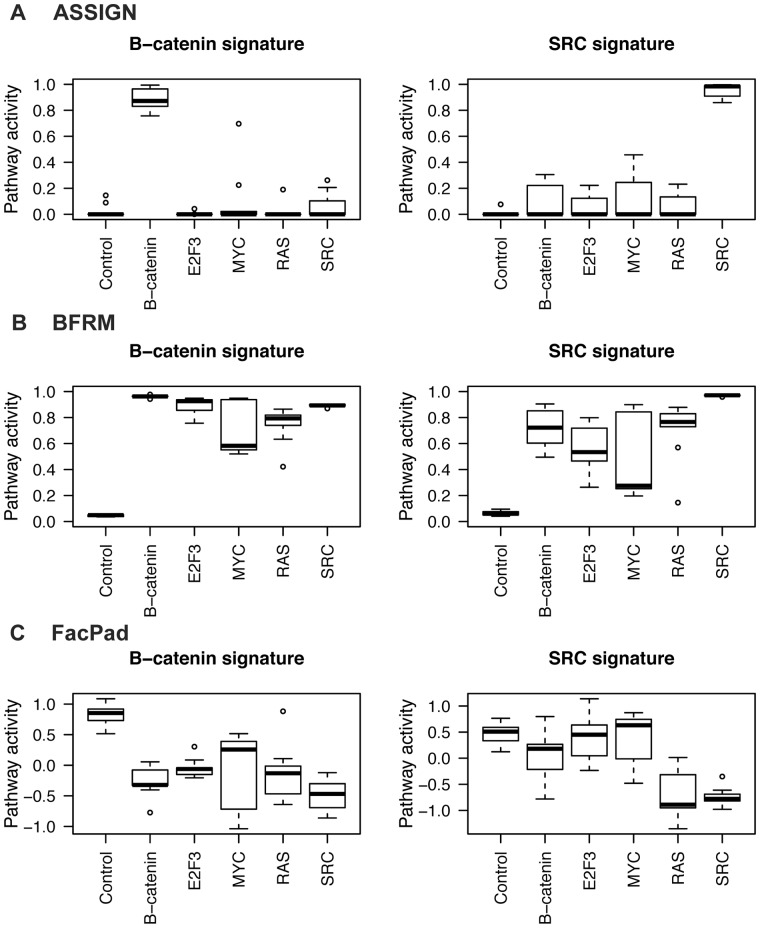
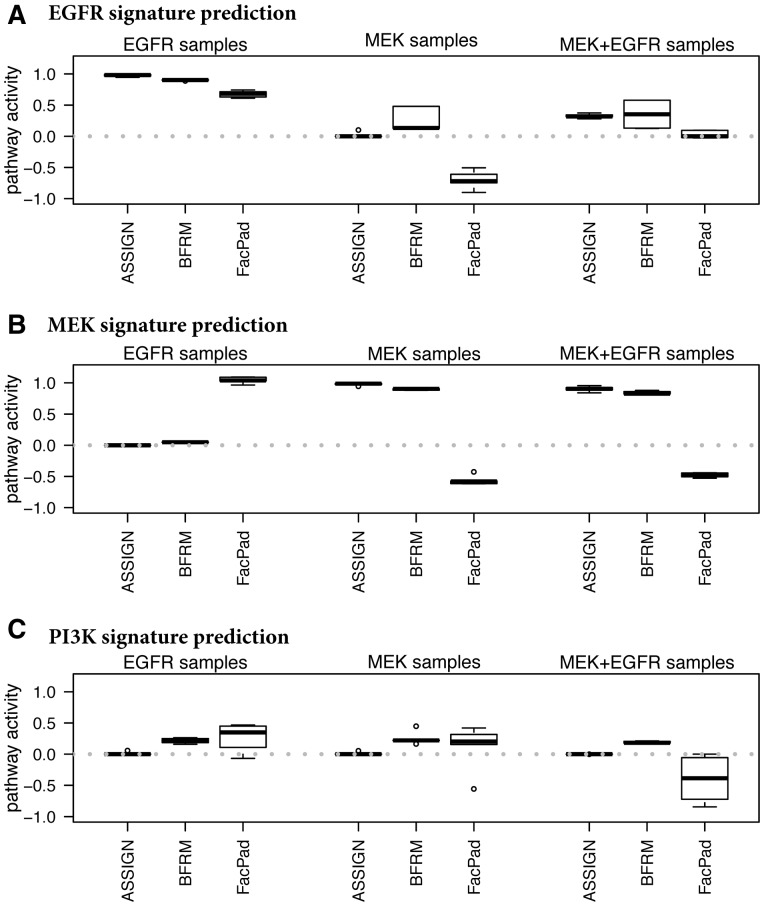
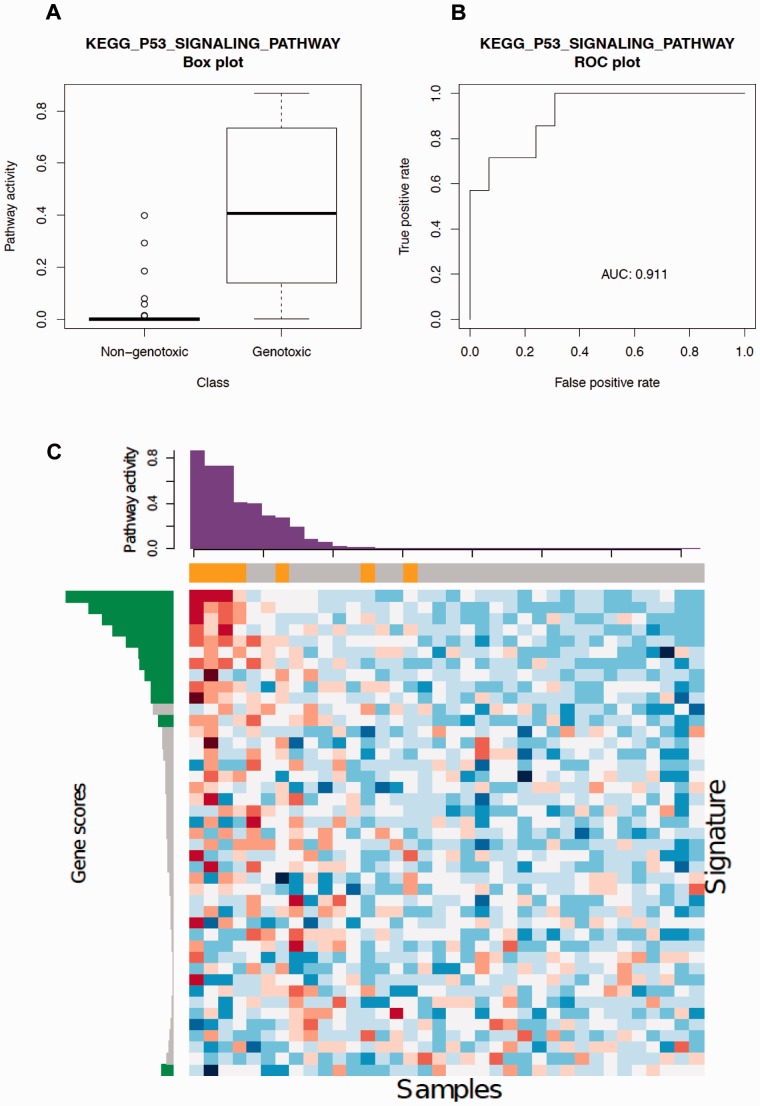
Results: Here, we present a pathway profiling toolkit, Adaptive Signature Selection and InteGratioN (ASSIGN), which enables robust and context-specific pathway analyses by efficiently capturing pathway activity in heterogeneous sets of samples and across profiling technologies. The ASSIGN framework is based on a flexible Bayesian factor analysis approach that allows for simultaneous profiling of multiple correlated pathways and for the adaptation of pathway signatures into specific disease. We demonstrate the robustness and versatility of ASSIGN in estimating pathway activity in simulated data, cell lines perturbed pathways and in primary tissues samples including The Cancer Genome Atlas breast carcinoma samples and liver samples exposed to genotoxic carcinogens.

Availability and implementation: Software for our approach is available for download at: http://www.bioconductor.org/packages/release/bioc/html/ASSIGN.html and https://github.com/wevanjohnson/ASSIGN.


Figures

Fig. 1.
Fig. 1.
Visual representation of ASSIGN model
Fig. 2.
Fig. 2.
Oncogenic pathway activity prediction via cross-validation. Predicted pathway activity for (A) ASSIGN, (B) BFRM and (C) FacPad. Activation levels of two oncogenic pathways (Bcat, Src) were estimated for cell lines with one of five pathways activated (β-catenin, E2F3, MYC, RAS, SRC). The ASSIGN and BFRM values range between zero (inactive pathway) and one (active pathway). FacPad was designed for relative pathway activation comparisons and activation levels can range from negative infinity to infinity
Fig. 3.
Fig. 3.
Pathway activity prediction using cross-platform generated pathway signatures. Comparison of ASSIGN, BFRM and FacPad predicted EGFR (A), MEK (B) and PI3K (C) pathway activity in EGFR, MEK and EGFR+MEK activated RNA-Seq samples. EGFR and MEK pathway signatures were profiled via RNA-Seq, whereas PI3K pathway signature was profiled via microarray. ASSIGN detected two pathways (EGFR and MEK) activated at the same time in the EGFR+MEK samples and correctly predicted that the PI3K pathway was inactive, whereas BFRM and FacPad estimated PI3K pathway activation incorrectly. FacPad also estimated active pathways as inactive and inactive pathways as active (so called ‘sign-flipping’. See Section 3)
Fig. 4.
Fig. 4.
KEGG P53 signaling pathway signature in tissues exposed to carcinogens. (A) ASSIGN predicted pathway activity in rat liver tissues exposed to non-genotoxic or genotoxic carcinogens. The boxplot exhibits an association between genotoxic carcinogen exposure and P53 signaling pathway activation. (B) ROC curve for ASSIGN predicted signature strengths of the KEGG P53 signaling pathway. The corresponding area under the curve (AUC) is 0.911, suggesting an excellent model predictive ability. (C) Heatmap of 43 predefined P53 signaling pathway genes in 36 rat liver samples. Each row represents a gene and each column represents a sample. The color bar above the heatmap represents the treatment labels for each corresponding sample (orange: genotoxic; grey: non-genotoxic). The bar plot above the heatmap is the ASSIGN predicted signature strength for each corresponding sample. The bar plot on the left is the ASSIGN predicted posterior signature (green: gene included in the posterior signature; grey: gene not included)

References

    1. Ashburner M., et al. (2000) Gene ontology: tool for the unification of biology. The Gene Ontology Consortium. Nat. Genet., 25, 25–29. - PMC - PubMed
    1. Avraham R., Yarden Y. (2011) Feedback regulation of EGFR signalling: decision making by early and delayed loops. Nat. Rev. Mol. Cell Biol., 12, 104–117. - PubMed
    1. Barbie D.A., et al. (2009) Systematic RNA interference reveals that oncogenic KRAS-driven cancers require TBK1. Nature, 462, 108–112. - PMC - PubMed
    1. Bazot C., et al. (2013) Unsupervised Bayesian linear unmixing of gene expression microarrays. BMC Bioinformatics, 14, 99. - PMC - PubMed
    1. Bhattacharya A., Dunson D.B. (2011) Sparse Bayesian infinite factor models. Biometrika, 98, 291–306. - PMC - PubMed

Publication types