. 2015 Jan 23;4(2):224-32.
doi: 10.1242/bio.201410645.

mRNA expression analysis of the SUMO pathway genes in the adult mouse retina

Affiliations

mRNA expression analysis of the SUMO pathway genes in the adult mouse retina

Víctor Abad-Morales et al. Biol Open. .

Abstract

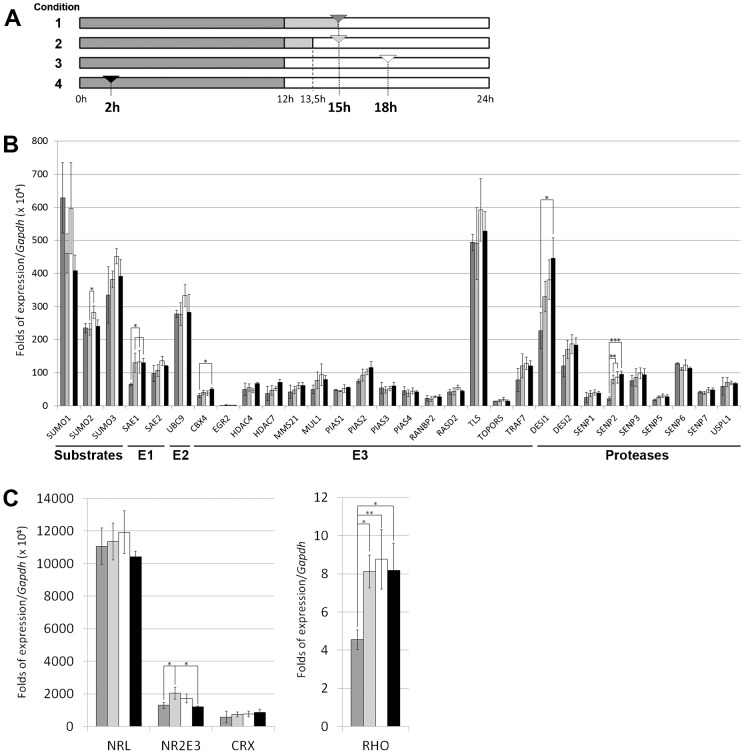
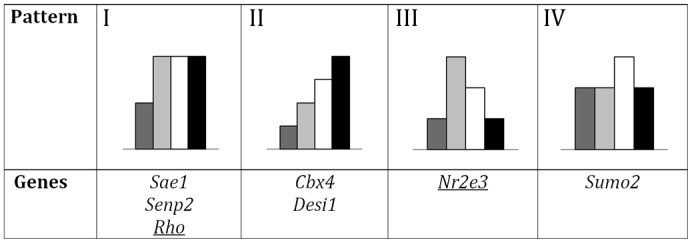
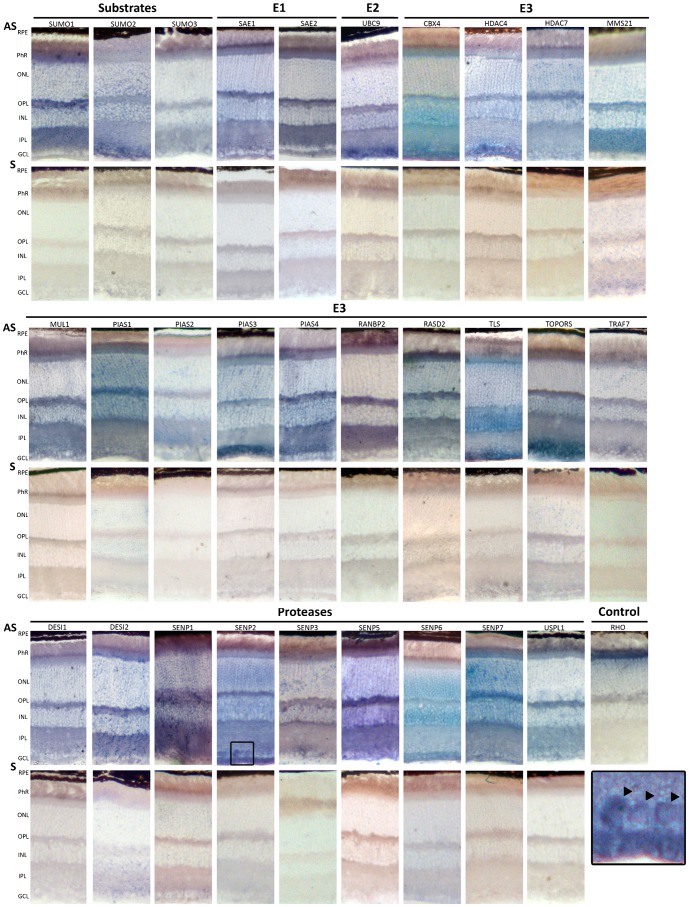
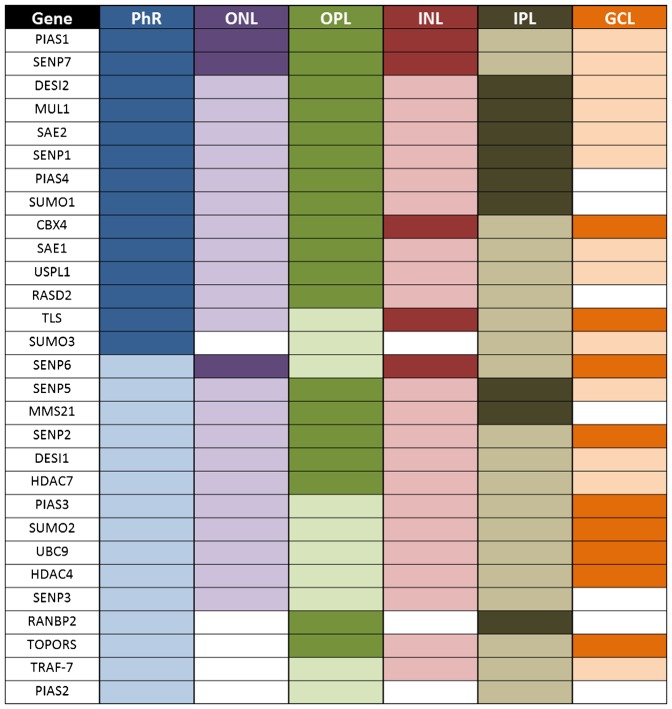
Sumoylation is a reversible post-translational modification that regulates different cellular processes by conjugation/deconjugation of SUMO moieties to target proteins. Most work on the functional relevance of SUMO has focused on cell cycle, DNA repair and cancer in cultured cells, but data on the inter-dependence of separate components of the SUMO pathway in highly specialized tissues, such as the retina, is still scanty. Nonetheless, several retinal transcription factors (TFs) relevant for cone and rod fate, as well as some circadian rhythm regulators, are regulated by sumoylation. Here we present a comprehensive survey of SUMO pathway gene expression in the murine retina by quantitative RT-PCR and in situ hybridization (ISH). The mRNA expression levels were quantified in retinas obtained under four different light/dark conditions, revealing distinct levels of gene expression. In addition, a SUMO pathway retinal gene atlas based on the mRNA expression pattern was drawn. Although most genes are ubiquitously expressed, some patterns could be defined in a first step to determine its biological significance and interdependence. The wide expression of the SUMO pathway genes, the transcriptional response under several light/dark conditions, and the diversity of expression patterns in different cell layers clearly support sumoylation as a relevant post-translational modification in the retina. This expression atlas intends to be a reference framework for retinal researchers and to depict a more comprehensive view of the SUMO-regulated processes in the retina.

Keywords: In situ hybridization; SUMO; light cycle; mRNA expression levels; retina; sumoylation.


Conflict of interest statement

Competing interests: The authors have no competing or financial interests to declare.

Figures

Fig. 1.
Fig. 1.. Quantitative relative expression of genes encoding SUMO substrates, SUMO metabolism and other retinal enzymes in the mouse retina.
(A) Scheme showing the four conditions of light/dark cycle (grey versus light blocks, respectively) plus the timing of the retinas dissection, which is indicated by an arrowhead: condition 1 (dark grey) – last dark phase lengthened by 3 h (retinas obtained in the dark); condition 2 (light grey) – last dark phase lengthened by 1.5 h plus 1.5 h of exposition to light (retinas obtained under light); condition 3 (white) – retinas obtained in normal light/dark cycle after 6 h of exposition to light; condition 4 (black) – retinas obtained in normal light/dark cycle after 2 h of exposition to dark. (B) Transcriptional levels of SUMO substrate and SUMO metabolism enzyme genes. Levels are obtained as a ratio with Gapdh expression (used for normalization) per 104. (C) Transcriptional levels of some relevant retinal genes. Rhodopsin levels (right panel) are as high as Gapdh, and the ratio is directly represented, whereas the ratio of transcription factors (left panel) is multiplied per 104, as in B. All bars in B and C are coloured indicating the condition under which the retinas were obtained (as explained in A). Three independent retinal cDNA samples (each sample containing 3 different retinas) were analyzed for each of the four conditions. Thus, per each condition 9 retinas from at least 5 different animals and divided in three different samples, were used. Gene expression values are the average of these three samples per condition, and the s.d. bars indicated the variability of expression in the different individuals. The Tukey-Kramer test was used for the multiple comparisons of the condition means. Asterisks (*, ** or ***) show a statistical significant variation (p<0.05, p<0.01 or p<0.001, respectively). The units of expression are directly comparable among genes, except for Rho.
Fig. 2.
Fig. 2.. Classification of the SUMO-pathway and other retinal genes according to their pattern of expression activation/inhibition in mouse under several light-dark conditions.
Some SUMO metabolism and other relevant retinal genes were grouped with statistical significance by the similarity in their patterns of expression, according to the qRT-PCR. Note that the first three patterns show an activation by light exposition (condition 1 versus 2) that is further increased (I), maintained (II) or decreased (III) in the following conditions (3 and 4), while pattern IV showed an isolated increase in the third condition. Histogram colouring is as in Fig. 1.
Fig. 3.
Fig. 3.. In situ hybridization on murine retina cryosections of the genes encoding SUMO substrates and SUMO E1, E2, and E3 ligases, and proteases.
Representative images obtained after the in situ hybridization of Antisense (AS) and Sense (S) digoxigenin-labelled riboprobes, stained for the same period of time per each gene. Antisense riboprobes reflect the pattern of gene expression, whereas the sense probes are the corresponding negative controls. The antisense Rhodopsin probe, which strongly labels the inner photoreceptor segment, was used as a positive control for the assay. RPE, Retinal Pigment epithelium; PhR, Photoreceptor cell layer; ONL, outer nuclear layer; OPL, Outer plexiform layer; INL, Inner nuclear layer, IPL, inner plexiform layer; GCL, ganglion cell layer. The boxed region at the bottom right is an amplification of the Senp2 in situ hybridization at the GCL level. The black arrowheads indicate nuclear/perinuclear mRNA localization.
Fig. 4.
Fig. 4.. Summarized graphic representation of the mRNA pattern of the SUMO pathway genes as revealed by in situ hybridization on murine retina cryosections.
Colour intensity in this figure reflects in situ hybridization signal intensity per each gene by direct comparison of the signal rendered in different layers in the same retinal preparation. Intensities are not directly comparable among different genes, as each in situ hybridization required different incubation times. For each gene, sense (negative control) and antisense riboprobes were always processed in parallel and following the same incubation times. This graphic interpretation depicts the mRNA positive signal per gene and layer after deducting the corresponding negative signal (if any). Phr, Photoreceptor cell layer; ONL, outer nuclear layer; OPL, Outer plexiform layer; INL, Inner nuclear layer, IPL, inner plexiform layer; GCL, ganglion cell layer.
Fig. 5.
Fig. 5.. Immunodetection of several proteins in retinal explants under dark or light conditions.
(A) Western blots of TLS, CRX, and NR2E3 in retinal explants of single individuals in which one retina was maintained in the dark (D, condition 1), while the other counterpart was exposed to light for 90 min after dark (L, condition 2). This is a representative image of n = 6. Immunodetection of GAPDH or α-tubulin was used as a normalization control. Arrowheads indicate higher molecular weight bands compatible with post-translational modifications, such as sumoylation. (B) Protein level quantification of the retinal explants in dark (1) and light (2) conditions (dark and light grey, respectively). Bars indicate s.d. (n = 6). Fold-induction is in arbitrary units, considering the mean value of the protein level in the dark as 1. Statistical significance is indicated by * (p<0.05) and ** (p<0.01) according to a Student's t-test, assuming normality (after Bartlett and Shapiro-Wilk tests). (C) Fold induction of the protein expression levels between the light vs dark conditions in the retinal explants from the same animal. For each pair of explants, the expression level in the dark was arbitrarily considered as the unity to allow direct comparison.

Similar articles

Cited by

References

    1. Blackshaw S., Harpavat S., Trimarchi J., Cai L., Huang H., Kuo W. P., Weber G., Lee K., Fraioli R. E., Cho S. H. et al. (2004). Genomic analysis of mouse retinal development. PLoS Biol. 2, e247 10.1371/journal.pbio.0020247 - DOI - PMC - PubMed
    1. Brooks M. J., Rajasimha H. K., Roger J. E., Swaroop A. (2011). Next-generation sequencing facilitates quantitative analysis of wild-type and Nrl(−/−) retinal transcriptomes. Mol. Vis. 17, 3034–3054. - PMC - PubMed
    1. Chakarova C. F., Papaioannou M. G., Khanna H., Lopez I., Waseem N., Shah A., Theis T., Friedman J., Maubaret C., Bujakowska K. et al. (2007). Mutations in TOPORS cause autosomal dominant retinitis pigmentosa with perivascular retinal pigment epithelium atrophy. Am. J. Hum. Genet. 81, 1098–1103. 10.1086/521953 - DOI - PMC - PubMed
    1. Chen B., Cepko C. L. (2009). HDAC4 regulates neuronal survival in normal and diseased retinas. Science 323, 256–259. 10.1126/science.1166226 - DOI - PMC - PubMed
    1. Chen Y., Yang M., Deng J., Chen X., Ye Y., Zhu L., Liu J., Ye H., Shen Y., Li Y. et al. (2011). Expression of human FUS protein in Drosophila leads to progressive neurodegeneration. Protein Cell 2, 477–486. 10.1007/s13238-011-1065-7 - DOI - PMC - PubMed