. 2015 Mar;239(1):232-9.
doi: 10.1016/j.atherosclerosis.2015.01.008. Epub 2015 Jan 14.

Pharmacogenomic interaction between the Haptoglobin genotype and vitamin E on atherosclerotic plaque progression and stability

Affiliations

Pharmacogenomic interaction between the Haptoglobin genotype and vitamin E on atherosclerotic plaque progression and stability

Hilla-Lee Veiner et al. Atherosclerosis. 2015 Mar.

Abstract

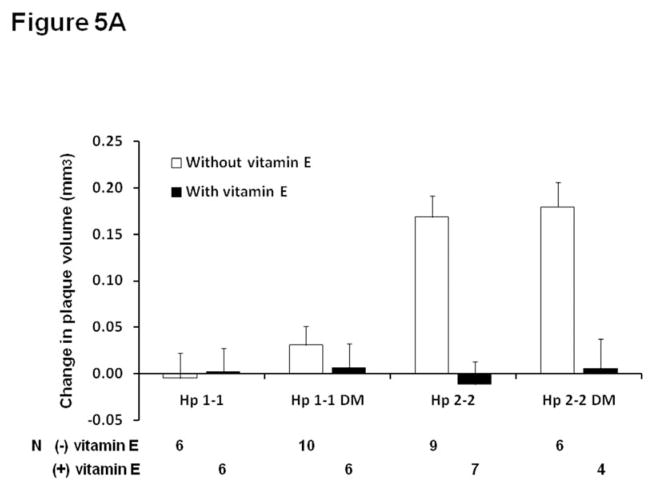
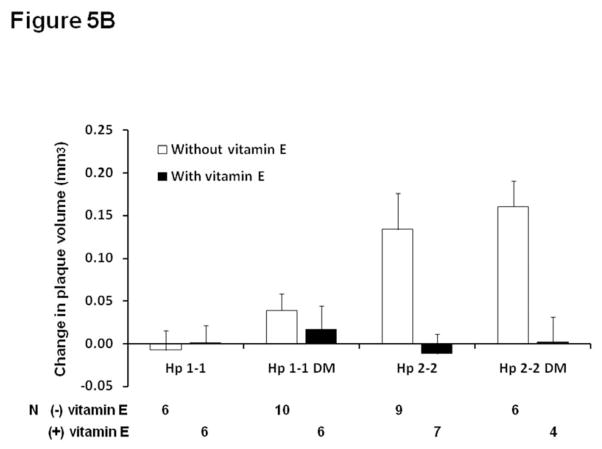
Objective: Homozygosity for a 1.7 kb intragenic duplication of the Haptoglobin (Hp) gene (Hp 2-2 genotype), present in 36% of the population, has been associated with a 2-3 fold increased incidence of atherothrombosis in individuals with Diabetes (DM) in 10 longitudinal studies compared to DM individuals not homozygous for this duplication (Hp 1-1/2-1). The increased CVD risk associated with the Hp 2-2 genotype has been shown to be prevented with vitamin E supplementation in man. We sought to determine if there was an interaction between the Hp genotype and vitamin E on atherosclerotic plaque growth and stability in a transgenic model of the Hp polymorphism.

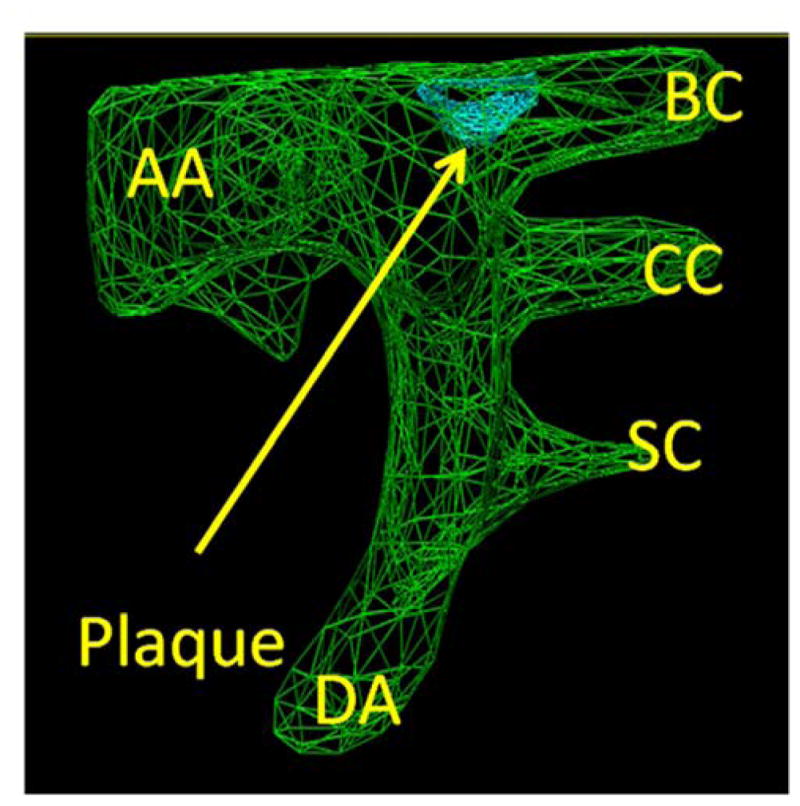
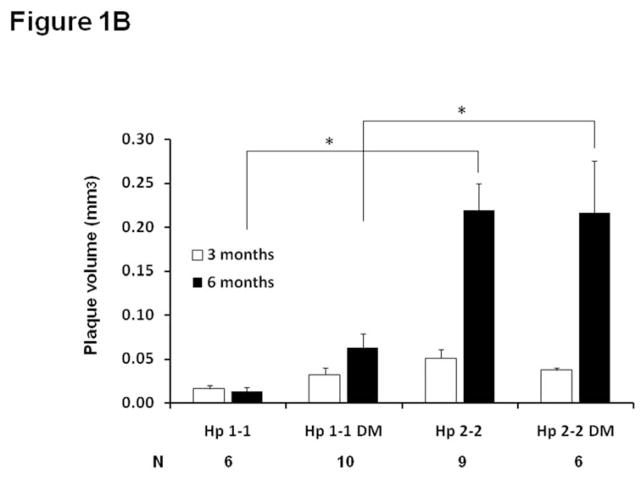
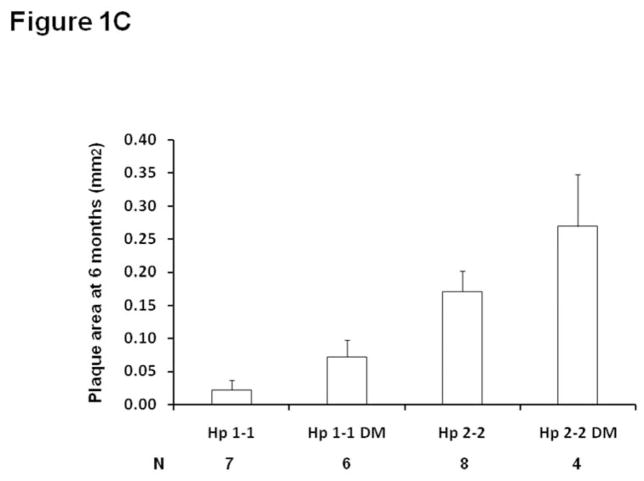
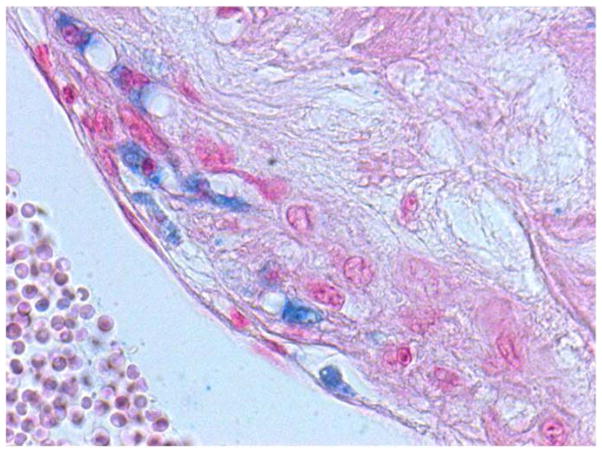
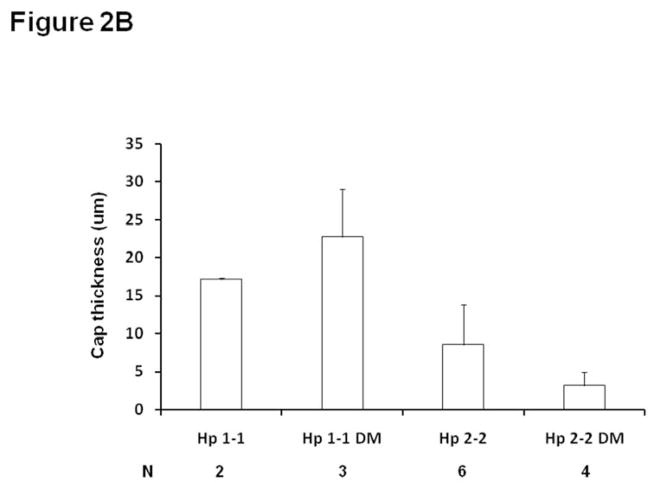
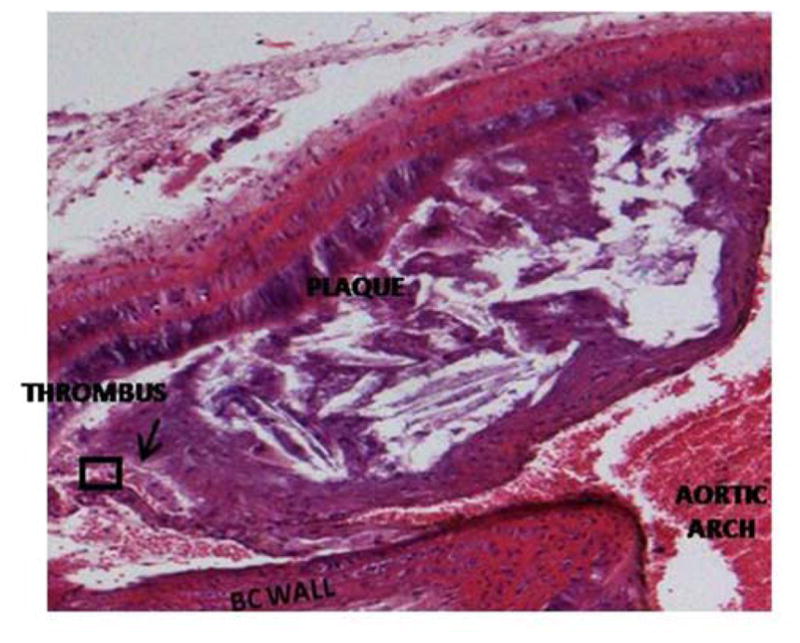
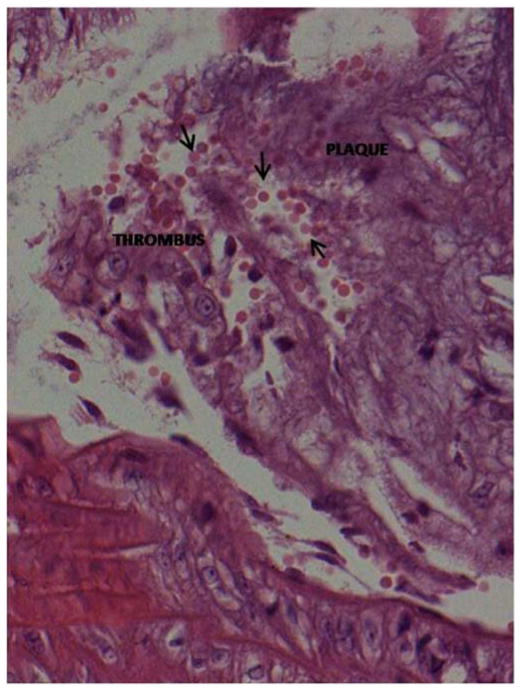
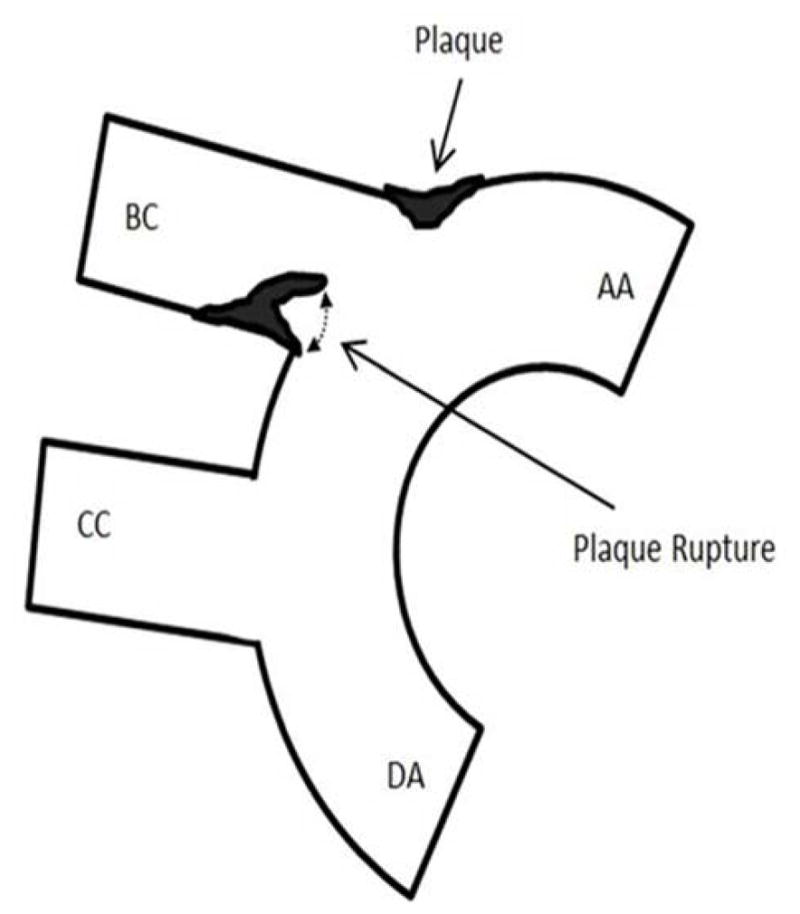
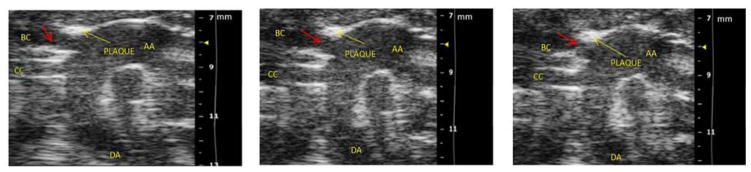
Methods and results: Brachiocephalic artery atherosclerotic plaque volume was serially assessed by high resolution ultrasound in 28 Hp 1-1 and 26 Hp 2-2 mice in a C57Bl/6 ApoE(-/-) background. Hp 2-2 mice had more rapid plaque growth and an increased incidence of plaque hemorrhage and rupture. Vitamin E significantly reduced plaque growth in Hp 2-2 but not in Hp 1-1 mice with a significant pharmacogenomic interaction between the Hp genotype and vitamin E on plaque growth.

Conclusions: These results may help explain why vitamin E supplementation in man can prevent CVD in Hp 2-2 DM but not in non Hp 2-2 DM individuals.

Keywords: Brachiocephalic artery plaque; Diabetes; Haptoglobin; Pharmacogenomics; Vitamin E.


Figures

Figure 1
Figure 1. Plaque growth and size are significantly increased in Hp 2-2 mice as determined from in vivo ultrasound measurements and from morphometric measurements of formalin fixed tissue
A. Measurement of plaque volume. In green is the three dimensional outline of the aortic arch (AA) with its arterial branches (BC-brachiocephalic, CC-common carotid, SC-subclavian). DA-descending aorta. Plaque (arrow) is visualized in blue at the aortic arch-brachiocephalic artery bifurcation. B. Brachiocephalic plaque volume was assessed in vivo in the same mouse by ultrasound at both 3 and 6 months in Hp 1-1 ApoE−/− or Hp 2-2 ApoE−/− mice with or without DM induced at 3 months of age. Plaque volume measurements are shown only for mice in which ultrasound measurements were obtained from the same mouse at both 3 months and 6 months, with N indicating the number of mice in each of the four groups with measurements at both 3 and 6 months. The change in plaque volume was significantly different between the 4 groups (ANOVA p=0.009). Pairwise comparisons for the change in plaque volume demonstrated significant differences (*) in plaque growth between Hp 1-1 and Hp 2-2 mice and between Hp 1-1 DM and Hp 2-2 DM mice (p<0.005 for both comparisons). C. Brachiocephalic plaque area is significantly increased in Hp 2-2 mice at 6 months of age in paraffin embedded formalin fixed sections. Plaque area was assessed on formalin fixed plaques at 6 months. Plaque area was significantly different between the four groups (p<0.009) (N, number of mice assessed in each group). Pairwise comparisons for the change in plaque volume demonstrated significant differences in plaque growth between Hp 1-1 and Hp 2-2 mice and between Hp 1-1 DM and Hp 2-2 DM mice (p<0.005 for both comparisons). Their was a borderline significant increase in plaque area at 6 months in Hp 2-2 DM compared to Hp 2-2 mice, p=0.075).
Figure 2
Figure 2. Hp 2-2 plaques have more iron and thinner fibrous caps
A. Perl’s iron stain (staining blue) in Hp 2-2 brachiocephalic plaque. 40X magnification of the plaque. Quantitation of multiple plaques is provided in supplementary Table 2 demonstrating significantly increased staining (both intensity and area of the plaque stained) in Hp 2-2 plaques. B. Minimum fibrous cap thickness (μm)±SE measured over the entire length of the brachiocephalic plaque. The minimum fibrous cap thickness of the brachiocephalic plaque in Hp 2-2 DM mice was significantly decreased as compared to Hp 1-1 DM mice p=0.028 with no significant difference between Hp 1-1 and Hp 2-2 mice in the absence of DM, p=0.323). N denotes the number of brachiocephalic plaques in which a clearly discernable cap could be measured for mice of a particular genotype. In Hp 1-1 mice without DM the vast majority of plaques examined for this parameter (12) did not have a fibrous cap.
Figure 3
Figure 3. Intraplaque hemorrhage
Hematoxylin and eosin stained Hp 2-2 DM plaque showing intraplaque hemorrhage at the site of brachiocephalic artery bifurcation with the aortic arch. The prevalence of intraplaque hemorrhage was increased in Hp 2-2 brachiocephalic plaques (8/10 Hp 2-2 plaques vs. 0/11 Hp 1-1 plaques, p<0.001). A. 10X magnification. Intraplaque clot is indicated by arrow. B. 40X magnification of boxed inset region from (A) demonstrating numerous red blood cells (arrows) derived from an intraplaque hemorrhage within the plaque.
Figure 4
Figure 4. Still frames of ultrasound video recording demonstrating plaque rupture in Hp 2-2 DM plaque
A. Schematic providing orientation of ultrasound snapshot still frames to assist for examining still frames in (B). Components of the aortic arch: AA-ascending aorta, DA-descending aorta, BC-brachiocephalic artery. CC-common carotid artery. Plaque indicated by arrow forms at the bifurcation of the BC and AA. A ruptured plaque is seen flapping in the BC lumen as indicated by dashed line on the inferior wall of the BC. B. Still frame snapshots of a cine loop of ultrasound images. Cine loop was 300 images per second with chosen still frames at 2.967 sec/3.174 sec/4.278 sec taken from a 20 second cine loop provided as an on-line video supplement. Components of the aortic arch: AA-ascending aorta, DA-descending aorta, BC-brachiocephalic artery. CC-common carotid artery. Yellow arrow points to plaque formation on superior wall of BC at the bifurcation of the BC with the AA. Red arrow highlights cap flap moving in the plaque lumen during the cardiac cycle with the three chosen still frames showing from left to right a flap which is not obstructing the lumen/half obstructing the lumen/occluding the BC lumen.
Figure 5
Figure 5. Vitamin E arrests plaque volume growth in Hp 2-2 mice
A. Change in plaque volume between 3 and 6 months of age in Hp 1-1 and Hp 2-2 mice with and without DM and with and without vitamin E supplementation initiated at 4 months of age. Vitamin E significantly reduced plaque volume growth in Hp 2-2 mice only (p<0.001 comparing Hp 2-2 mice with and without vitamin E and p<0.001 comparing Hp 2-2 DM mice with and without vitamin E). There was no significant effect of vitamin E on plaque volume growth in Hp 1-1 mice (p=0.932 in Hp 1-1 and p=0.576 in Hp 1-1 DM mice). There was a statistically significant interaction between the Hp genotype and vitamin E on plaque volume growth (p<0.0001). N, number of mice for which plaque volume could be assessed at both 3 and 6 months for mice of a particular genotype, DM status and treatment group. B. Change in plaque volume as described in (A) after adjustment for cholesterol. Vitamin E significantly reduced plaque volume growth in Hp 2-2 mice only (p<0.001 comparing Hp 2-2 and Hp 2-2 DM mice with and without vitamin E). There was no significant effect of vitamin E on plaque volume growth in Hp 1-1 mice (p=0.807 in Hp 1-1 and p=0.452 in Hp 1-1 DM mice). There was a statistically significant interaction between the Hp genotype and vitamin E on plaque volume growth (p=0.0006).

References

    1. Steinberg D, Parthasarathy S, Carew TW, Khoo JC, Witztum JL. Beyond cholesterol: modification of low density lipoprotein that increases its atherogenicity. N Engl J Med. 1989;320:915–924. - PubMed
    1. Lonn ME, Dennis JM, Stocker R. Actions of “antioxidants” in the protection against atherosclerosis. Free Rad Biol Med. 2012;53:863–884. - PubMed
    1. Heart Outcomes Prevention Evaluation (HOPE) Study Investigators. Vitamin E supplementation and cardiovascular events in high risk patients. N Engl J Med. 2000;342:154–160. - PubMed
    1. Lee IM, Cook NR, Gaziano JM, Gordon D, Ridker PM, Manson JE, Hennekens CH, Buring JH. Vitamin E in the primary prevention of cardiovascular disease and cancer. The Women’s Health Study: a randomized controlled clinical trial. JAMA. 2005;294:56–65. - PubMed
    1. Miller ER, Barriuso RP, Dalal D, Riemersma RA, Appel LJ, Guallar E. Meta-analysis: high dosage vitamin E supplementation may increase all cause mortality. Ann Int Med. 2005;142:37–46. - PubMed

Publication types