Chains of transmission and control of Ebola virus disease in Conakry, Guinea, in 2014: an observational study
- PMID: 25619149
- PMCID: PMC4373532
- DOI: 10.1016/S1473-3099(14)71075-8
Chains of transmission and control of Ebola virus disease in Conakry, Guinea, in 2014: an observational study
Abstract
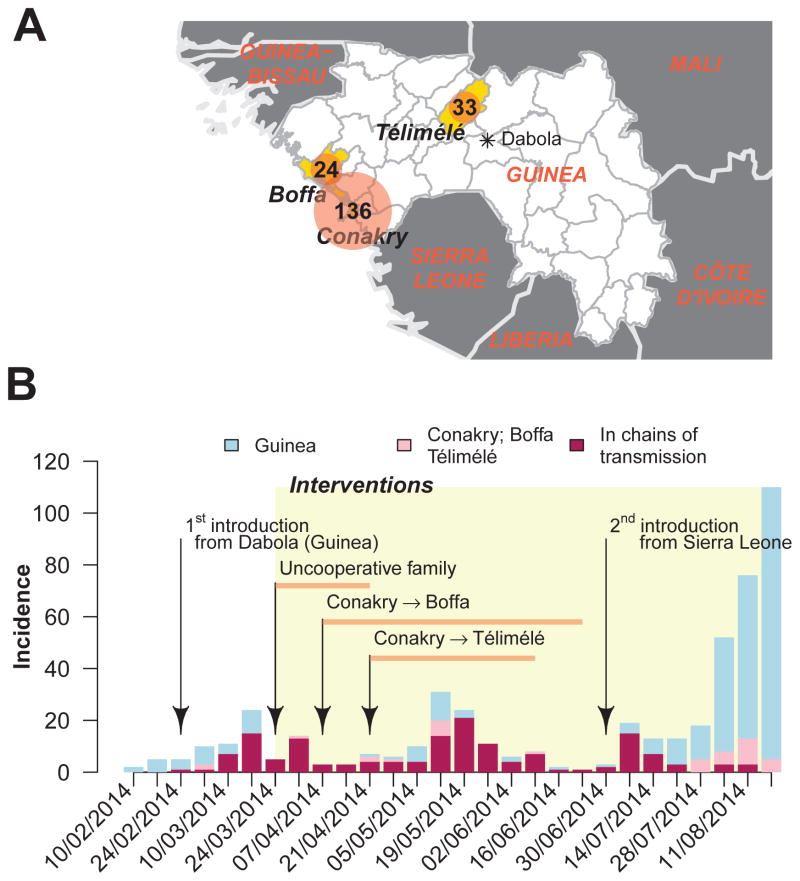
Background: An epidemic of Ebola virus disease of unprecedented size continues in parts of west Africa. For the first time, large urban centres such as Conakry, the capital of Guinea, are affected. We did an observational study of patients with Ebola virus disease in three regions of Guinea, including Conakry, aiming to map the routes of transmission and assess the effect of interventions.
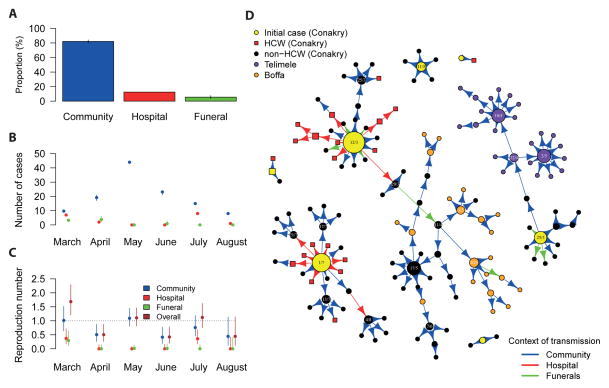
Methods: Between Feb 10, 2014, and Aug 25, 2014, we obtained data from the linelist of all confirmed and probable cases in Guinea (as of Sept 16, 2014), a laboratory database of information about patients, and interviews with patients and their families and neighbours. With this information, we mapped chains of transmission, identified which setting infections most probably originated from (community, hospitals, or funerals), and computed the context-specific and overall reproduction numbers.
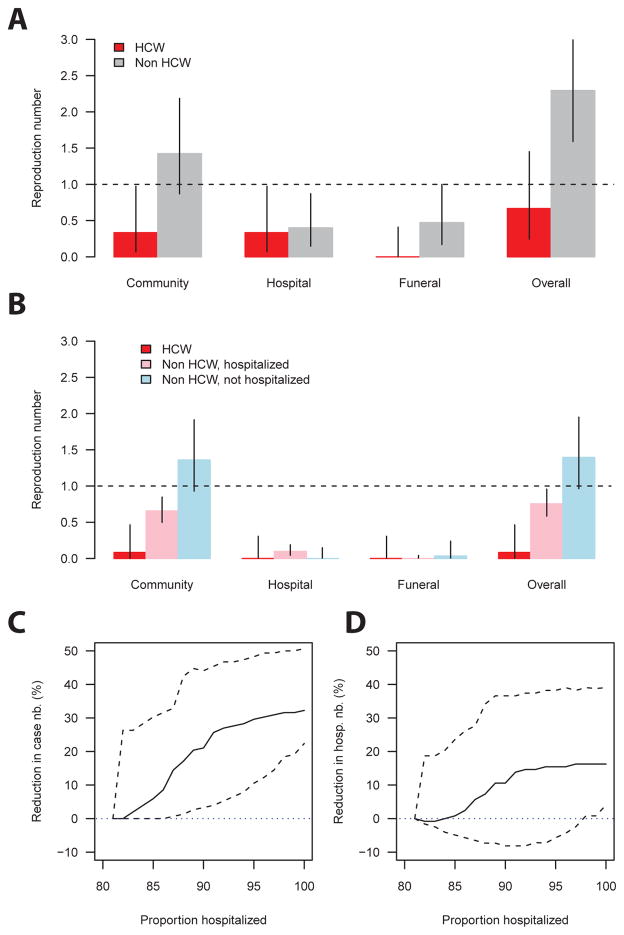
Findings: Of 193 confirmed and probable cases of Ebola virus disease reported in Conakry, Boffa, and Télimélé, 152 (79%) were positioned in chains of transmission. Health-care workers contributed little to transmission. In March, 2014, individuals with Ebola virus disease who were not health-care workers infected a mean of 2·3 people (95% CI 1·6-3·2): 1·4 (0·9-2·2) in the community, 0·4 (0·1-0·9) in hospitals, and 0·5 (0·2-1·0) at funerals. After the implementation of infection control in April, the reproduction number in hospitals and at funerals reduced to lower than 0·1. In the community, the reproduction number dropped by 50% for patients that were admitted to hospital, but remained unchanged for those that were not. In March, hospital transmissions constituted 35% (seven of 20) of all transmissions and funeral transmissions constituted 15% (three); but from April to the end of the study period, they constituted only 9% (11 of 128) and 4% (five), respectively. 82% (119 of 145) of transmission occurred in the community and 72% (105) between family members. Our simulations show that a 10% increase in hospital admissions could have reduced the length of chains by 26% (95% CI 4-45).
Interpretation: In Conakry, interventions had the potential to stop the epidemic, but reintroductions of the disease and poor cooperation of a few families led to prolonged low-level spread, showing the challenges of Ebola virus disease control in large urban centres. Monitoring of chains of transmission is crucial to assess and optimise local control strategies for Ebola virus disease.
Funding: Labex IBEID, Reacting, PREDEMICS, NIGMS MIDAS initiative, Institut Pasteur de Dakar.
Copyright © 2015 Elsevier Ltd. All rights reserved.
Figures
Comment in
-
What transmission trees reveal about Ebola.Lancet Infect Dis. 2015 Mar;15(3):258-9. doi: 10.1016/S1473-3099(14)71088-6. Epub 2015 Jan 23. Lancet Infect Dis. 2015. PMID: 25619148 No abstract available.
-
Ebola superspreading.Lancet Infect Dis. 2015 May;15(5):507-8. doi: 10.1016/S1473-3099(15)70135-0. Epub 2015 Apr 19. Lancet Infect Dis. 2015. PMID: 25932579 Free PMC article. No abstract available.
-
Dried blood spot for Ebola testing in developing countries.Lancet Infect Dis. 2015 Sep;15(9):1005. doi: 10.1016/S1473-3099(15)00226-1. Lancet Infect Dis. 2015. PMID: 26333329 No abstract available.
References
-
- WHO. [Last accessed on 2 Dec 2014. 2014];Ebola response roadmap situation report. 2014 Nov 26; Available at http://apps.who.int/iris/bitstream/10665/144498/1/roadmapsitrep_26Nov201....
-
- WHO. WHO Statement on the Meeting of the International Health Regulations Emergency Committee Regarding the 2014 Ebola Outbreak in West Africa. [Last accessed on 22 Oct 2014];WHO statement. 2014 Aug 8; Available at http://www.who.int/mediacentre/news/statements/2014/ebola-20140808/en.
Publication types
MeSH terms
Grants and funding
LinkOut - more resources
Full Text Sources
Medical
Miscellaneous