. 2015 Jun;59(6):1013-24.
doi: 10.1002/mnfr.201400679. Epub 2015 Apr 27.

Isothiocyanate-rich Moringa oleifera extract reduces weight gain, insulin resistance, and hepatic gluconeogenesis in mice

Affiliations

Isothiocyanate-rich Moringa oleifera extract reduces weight gain, insulin resistance, and hepatic gluconeogenesis in mice

Carrie Waterman et al. Mol Nutr Food Res. 2015 Jun.

Abstract

Scope: Moringa oleifera (moringa) is tropical plant traditionally used as an antidiabetic food. It produces structurally unique and chemically stable moringa isothiocyanates (MICs) that were evaluated for their therapeutic use in vivo.

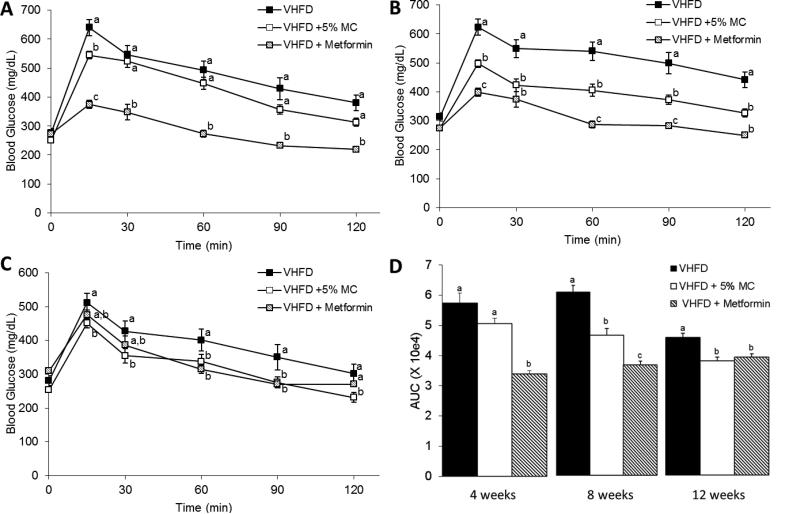
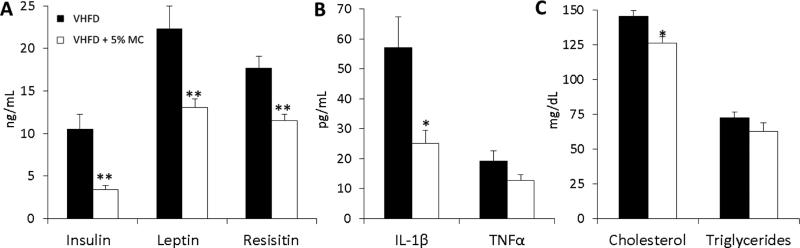
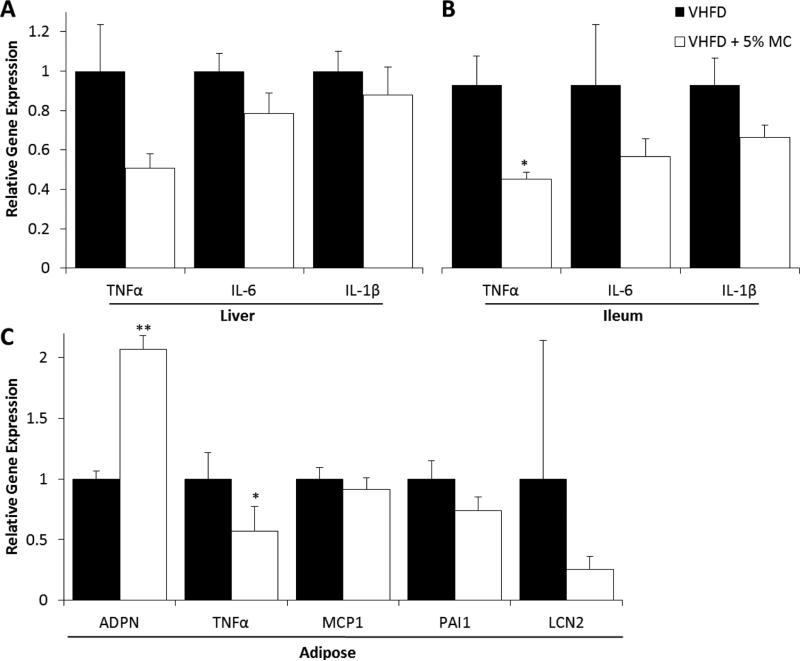
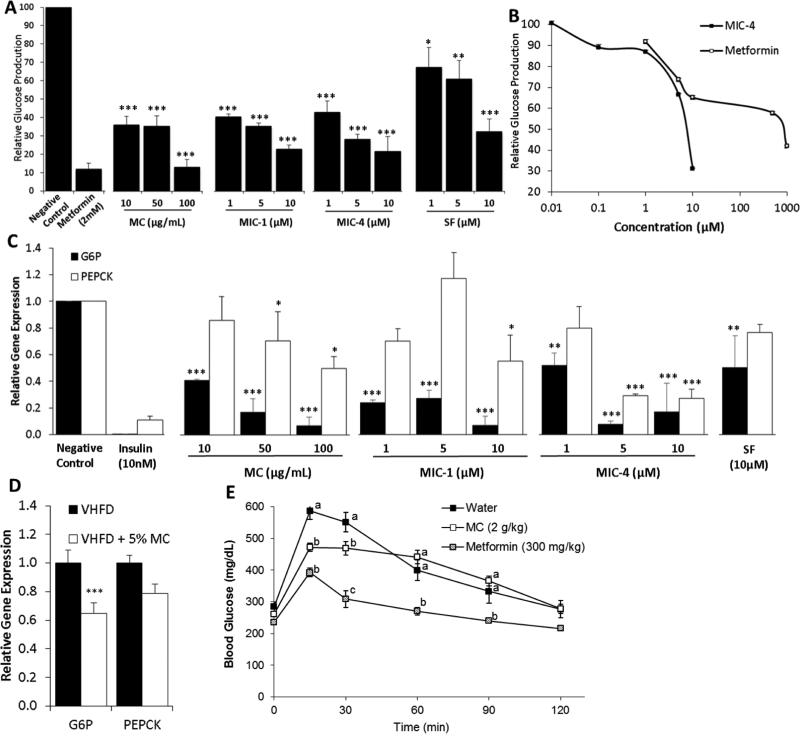
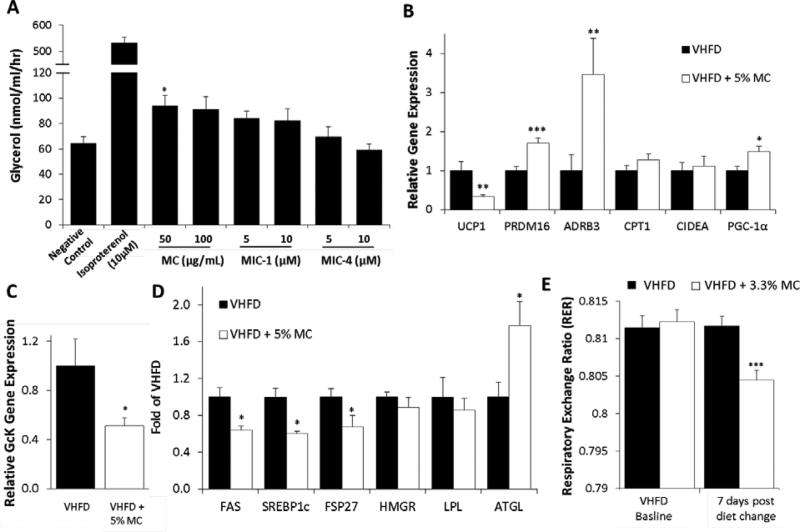
Methods and results: C57BL/6L mice fed very high fat diet (VHFD) supplemented with 5% moringa concentrate (MC, delivering 66 mg/kg/d of MICs) accumulated fat mass, had improved glucose tolerance and insulin signaling, and did not develop fatty liver disease compared to VHFD-fed mice. MC-fed group also had reduced plasma insulin, leptin, resistin, cholesterol, IL-1β, TNFα, and lower hepatic glucose-6-phosphatase (G6P) expression. In hepatoma cells, MC and MICs at low micromolar concentrations inhibited gluconeogenesis and G6P expression. MICs and MC effects on lipolysis in vitro and on thermogenic and lipolytic genes in adipose tissue in vivo argued these are not likely primary targets for the anti-obesity and anti-diabetic effects observed.

Conclusion: Data suggest that MICs are the main anti-obesity and anti-diabetic bioactives of MC, and that they exert their effects by inhibiting rate-limiting steps in liver gluconeogenesis resulting in direct or indirect increase in insulin signaling and sensitivity. These conclusions suggest that MC may be an effective dietary food for the prevention and treatment of obesity and type 2 diabetes.

Keywords: Diabetes; Insulin resistance; Isothiocyanates; Moringa oleifera; Obesity.


Figures

Figure 1
Figure 1
Body weight gain (A), ratio of accumulated food intake to body weight (B), fat mass (C) and free fat mass (D) in VHFD and VHFD + 5% MC-fed mice. n=12 mice per group, Data are means ± SEM. Comparisons to controls were made by Welch's test. *P < 0.05; **P < 0.01; ***P < 0.001.
Figure 2
Figure 2
Oral glucose tolerance test performed at 4 (A), 8 (B) and 12 (C) weeks on a mice fed a VHFD, VHFD + 5% MC, and a VHDF gavaged with 300mg/kg metformin on the day of OGTT. Area Under the Curve of OGTT at 4, 8, and 12 weeks (D). n = 12 mice per group, except for metformin group where n=6 and only shown as a reference group. Data are means ± SEM. Comparisons were made by a 1-way ANOVA followed by Tukey's posthoc test. Significant differences (p < 0.05) between sample sets are signified by letters; different letters indicate significant difference between sample sets, while the same letter or absence of a letter indicates no difference.
Figure 3
Figure 3
Gross examination of liver samples from VHFD-fed mice (A) and VHFD + 5% MC-fed mice (B). Liver weight in VHFD and VHFD + 5% MC (n=12,) (C) Data are means ± SEM. **: p<.01. Histological examination of liver samples from VHFD (D) and VHFD + 5% MC (E). Fat content in liver from VHFD-fed mice and VHFD + 5% MC fed mice (n=12) (F). Comparisons to controls were made by Welch's test. Data are means ± SEM. **P < 0.01; ***P < 0.001.
Figure 4
Figure 4
Blood plasma expression of insulin, leptin, resistin (A), IL-1β, TNFα (B), total cholesterol and triglycerides (C) in VHFD and VHFD + 5% MC-fed mice. n=12 mice per group except for IL-1β and TNFα where n=5, undetectable levels below 2.4 pg/mL were excluded. Comparisons to controls were made by Welch's test. Data are means ± SEM. *P < 0.05; **P < 0.01.
Figure 5
Figure 5
Insulin signaling protein levels in liver (A) and skeletal muscle (B) from VHFD +5% MC-fed mice relative to VHFD-fed mice (dashed line). n=12 mice per group, Data are means ± SEM. Comparisons to controls were made by Welch's test. *P < 0.05; **P < 0.01; ***P < 0.001.
Figure 6
Figure 6
Gene expression of inflammatory markers in liver (A), ileum (B), and adipose tissue (C) of VHFD and VHFD + 5% MC-fed mice. n = 8-12, Data are means ± SEM. Comparisons to controls were made by Welch's test for liver, ileum, and adipose tissue. *P < 0.05.
Figure 7
Figure 7
Effect of MICs, SF and MC on glucose metabolism in vitro (A, B, C) and in vivo (D, E). Effects of MC, MIC-1, MIC-4 and sulforaphane (SF) on glucose production (A, B) and gene expression of G6P and PEPCK in HII4E liver cells; n=3 (C). Expression of G6P and PEPCK in hepatic tissue of VHFD and VHFD + 5% MC-fed mice (D) n=12. Acute OGTT test in VHFD-fed mice gavaged with 2g/kg of MC (E) n = 6. Comparisons to controls were made by Dunnett's test for A and C, and a t-test for D. Data are means ± SEM. *: p<.05, **: p<.01, ***: p<.001. Comparisons for E were made by a 1-way ANOVA followed by Tukey's posthoc test. Significant differences (p < 0.05) between sample sets are signified by letters; different letters indicate significant difference between sample sets, while the same letter or absence of a letter indicates no difference.
Figure 8
Figure 8
Effect of MICs and MC on lipolysis and thermogenesis in vitro (A) and in vivo (B-E). Production of glycerol in adipocytes treated with MC, MIC-1 and MIC-4; n = 3 (A). Expression of thermogenic and lipolytic genes in adipose tissue (B) and hepatic GcK (C) from VHFD and VHFD + 5% MC-fed mice for 3 months; n = 12. Hepatic lipid metabolizing protein levels from VHFD and VHFD + 5% MC-fed mice for 3 months; n = 12 (D). RER in mice switched to a VHFD + 3.3% MC after 7 days compared to mice that remained on a VHFD (n=12) (E). Data are means ± SEM. Comparisons to controls were made by t-test for A, Welch's test for B, C D and ANCOVA for E. *: p<.05, **: p<.01, ***: p<.001.

References

    1. Mbikay M. Therapeutic potential of Moringa oleifera leaves in chronic hyperglycemia and dyslipidemia: a review. Front Pharmacol. 2012;3:1–12. - PMC - PubMed
    1. Waterman C, Cheng DM, Rojas-Silva P, Poulev A, Dreifus J, et al. Stable, water extractable isothiocyanates from Moringa oleifera leaves attenuate inflammation in vitro. Phytochem. 2014;103:114–122. - PMC - PubMed
    1. Cheenpracha S, Park E-J, Yoshida WY, Barit C, Wall M, et al. Potential anti-inflammatory phenolic glycosides from the medicinal plant Moringa oleifera fruits. Bioorgan. Med. Chem. 2010;18:6598–6602. - PubMed
    1. Bae JY, Lim SS, Kim SJ, Choi JS, Park J, et al. Bog blueberry anthocyanins alleviate photoaging in ultraviolet-B irradiation-induced human dermal fibroblasts. Mol. Nutr. Food Res. 2009;53:726–738. - PubMed
    1. Brunelli D, Tavecchio M, Falcioni C, Frapolli R, Erba E, et al. The isothiocyanate produced from glucomoringin inhibits NF-kB and reduces myeloma growth in nude mice in vivo. Biochem. Pharmacol. 2010;79:1141–1148. - PubMed

Publication types

MeSH terms