Comparative Study
. 2015 Mar;49(2):127-38.
doi: 10.1016/j.alcohol.2014.07.024. Epub 2015 Jan 6.

Comparison of dehydroepiandrosterone (DHEA) and pregnanolone with existing pharmacotherapies for alcohol abuse on ethanol- and food-maintained responding in male rats

Affiliations
Comparative Study

Comparison of dehydroepiandrosterone (DHEA) and pregnanolone with existing pharmacotherapies for alcohol abuse on ethanol- and food-maintained responding in male rats

Mary W Hulin et al. Alcohol. 2015 Mar.

Abstract

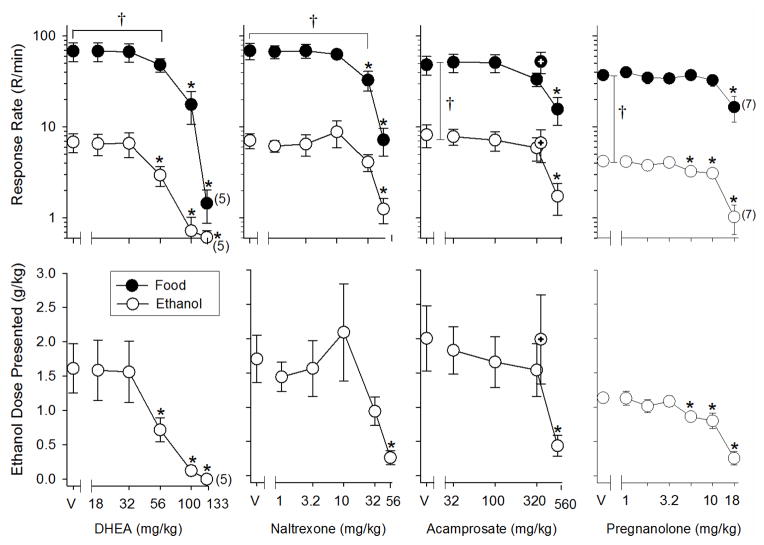
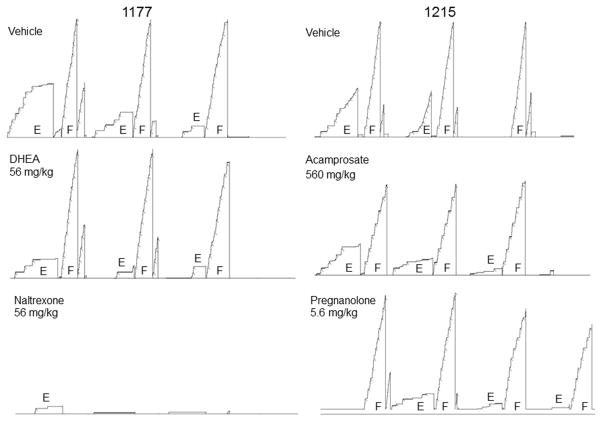
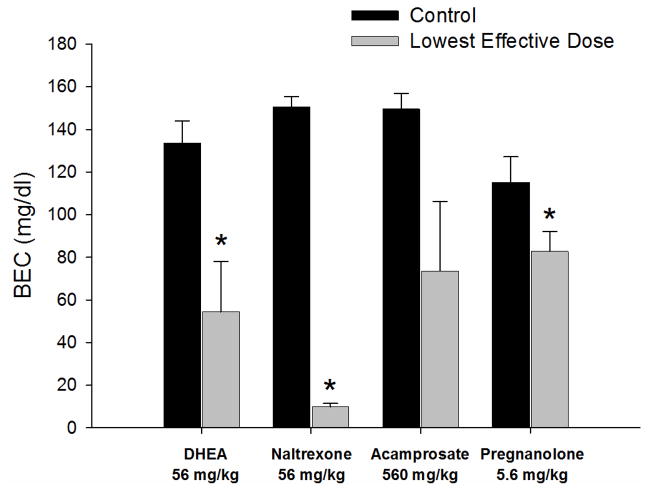
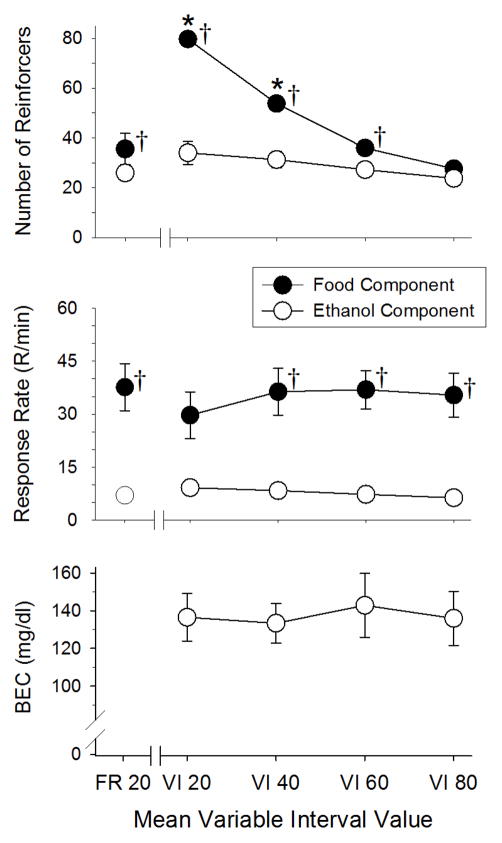
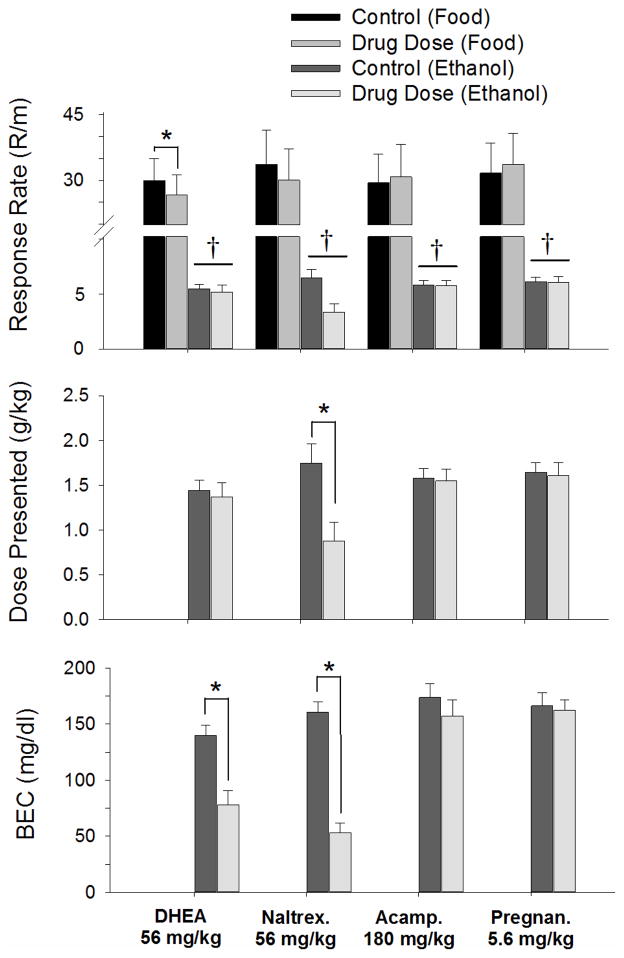
The present study compared two putative pharmacotherapies for alcohol abuse and dependence, dehydroepiandrosterone (DHEA) and pregnanolone, with two Food and Drug Administration (FDA)-approved pharmacotherapies, naltrexone and acamprosate. Experiment 1 assessed the effects of different doses of DHEA, pregnanolone, naltrexone, and acamprosate on both ethanol- and food-maintained responding under a multiple fixed-ratio (FR)-10 FR-20 schedule, respectively. Experiment 2 assessed the effects of different mean intervals of food presentation on responding for ethanol under a FR-10 variable-interval (VI) schedule, whereas Experiment 3 assessed the effects of a single dose of each drug under a FR-10 VI-80 schedule. In Experiment 1, all four drugs dose-dependently decreased response rate for both food and ethanol, although differences in the rate-decreasing effects were apparent among the drugs. DHEA and pregnanolone decreased ethanol-maintained responding more potently than food-maintained responding, whereas the reverse was true for naltrexone. Acamprosate decreased responding for both reinforcers with equal potency. In Experiment 2, different mean intervals of food presentation significantly affected the number of food reinforcers obtained per session; however, changes in the number of food reinforcements did not significantly affect responding for ethanol. Under the FR-10 VI-80 schedule in Experiment 3, only naltrexone significantly decreased both the dose of alcohol presented and blood ethanol concentration (BEC). Acamprosate and pregnanolone had no significant effects on any of the dependent measures, whereas DHEA significantly decreased BEC, but did not significantly decrease response rate or the dose presented. In summary, DHEA and pregnanolone decreased ethanol-maintained responding more potently than food-maintained responding under a multiple FR-10 FR-20 schedule, and were more selective for decreasing ethanol self-administration than either naltrexone or acamprosate under that schedule. Experiment 2 showed that ethanol intake was relatively independent of the interval of reinforcement in the food-maintained component, and Experiment 3 showed that naltrexone was the most effective drug at the doses tested when the interval for food reinforcement was low and maintained under a variable-interval schedule.

Keywords: Acamprosate; DHEA; Ethanol; Multiple schedules; Naltrexone; Pregnanolone.


Conflict of interest statement

Disclosures

All authors also deny any financial, personal, or other conflicts of interest that may inappropriately affect or influence the presentation or interpretation of the findings described in this manuscript. Finally, the authors would like to express their gratitude for the expert assistance of Mr. Peter B. Lewis.

Figures

Figure 1
Figure 1
Effects of DHEA (n = 6), naltrexone (n = 5), acamprosate (n = 6), and pregnanolone (n = 9) in male rats responding under a multiple schedule of ethanol (FR-10) and food (FR-20) presentation. The dependent measures were response rate (responses [R]/min, top panels) plotted on a log scale and ethanol dose presented (g/kg, bottom panels). For each drug, the unfilled circles represent response rate during the ethanol component, whereas filled circles represent response rate during the food component. The additional points and vertical lines above the 320 mg/kg dose in the acamprosate graph indicate the mean and SEM for a session in which acamprosate was administered acutely over 2 consecutive days. The points and vertical lines above “V” indicate the mean and SEM for sessions in which vehicle was administered (control). The points with vertical lines in the dose-effect data indicate the mean and SEM for sessions in which the respective drugs were administered. The points without vertical lines indicate instances in which the SEM is encompassed by the point. Numbers in parentheses indicate the number of subjects represented by that data point when it was less than the total number of subjects for that group, because of the elimination of responding in some subjects at doses below the highest dose tested. Asterisks (*) indicate significant differences from control, whereas the bracket and cross (†) indicates significant differences between the response rates for food- and ethanol-maintained behavior.
Figure 2
Figure 2
Cumulative records from subjects 1177 (left) and 1215 (right) showing the within-session pattern of responding under an alternating schedule of ethanol- and food-maintained responding after a control injection (top records). The effects of DHEA (56 mg/kg), naltrexone (56 mg/kg), acamprosate (560 mg/kg), and pregnanolone (5.6 mg/kg) on this pattern of responding are also shown. In each component, the response pen stepped upward with every response and was deflected (‘pipped’) downward after reinforcement. The response pen reset at the edge of the paper or at the completion of a component. Ethanol components alternated after 10 min, whereas food components alternated after 5 min. Session duration was 51 min for DHEA, naltrexone, and acamprosate. Session duration for pregnanolone was approximately 60 min or slightly longer, depending on responding during the changeover delay, which allowed for the extra food component for this drug.
Figure 3
Figure 3
Blood ethanol concentration (BEC) data for rats responding under a multiple FR-10 FR-20 schedule of ethanol and food presentation. Black bars represent BEC data collected after control sessions, whereas grey bars represent BEC data collected after the second determination of the lowest effective dose of DHEA (56 mg/kg, n = 6), naltrexone (56 mg/kg, n = 5), acamprosate (560 mg/kg, n = 6), and pregnanolone (5.6 mg/kg, n = 9). All bars and vertical lines represent the mean and SEM for the subjects in each drug group. Asterisks (*) indicate significant differences from the respective control (p < 0.05).
Figure 4
Figure 4
Effects of different mean variable interval values on the number of food and ethanol reinforcements (top panel), response rate (middle panel), and BEC (bottom panel) in 8 rats responding under a multiple schedule of ethanol (FR-10) and food (VI) presentation. Unfilled circles with vertical lines represent the mean and SEM for these dependent measures in the ethanol component, whereas filled circles with vertical lines represent the mean and SEM for these measures in the food component. The points without vertical lines indicate instances in which the SEM is encompassed by the point. Asterisks (*) indicate significant differences between the number of reinforcers obtained under the various VI schedules of food reinforcement and the number of reinforcers obtained under the FR schedule. Crosses (†) indicate significant differences between food- and ethanol-maintained responding in terms of the number of reinforcers obtained or the overall response rate.
Figure 5
Figure 5
Effects of a single dose of DHEA, naltrexone, acamprosate, and pregnanolone on responding under a multiple schedule of ethanol (FR-10) and food (VI-80) presentation in 9 subjects. Each dose was administered until one of two criteria was met; that is, until either intake did not vary by more than 20% of the mean for 3 days or a total of 8 days, in which case the last 3 of those 8 days were averaged for comparison. The dependent measures were response rate (responses [R]/minute (m), top panel), ethanol dose presented (g/kg, middle panel), and BEC (mg/dL, bottom panel). Bars and vertical lines indicate the grand mean and standard error of the mean (SEM) for the 9 subjects. Asterisks indicate significant differences between drug and control for a particular reinforcer, whereas crosses indicated significant differences between reinforcers (i.e., significant main effects of reinforcer).

Similar articles

Cited by

References

    1. Akk G, Li P, Manion BD, Evers AS, Steinbach JH. Ethanol modulates the interaction of the endogenous neurosteroid allopregnanolone with the alpha1beta2gamma2L GABAA receptor. Molecular Pharmacology. 2007;71:461–472. - PubMed
    1. Amato RJ, Hulin MW, Winsauer PJ. A comparison of dehydroepiandrosterone and 7-keto dehydroepiandrosterone with other drugs that modulate ethanol intake in rats responding under a multiple schedule. Behavioural Pharmacology. 2012;23:250–261. - PMC - PubMed
    1. American Psychiatric Association. Diagnostic and Statistical Manual of Mental Disorders, Text Revision. 4. Washington, DC: American Psychiatric Association; 2000.
    1. Anker JJ, Carroll ME. Sex differences in the effects of allopregnanolone on yohimbine-induced reinstatement of cocaine seeking in rats. Drug and Alcohol Dependence. 2010;107:264–267. - PMC - PubMed
    1. Anker JJ, Carroll ME. Females are more vulnerable to drug abuse than males: evidence from preclinical studies and the role of ovarian hormones. Current Topics in Behavioral Neurosciences. 2011;8:73–96. - PubMed

Publication types

MeSH terms