. 2015 Apr;14(2):249-64.
doi: 10.1111/acel.12310. Epub 2015 Jan 23.

Loss of hepatic chaperone-mediated autophagy accelerates proteostasis failure in aging

Affiliations

Loss of hepatic chaperone-mediated autophagy accelerates proteostasis failure in aging

Jaime L Schneider et al. Aging Cell. 2015 Apr.

Abstract

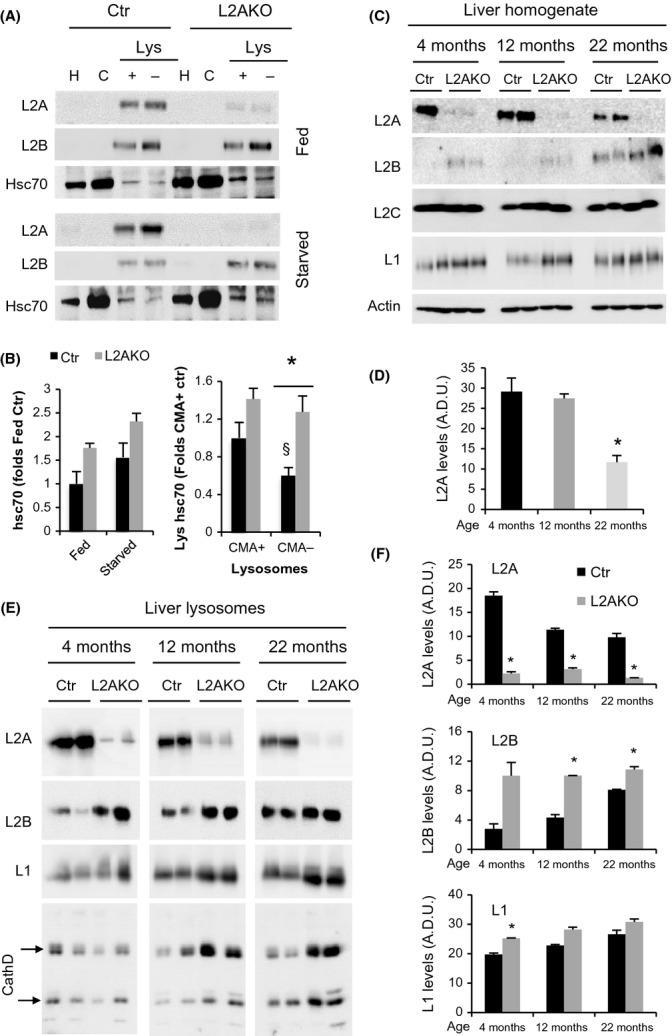
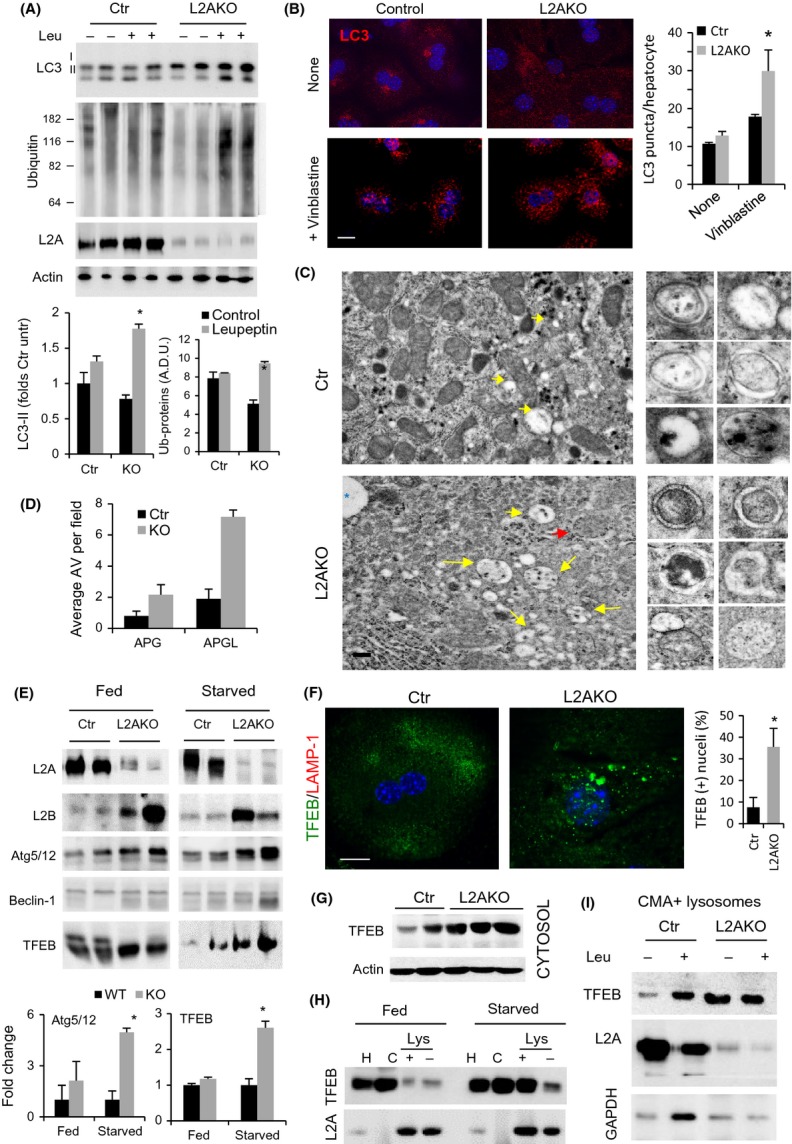
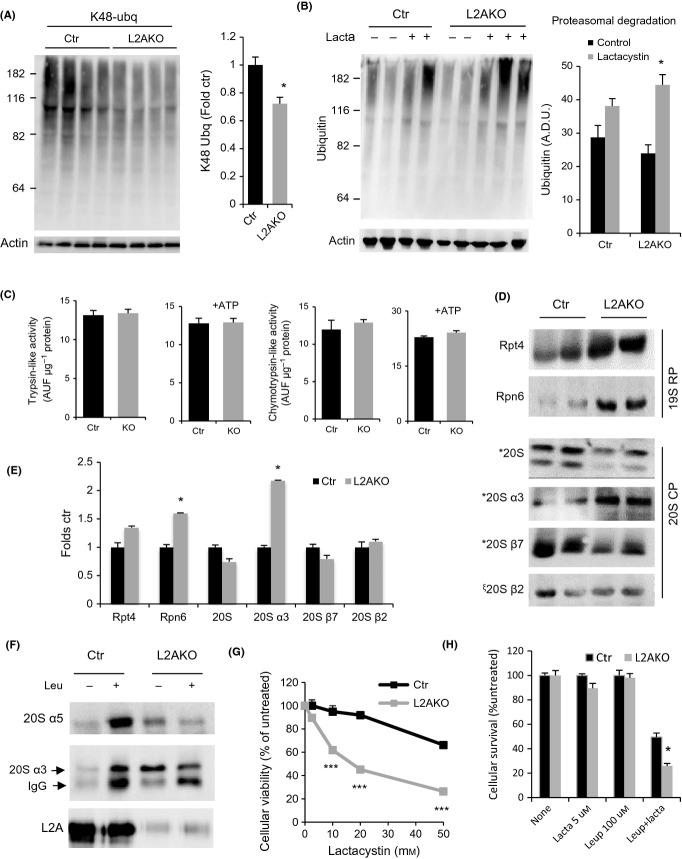
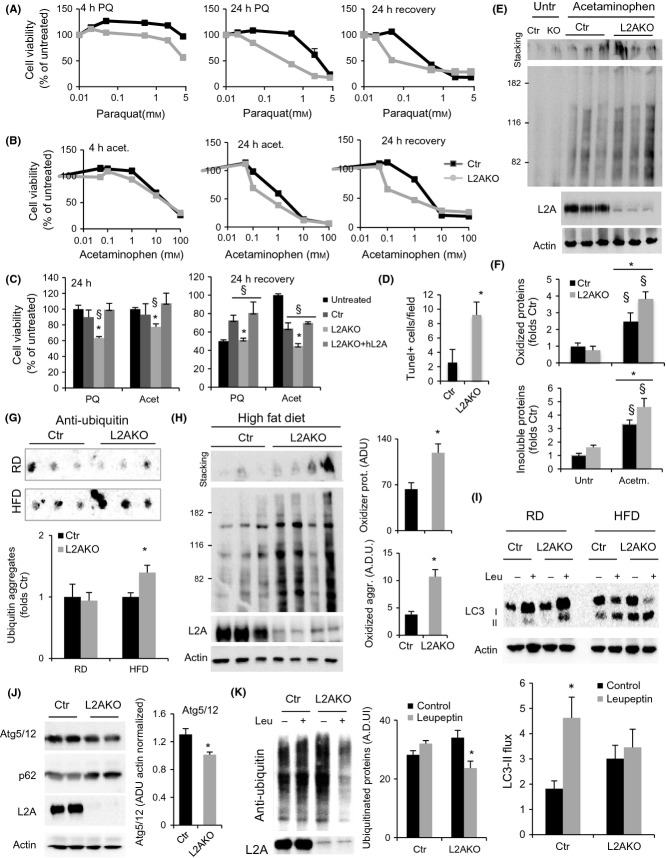
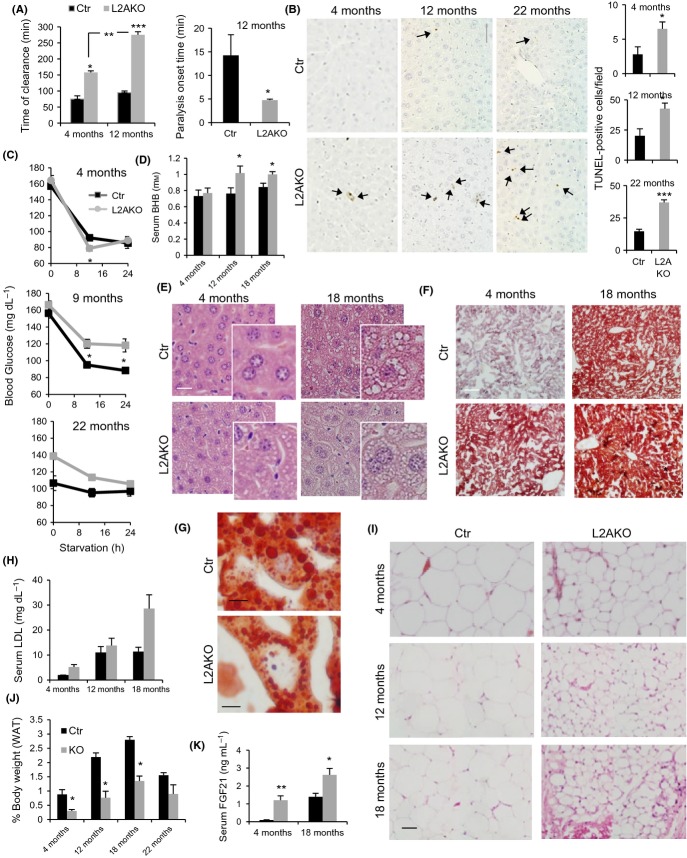
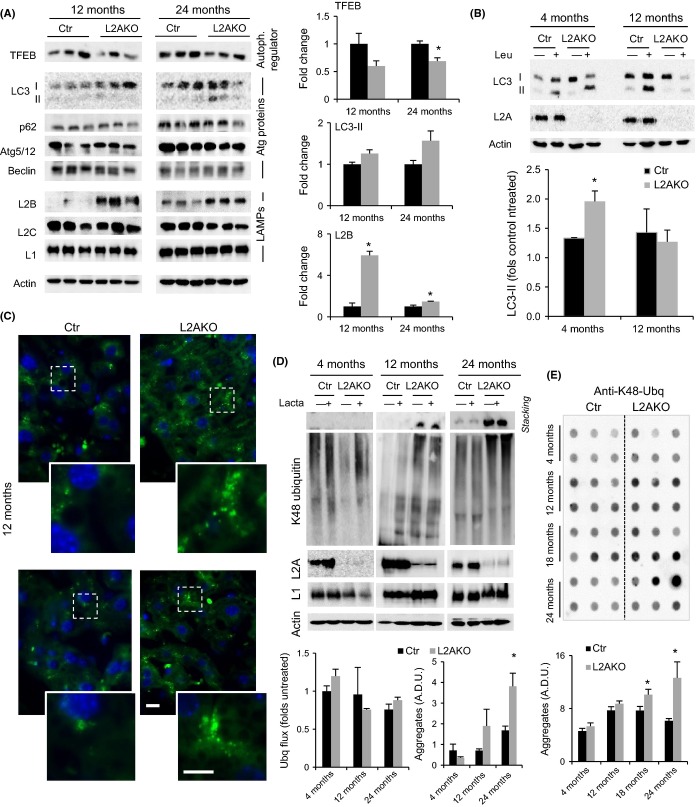
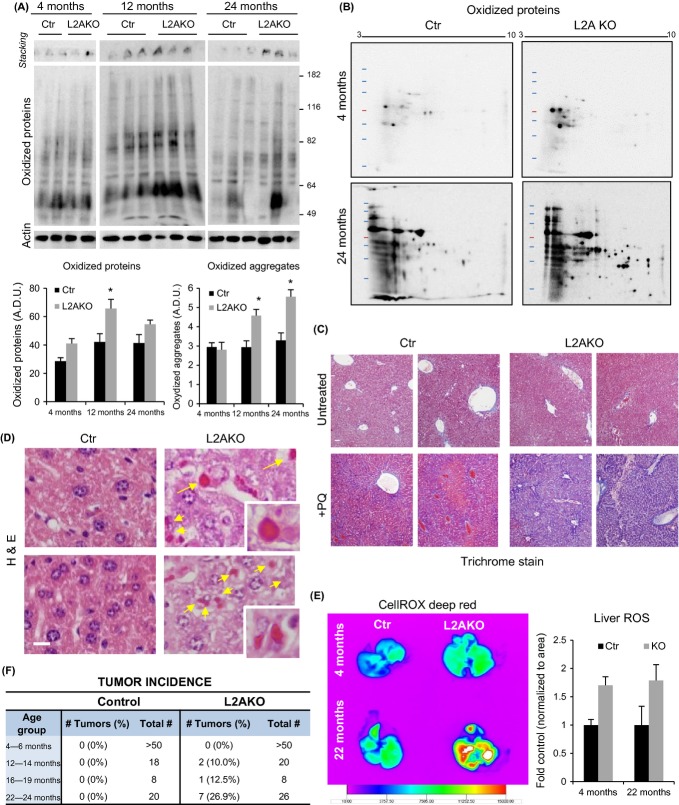
Chaperone-mediated autophagy (CMA), a cellular process that contributes to protein quality control through targeting of a subset of cytosolic proteins to lysosomes for degradation, undergoes a functional decline with age. We have used a mouse model with liver-specific defective CMA to identify changes in proteostasis attributable to reduced CMA activity in this organ with age. We have found that other proteolytic systems compensate for CMA loss in young mice which helps to preserve proteostasis. However, these compensatory responses are not sufficient for protection against proteotoxicity induced by stress (oxidative stress, lipid challenges) or associated with aging. Livers from old mice with CMA blockage exhibit altered protein homeostasis, enhanced susceptibility to oxidative stress and hepatic dysfunction manifested by a diminished ability to metabolize drugs, and a worsening of the metabolic dysregulation identified in young mice. Our study reveals that while the regulatory function of CMA cannot be compensated for in young organisms, its contribution to protein homeostasis can be handled by other proteolytic systems. However, the decline in the compensatory ability identified with age explains the more severe consequences of CMA impairment in older organisms and the contribution of CMA malfunction to the gradual decline in proteostasis and stress resistance observed during aging.

Keywords: autophagy; lysosomal protein degradation; macroautophagy; oxidative stress; protein aggregation; proteotoxicity; ubiquitin-proteasome system.


Figures

Figure 1
Figure 1
Lysosomal changes in CMA-deficient mice mimic those in old mice livers. (A) Immunoblot (IB) of homogenate (H), cytosol (C), and lysosomes (Lys) with high (+) or low (−) CMA activity isolated from livers of fed or 24 h starved control (Ctr) or Albumin-Cre:L2Af/f (L2AKO) mice. Internal controls for the same preparations are shown in Fig. S1A. (B) Quantifications of cytosolic (left) (n = 4) and lysosomal (right) (n = 9) hsc70. (C-F) IB of homogenate (C) and CMA-active lysosomes (E) from 24 h starved Ctr and L2AKO mice of the indicated ages. Quantifications for homogenate (n = 4) and lysosomes (n = 2) are shown in D and F, respectively. All values are expressed as mean ± SEM. Differences with Ctr (*) or with CMA+ lysosomes (§) are significant for *P < 0.05.
Figure 2
Figure 2
Macroautophagy compensates for CMA failure in young mice livers. (A) IB of liver homogenates from 4-month-old Ctr and L2AKO mice i.p. injected with leupeptin 2 h prior tissue dissection. Bottom: quantification, n = 4. (B) Immunofluorescence of LC3 in hepatocytes from Ctr and L2AKO mice treated or not with vinblastine. Right: quantification of average puncta per cell, n = 6 (scale bar: 10 μm). (C) Ultrastructure of livers from Ctr and L2AKO mice. Arrows indicate autophagosomes (APG, red) or autophagolysosomes (APGL, yellow). Inserts on the right show examples of both types of vesicles. Additional fields are shown in Fig. S2A. (scale bar: 5 μm) (D) Morphometric quantification of APG and APGL,n = 4. (E) IB for a panel of macroautophagy-related proteins of livers homogenates from fed or 24 h starved Ctr and L2AKO mice. Bottom: densitometric quantification, n = 4. (F) Immunofluorescence for TFEB (green) in primary hepatocytes isolated from 4-month-old Ctr and L2AKO mice (scale bar: 10 μm). Right: quantification of percentage of cells with nuclear TFEB signal, n = 6. Full filed images are shown in Fig. S2C. (G) IB for TFEB in cytosolic fractions from Ctr and L2AKO mice. (H) IB of homogenates (H), cytosol (C), and lysosomes active (+) or inactive (−) for CMA isolated from livers of fed or 24 h starved Ctr and L2AKO mice. (I) IB of isolated lysosomes active for CMA (CMA+) isolated from livers of Ctr and L2AKO mice treated or not with leupeptin 2 h prior tissue dissection. All values are expressed as mean ± SEM. Differences are significant for *P < 0.05.
Figure 3
Figure 3
Enhanced ubiquitin-proteasome activity in livers from young CMA-deficient mice. (A) Immunoblot (IB) for K48-linked ubiquitinated proteins of liver homogenates from 4-month-old control (Ctr) and Albumin-Cre:L2Af/f (L2AKO) mice. Right: densitometric quantification, n = 10. (B) IB of Ctr and L2AKO mouse livers incubated for 2 h in the presence/absence of lactacystin (lacta). Right: densitometric quantification, n = 4. (C) Proteasome activity against fluorogenic substrates specific for trypsin- or chymotrypsin-like activities measured in the presence or absence of ATP in liver homogenates from Ctr and L2AKO mice, n = 6. (D) IB for subunits of the proteasome core (20S) or regulatory (19S) particles of 4-month-old Ctr and L2AKO mice livers. (E) Densitometric quantification of blots as in D, n = 3. (F) IB of isolated lysosomes active for CMA isolated from livers of 4-month-old Ctr and L2AKO mice treated or not with leupeptin 2 h prior to tissue dissection. (G, H) Cell viability of primary hepatocytes isolated from Ctr and L2AKO mice 24 h after treatment with the indicated concentrations of lactacystin alone (G) or in combination with leupeptin (H), n = 3. All values are expressed as mean ± SEM. Differences are significant for *P < 0.05, aaccumulation of p62, and ***P < 0.001.
Figure 4
Figure 4
Mice with defective hepatic CMA show loss of proteostasis and increased sensitivity to stress. (A) Viability of primary hepatocytes from 4-month-old control (Ctr) and Albumin-Cre:L2Af/f (L2AKO) mice assessed at 4 or 24 h of exposure to increasing concentrations of paraquat (A) or acetaminophen (B), and 24 h after the stressors was removed, n = 3. (C) Viability of L2AKO-deficient cells transfected with an empty vector (L2AKO) or a vector expressing human L2A (+hL2A) upon treatment as indicated, n = 6. (D) Quantification of the number of TUNEL-positive cells per section of liver from Ctr and L2AKO mice 24 h after i.p. injection of acetaminophen (representative images are shown in Fig. S3C), n = 3. (E) Oxyblot of liver homogenates from Ctr and L2AKO livers treated or not with acetaminophen. Insoluble oxidized proteins are retained in the stacking gel. (F) Densitometric quantification of blots as the one shown in E, n = 3. (G,H) Filter retardation assay to assess aggregated poly-ubiquitinated proteins (G) and oxyblot analysis to detect soluble and aggregated oxidized proteins (H) in livers from Ctr and L2AKO mice maintained on a regular chow (RD,n = 9 in G, n = 6 in H) or a high-fat diet (HFD,n = 5 in G, n = 6 in H) for 16 weeks. (I) IB of liver homogenates from Ctr or L2AKO mice treated or not with leupeptin 2 h prior to tissue dissection in the same group of animals as in E. Bottom: densitometric quantification, n = 3. (J,K) IB for the indicated proteins in liver homogenate from Ctr and L2AKO mice maintained on a HFD for 16 weeks. Right: densitometric quantification of Atg5 (n = 6) and ubiquitinated proteins (n = 3). All values are expressed as mean ± SEM. Differences are significant for *P < 0.05 compared to Ctr and for § p < 0.05 compared to untreated.
Figure 5
Figure 5
Metabolic changes in CMA-deficient mice with age. (A) Time of clearance (left) and onset of paralysis (right) measured in 4- and 12-month-old control (Ctr) and Albumin-Cre:L2Af/f (L2AKO) mice after zoxazolamine i.p. injection, n = 4. (B) TUNEL staining of livers from 4-, 12-, and 22-month-old Ctr and L2AKO mice, scale bar 60 μm (1/4 of full field is shown to appreciate details). Arrows indicate TUNEL-positive cells. Right: quantification of 10 different non-overlapping fields, n = 3. (C) Basal and fasting blood glucose levels in 4-, 9-, and 22-month-old Ctr and L2AKO mice, n = 3–6. (D) Serum ketone bodies (beta-hydroxybutyrate) in 24 h starved Ctr and L2AKO mice at indicated ages, n = 4–8. (E,F) Livers from 24 h starved Ctr and L2AKO mice at the indicated ages were stained with H&E (E) or oil red O (ORO) (F) (scale bar, 40 μm). (G) Magnification of ORO-stained 18-month-old Ctr and L2AKO livers to show lipid droplet size. (H) Serum LDL in 24 h starved Ctr and L2AKO mice at indicated ages, n = 4–8. (I) H&E of perigonadal white adipose tissue (WAT) from 24 h starved mice of the indicated ages (scale bar, 100 μm). (J) WAT weight from the same animals, n = 3–4. (K) Serum FGF21 levels in 24 h starved Ctr and L2AKO mice, n = 5–8. All values are expressed as mean ± SEM. Differences are significant for *P < 0.05; **P < 0.01, and ***P < 0.001.
Figure 6
Figure 6
Loss of proteostasis in CMA-deficient mice with age. (A) Immunoblot (IB) of livers from 12- and 24-month-old control (Ctr) and Albumin-Cre:L2Af/f (L2AKO) mice. Right: densitometric quantification, n = 3. (B) LC3 flux in livers from 24 h Ctr and L2AKO mice treated or not with leupeptin 2 h prior to tissue dissection. Bottom: densitometric quantification, n = 3. (C) Autofluorescence in liver sections from 12-month-old Ctr and L2AKO mouse livers. Nuclei are highlighted with DAPI. Insets: higher magnification of boxed regions. Scale bar 10 μm main. (D) IB for ubiquitinated proteins of livers from 24 h starved Ctr and L2AKO mice incubated in the presence or absence of lactacystin. Insoluble proteins are shown in the gel stacking. Bottom: densitometric quantification, n = 3. (E) Filter retardation assay and IB for K48-ubiquitinated proteins from liver homogenates from Ctr and L2AKO mice at the indicated ages. Bottom: quantification of aggregates, n = 6. A.D.U. stands for arbitrary densitometric units. All values are expressed as mean ± SEM. Differences are significant for *P < 0.05.
Figure 7
Figure 7
Enhanced susceptibility to oxidative stress of CMA-deficient mice. (A) One-dimensional oxyblot analysis to detect soluble and aggregated oxidized proteins in 4-, 12-, and 24-month-old control (Ctr) and Albumin-Cre:L2Af/f (L2AKO) mice. Bottom: densitometric quantification, n = 4–6. (B) Two-dimensional electrophoresis followed by oxyblot analysis in livers from 4- and 24-month-old Ctr and L2AKO mice. (C) Trichrome stain of livers from 22-month-old Ctr and L2AKO mice treated or not with two low-dose injections of paraquat 1 week prior and one high-dose injection of paraquat 24 h prior to tissue collection. (D) H&E stain of the same livers as in (C) to show the appearance of intracellular Mallory bodies (yellow arrows and insets) in L2AKO mice. (E) Ex vivo imaging of livers extracted from Ctr and L2AKO mice of the indicated ages treated with paraquat, after injection of a fluorogenic probe for the detection of ROS. Right: quantification of ROS levels, n = 3. (F) Tumor incidence in Ctr and L2AKO mice from different age groups. All values are expressed as mean ± SEM. Differences are significant for *P < 0.05.

Similar articles

Cited by

References

    1. Amador-Noguez D, Dean A, Huang W, Setchell K, Moore D, Darlington G. Alterations in xenobiotic metabolism in the long-lived Little mice. Aging Cell. 2007;6:453–470. - PMC - PubMed
    1. Aniento F, Papavassiliou AG, Knecht E, Roche E. Selective uptake and degradation of c-Fos and v-Fos by rat liver lysosomes. FEBS Lett. 1996;390:47–52. - PubMed
    1. Bandyopadhyay U, Kaushik S, Varticovski L, Cuervo AM. The chaperone-mediated autophagy receptor organizes in dynamic protein complexes at the lysosomal membrane. Mol. Cell. Biol. 2008;28:5747–5763. - PMC - PubMed
    1. Chen WD, Fu X, Dong B, Wang YD, Shiah S, Moore DD, Huang W. Neonatal activation of the nuclear receptor CAR results in epigenetic memory and permanent change of drug metabolism in mouse liver. Hepatology. 2012;56:1499–1509. - PMC - PubMed
    1. Chiang H, Terlecky S, Plant C, Dice JF. A role for a 70-kilodalton heat shock protein in lysosomal degradation of intracellular proteins. Science. 1989;246:382–385. - PubMed

Publication types

Substances