

Effects of eliminating drug caps on racial differences in antidepressant use among dual enrollees with diabetes and depression
- PMID: 25620439
- PMCID: PMC4390474
- DOI: 10.1016/j.clinthera.2014.12.011
Effects of eliminating drug caps on racial differences in antidepressant use among dual enrollees with diabetes and depression
Abstract
Purpose: Black patients with diabetes are at greater risk of underuse of antidepressants even when they have equal access to health insurance. This study aimed to evaluate the impact of removing a significant financial barrier to prescription medications (drug caps) on existing black-white disparities in antidepressant treatment rates among patients with diabetes and comorbid depression.
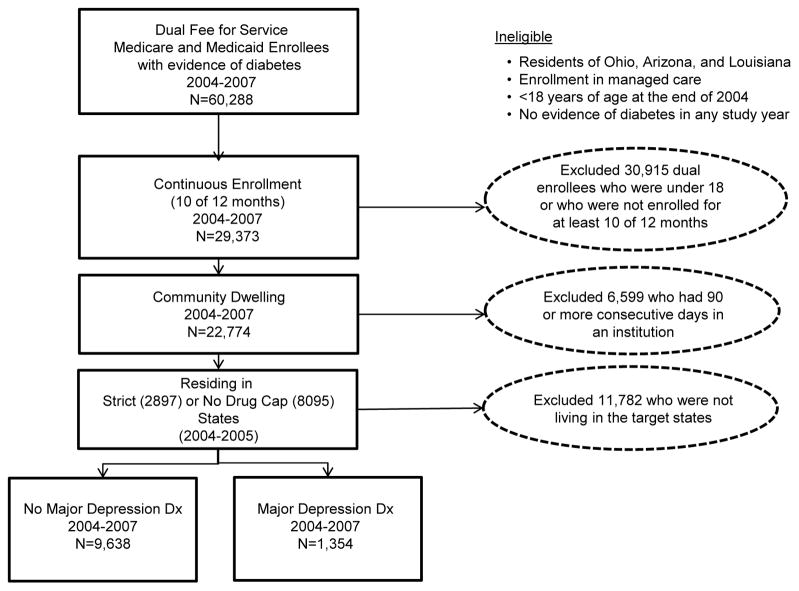
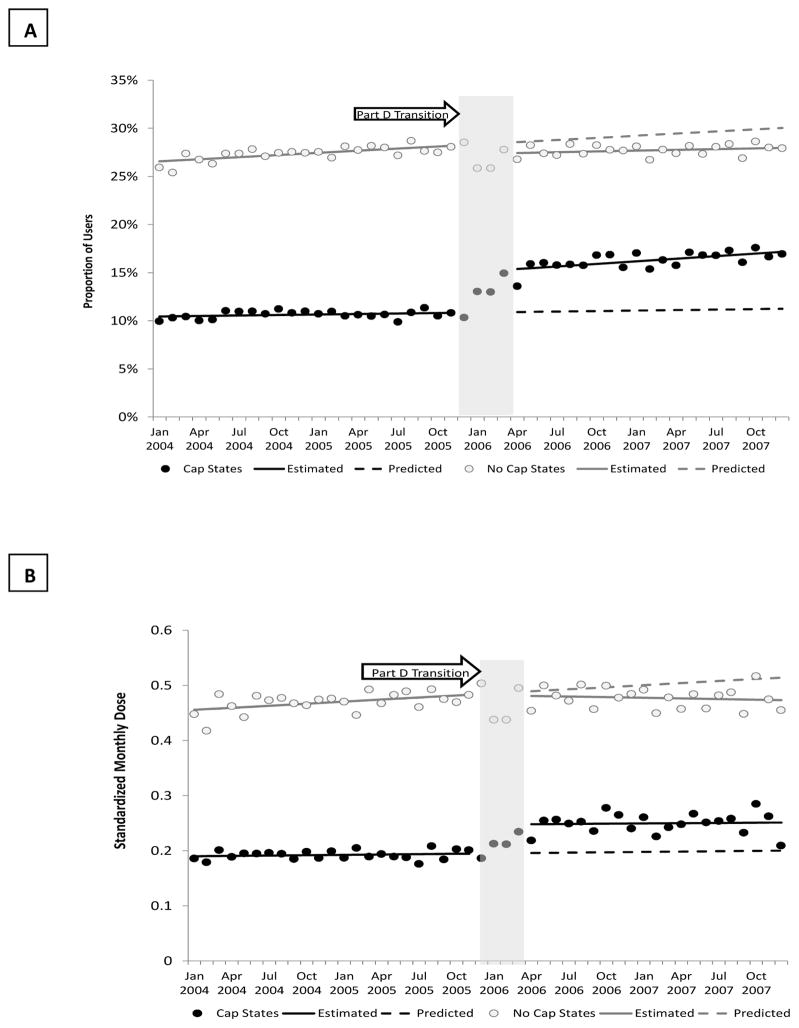
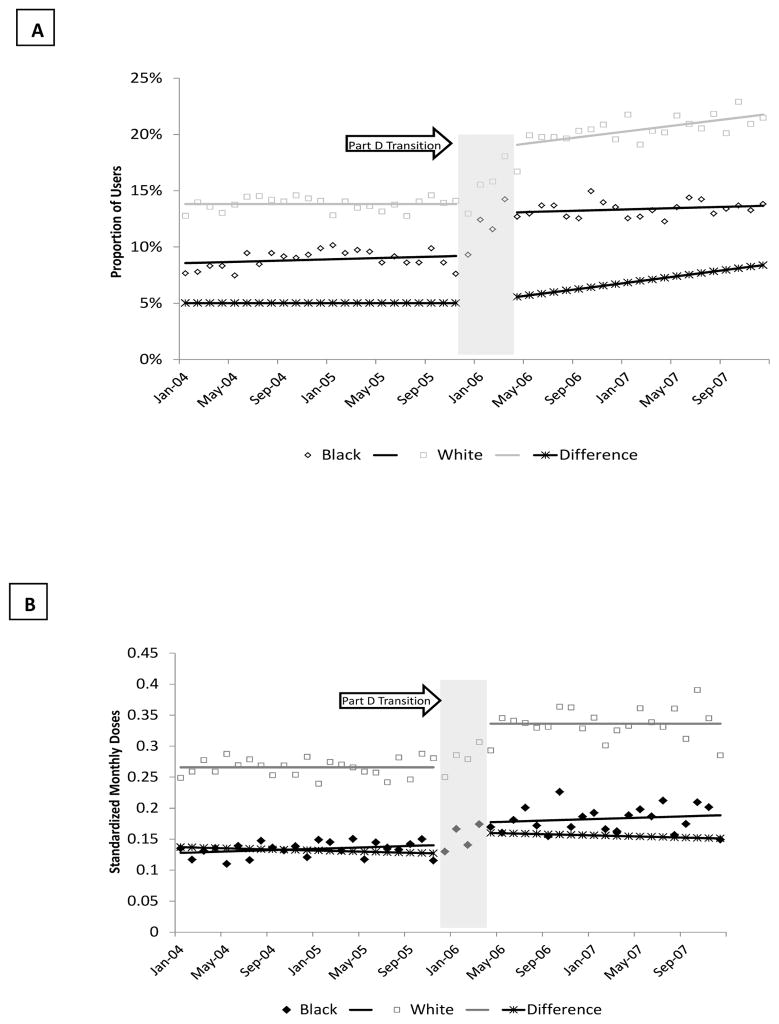
Methods: We used an interrupted time series with comparison series design and a 5% representative sample of all fee-for-service Medicare and Medicaid dual enrollees to evaluate the removal of drug caps on monthly antidepressant treatment rates. We evaluated the impact of drug cap removal on racial gaps in treatment by modeling the month-to-month white-black difference in use within age strata (younger than 65 years of age or 65 years of age or older). We compared adult dual enrollees with diabetes and comorbid depression living in states with strict drug caps (n = 221) and those without drug caps (n = 1133) before the policy change. Our primary outcome measures were the proportion of patients with any antidepressant use per month and the mean standardized monthly doses (SMDs) of antidepressants per month.
Findings: The removal of drug caps in strict drug cap states was associated with a sudden increase in the proportion of patients treated for depression (4 percentage points; 95% CI, 0.03-0.05, P < 0.0001) and in the intensity of antidepressant use (SMD: 0.05; 95% CI, 0.03-0.07, P < 0.001). Although antidepressant treatment rates increased for both white and black patients, the white-black treatment gap increased immediately after Part D (0.04 percentage points; 95% CI, 0.01-0.08) and grew over time (0.04 percentage points per month; 95% CI, 0.002-0.01; P < 0.001).
Implications: Policies that remove financial barriers to medications may increase depression treatment rates among patients with diabetes overall while exacerbating treatment disparities. Tailored outreach may be needed to address nonfinancial barriers to mental health services use among black patients with diabetes.
Keywords: access to care; comorbidity; diabetes; disparities; health policy.
Copyright © 2015 Elsevier HS Journals, Inc. All rights reserved.
Conflict of interest statement
The authors report no conflicts of interest that could inappropriately influence this work. The study finders had not role in the design, collection, analysis, interpretation of the data, writing of the manuscript or in the decision to submit the manuscript for publication.
The authors report no conflicts of interest.
Figures
References
-
- Wong MD, Shapiro MF, Boscardin WJ, Ettner SL. Contribution of major diseases to disparities in mortality. N Engl J Med. 2002 Nov 14;347(20):1585–92. - PubMed
-
- Andersen RJ, Freedland KE, Clouse RE, Lustman PJ. The prevalence of comorbid depression in adults with diabetes: A meta-analysis. Diabetes Care. 2001;24:1069–1078. - PubMed
-
- Ciechanowski PS, Katon WJ, Russo JE. Depression and diabetes: Impact of depressive symptoms on adherence, function and costs. Arch Intern Med. 2000;160:3278–3285. - PubMed
Publication types
MeSH terms
Substances
Grants and funding
- K01 HS018072/HS/AHRQ HHS/United States
- U24CA171524/CA/NCI NIH HHS/United States
- K01HS018072/HS/AHRQ HHS/United States
- U58 DP002721/DP/NCCDPHP CDC HHS/United States
- R01DK080726/DK/NIDDK NIH HHS/United States
- U24 CA171524/CA/NCI NIH HHS/United States
- U58DP002721/DP/NCCDPHP CDC HHS/United States
- 1R01 HS018577/HS/AHRQ HHS/United States
- R01 AG032249/AG/NIA NIH HHS/United States
- 5R01AG032249/AG/NIA NIH HHS/United States
- R01 DK080726/DK/NIDDK NIH HHS/United States
- K01 MH092338/MH/NIMH NIH HHS/United States
- P30 DK092924/DK/NIDDK NIH HHS/United States
- K01MH092338/MH/NIMH NIH HHS/United States
- P30DK092924/DK/NIDDK NIH HHS/United States
- R01 HS018577/HS/AHRQ HHS/United States
LinkOut - more resources
Full Text Sources
Other Literature Sources
Medical
Miscellaneous
