. 2014 Dec 23;2015(7):1-15.
doi: 10.2147/EB.S69713.

Cortical inputs to the middle temporal visual area in New World owl monkeys

Affiliations

Cortical inputs to the middle temporal visual area in New World owl monkeys

Christina M Cerkevich et al. Eye Brain. .

Abstract

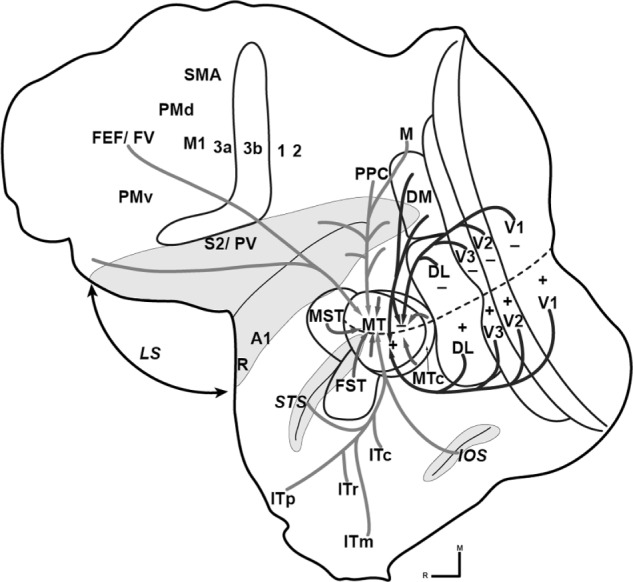
We made eight retrograde tracer injections into the middle temporal visual area (MT) of three New World owl monkeys (Aotus nancymaae). These injections were placed across the representation of the retina in MT to allow us to compare the locations of labeled cells in other areas in order to provide evidence for any retinotopic organization in those areas. Four regions projected to MT: 1) early visual areas, including V1, V2, V3, the dorsolateral visual area, and the dorsomedial visual area, provided topographically organized inputs to MT; 2) all areas in the MT complex (the middle temporal crescent, the middle superior temporal area, and the fundal areas of the superior temporal sulcus) projected to MT. Somewhat variably across injections, neurons were labeled in other parts of the temporal lobe; 3) regions in the location of the medial visual area, the posterior parietal cortex, and the lateral sulcus provided other inputs to MT; 4) finally, projections from the frontal eye field, frontal visual field, and prefrontal cortex were also labeled by our injections. These results further establish the sources of input to MT, and provide direct evidence within and across cases for retinotopic patterns of projections from early visual areas to MT.

Keywords: middle temporal area; parietal cortex; visual cortex.


Conflict of interest statement

Disclosure

The authors report no conflicts of interest in this work.

Figures

Figure 1
Figure 1
Histology of MT and locations of injection sites. Notes: (A and B) Photomicrographs of the MT complex as revealed by staining for myelinated fibers (A) and CO (B) in case 1. Dashed lines are the reconstructed borders of the areas in the MT complex in this case. Because these borders were reconstructed using all sections through the depth of cortex, they cannot be perfectly aligned with those visible in any single section. Arrowheads indicate tissue damaged as a result of each of the three injections. In flattened cortex, MT is indicated by heavy staining for myelinated fibers and CO around the caudal tip of the more lightly stained STS. Scale bars are 2 mm. (C) The locations of injection sites in MT. Solid lines are the borders of areas drawn by aligning all three cases. The visual field coordinates in MT are based on the accepted map of visual space in MT and the locations of labeled cells in V1. Dashed lines indicate the estimated locations of the horizontal meridian (thick) and the representations of central (caudal) and peripheral (rostral) vision at 20° of visual space (fine). The upper visual field (+) is represented laterally, and the lower visual field (−) medially. Markers are the locations of the injections in each case: case 1= stars, case 2= squares, case 3= circles. The shade of each marker indicates the type of tracer: Cholera toxin subunit B = white, Fluoro-Ruby = dark gray, diamidino yellow = light gray. Rostral is left and medial is up. Abbreviations: CO, cytochrome oxidase; FSTd, dorsal fundal area of the superior temporal sulcus; FSTv, ventral fundal area of the superior temporal sulcus; MST, middle superior temporal area; MT, middle temporal visual area; MTc, middle temporal crescent; STS, superior temporal sulcus.
Figure 2
Figure 2
The distribution of cells labeled by the injections in case 1. Notes: (A) The distribution of DY-labeled cells in case 1. Thin black lines are anatomical borders. Thick black lines indicate the edges of the sections and tears. Sulci are shaded in gray. Anatomical boundaries were determined from adjacent sections stained for myelin and CO, and from measurements based on previously published studies where these were unclear. The dashed line denotes location of the horizontal meridian estimated from descriptions of its location throughout the literature on the cortical visual system and based on the distribution of our labeled cells. (B) The distribution of FR (red)-labeled cells in case 1. These two fluorescent tracers were plotted on the same sections, but are shown separately to better show the locations of labeled cells in regions where there is a high degree of overlap. Each yellow triangle or red square represents a single DY- or FR-filled neuron, respectively. The injection cores and full extent of the surrounding diffusion zone are outlined in matching colors, with the core more heavily shaded. The overall distribution of cells was similar after all injections in case 1, with neurons in V1, V2, V3, DL, MT, MTc, MST, FST, M, PPC, and the inferior temporal and frontal cortices. Comparing the locations of labeled cells resulting from each injection, it is evident that retinotopically organized visual areas send organized projections to MT. Rostral is left and medial is up. Scale bars are 5 mm. “−” indicates the lower visual field, and “+” the upper visual field. “1” and “2” are the caudal somatosensory areas. “3a” is the rostral somatosensory area, and “3b” the primary somatosensory area. Abbreviations: A1, primary auditory area; CO, cytochrome oxidase; DL, dorsolateral visual area; DM, dorsomedial visual area; DY, diamidino yellow; FEF, frontal eye field; FR, Fluoro-Ruby; FST, fundal area of the superior temporal sulcus; FSTd, dorsal fundal area of the superior temporal sulcus; FSTv, ventral fundal area of the superior temporal sulcus; FV, frontal visual area; IOS, inferior occipital sulcus; ITc, caudal inferior temporal cortex; ITm, medial inferior temporal cortex; ITp, polar inferior temporal cortex; ITr, rostral inferior temporal cortex; LS, lateral sulcus; M, medial visual area; M1, primary motor area; MST, middle superior temporal area; MT, middle temporal visual area; MTc, middle temporal crescent; PMd, dorsal premotor area; PMv, ventral premotor area; PPC, posterior parietal cortex; PV, parietal ventral area; R, rostral auditory area; S2, secondary somatosensory area; SMA, supplementary motor area; STS, superior temporal sulcus; V1, first visual area; V2, second visual area; V3, third visual area.
Figure 3
Figure 3
The distribution of cells labeled by the injections in case 2. Notes: (A) The distribution of CTB-labeled cells in case 2. (B) The distribution of DY (yellow)-and FR (red)-labeled cells in case 2. The three injections in case 2 revealed similar projections to MT as those demonstrated in case 1. Cells were labeled by each tracer in regions of retinotopically organized areas that match the locations of the tracers. Labeled cells were also distributed broadly across temporal, parietal, and frontal cortex. Rostral is left and medial is up. Scale bars are 5 mm. “−” indicates the lower visual field, and “+” the upper visual field. “1” and “2” are the caudal somatosensory areas. “3a” is the rostral somatosensory area, and “3b” the primary somatosensory area. Abbreviations: A1, primary auditory area; CTB, cholera toxin subunit B; DL, dorsolateral visual area; DM, dorsomedial visual area; DY, diamidino yellow; FEF, frontal eye field; FR, Fluoro-Ruby; FSTd, dorsal fundal area of the superior temporal sulcus; FSTv, ventral fundal area of the superior temporal sulcus; FV, frontal visual area; IOS, inferior occipital sulcus; ITc, caudal inferior temporal cortex; ITm, medial inferior temporal cortex; ITp, polar inferior temporal cortex; ITr, rostral inferior temporal cortex; LS lateral sulcus; M, medial visual area; M1, primary motor area; MST, middle superior temporal area; MT, middle temporal visual area; MTc, middle temporal crescent; PMd, dorsal premotor area; PMv, ventral premotor area; PPC, posterior parietal cortex; PV, parietal ventral area; R, rostral auditory area; S2, secondary somatosensory area; SMA, supplementary motor area; STS, superior temporal sulcus; V1, first visual area; V2, second visual area; V3, third visual area.
Figure 4
Figure 4
The distribution of cells labeled by the injections in case 3. Notes: (A) The distribution of FR (red)-labeled cells in case 3. (B) The distribution of DY (yellow)-labeled cells in case 3. While FR and DY were plotted on the same sections, they are shown separately here to better show overlapping projections. Labeled neurons were in all early visual areas, all areas in the MT complex, in IT, PPC, and the FEF. Many of these projections to MT are topographically organized. Rostral is left and medial is up. Scale bars are 5 mm. “−” indicates the lower visual field, and “+” the upper visual field. “1” and “2” are the caudal somatosensory areas. “3a” is the rostral somatosensory area, and “3b” the primary somatosensory area. Abbreviations: A1, primary auditory area; DL, dorsolateral visual area; DM, dorsomedial visual area; DY, diamidino yellow; FEF, frontal eye field; FR, Fluoro-Ruby; FSTd, dorsal fundal area of the superior temporal sulcus; FSTv, ventral fundal area of the superior temporal sulcus; FV, frontal visual area; IOS, inferior occipital sulcus; IT, inferior temporal cortex; ITc, caudal inferior temporal cortex; ITm, medial inferior temporal cortex; ITp, polar inferior temporal cortex; ITr, rostral inferior temporal cortex; LS, lateral sulcus; M, medial visual area; M1, primary motor visual area MST, middle superior temporal area; MT, middle temporal visual area; MTc, middle temporal crescent; PMd, dorsal premotor area; PMv, ventral premotor area; PPC, posterior parietal cortex; PV, parietal ventral area; R, rostral auditory area; S2, secondary somatosensory area; SMA, supplementary motor area; STS, superior temporal sulcus; V1, first visual area; V2, second visual area; V3, third visual area.
Figure 5
Figure 5
Summary of corticocortical projections to MT. Notes: MT receives inputs from throughout cortex. Retinotopically organized projections to MT arise from all early visual areas (dark gray arrows). MT has strong intrinsic connections within itself, as well as inputs from other areas in the MT complex (medium gray arrows). Other areas in the inferior temporal cortex, the PPC, and regions of the frontal cortex also provide input to MT (light gray arrows). The organization of these projections is sometimes clear, as those from the FEF are distributed across the central-peripheral axis of the visual field, and sometimes unclear, as those from IT appear to be mixed with no clear separation of inputs. Rostral is left and medial is up. “−” indicates the lower visual field, and “+” the upper visual field. “1” and “2” are the caudal somatosensory areas. “3a” is the rostral somatosensory area, and “3b” the primary somatosensory area. Abbreviations: A1, primary auditory area; DL, dorsolateral visual area; DM, dorsomedial visual area; FEF, frontal eye field; FST, fundal area of the superior temporal sulcus; FV, frontal visual area; IOS, inferior occipital sulcus; IT, inferior temporal cortex; ITc, caudal inferior temporal cortex; ITm, medial inferior temporal cortex; ITp, polar inferior temporal cortex; ITr, rostral inferior temporal cortex; LS, lateral sulcus; M, medial visual area; M1, primary motor area; MST, middle superior temporal area; MT, middle temporal visual area MTc, middle temporal crescent; PMd, dorsal premotor area; PMv, ventral premotor area; PPC, posterior parietal cortex; PV, parietal ventral area; R, rostral auditory area; S2, secondary somatosensory area; SMA, supplementary motor area; STS, superior temporal sulcus; V1, first visual area; V2, second visual area; V3, third visual area.

Similar articles

Cited by

References

    1. Allman JM, Kaas JH. A representation of the visual field in the caudal third of the middle temporal gyrus of the owl monkey (Aotus trivirgatus) Brain Res. 1971;31(1):85–105. - PubMed
    1. Allman JM, Kaas JH. Representation of the visual field in striate and adjoining cortex of the owl monkey (Aotus trivirgatus) Brain Res. 1971;35(1):89–106. - PubMed
    1. Allman JM, Kaas JH, Lane RH. The middle temporal visual area (MT) in the bushbaby, Galago senegalensis. Brain Res. 1973;57(1):197–202. - PubMed
    1. Malonek D, Tootell RB, Grinvald A. Optical imaging reveals the functional architecture of neurons processing shape and motion in owl monkey area MT. Proc Biol Sci. 1994;258(1352):109–119. - PubMed
    1. Xu X, Collins CE, Kaskan PM, Khaytin I, Kaas JH, Casagrande VA. Optical imaging of visually evoked responses in prosimian primates reveals conserved features of the middle temporal visual area. Proc Natl Acad Sci U S A. 2004;101(8):2566–2571. - PMC - PubMed

LinkOut - more resources