. 2015 Jan 7:8:427.
doi: 10.3389/fnins.2014.00427. eCollection 2014.

High-resolution diffusion kurtosis imaging at 3T enabled by advanced post-processing

Affiliations

High-resolution diffusion kurtosis imaging at 3T enabled by advanced post-processing

Siawoosh Mohammadi et al. Front Neurosci. .

Abstract

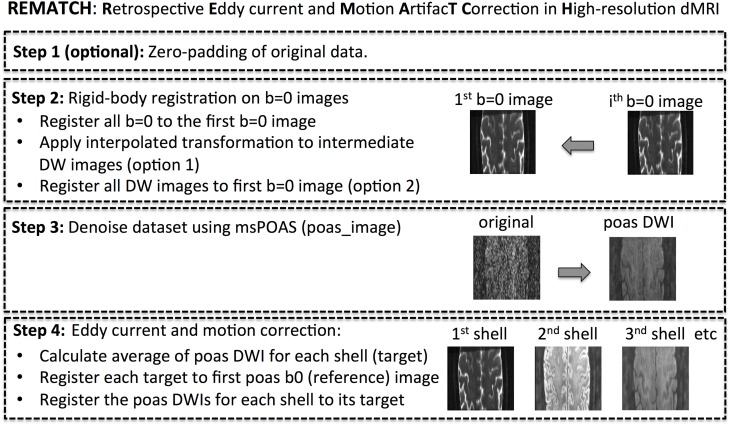
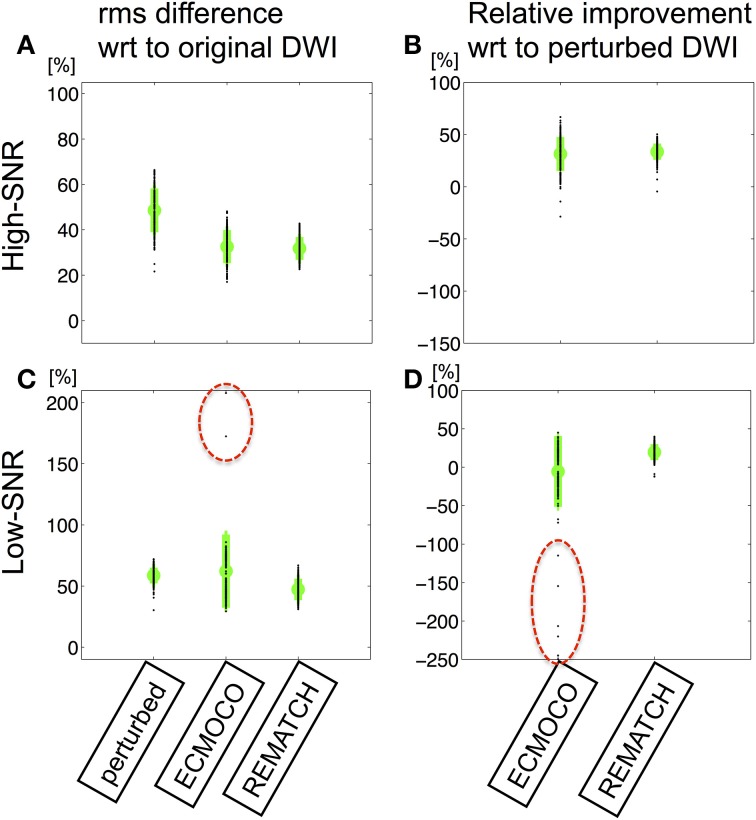
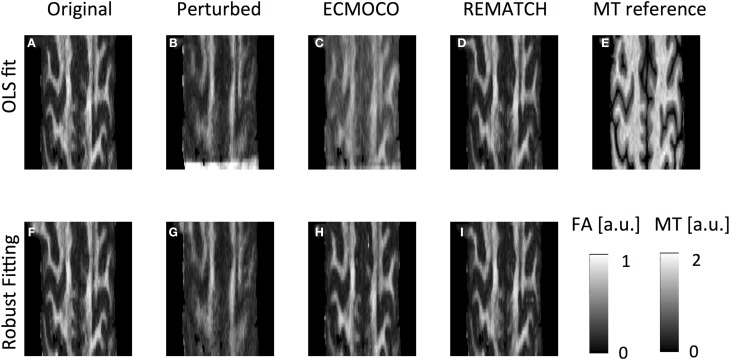
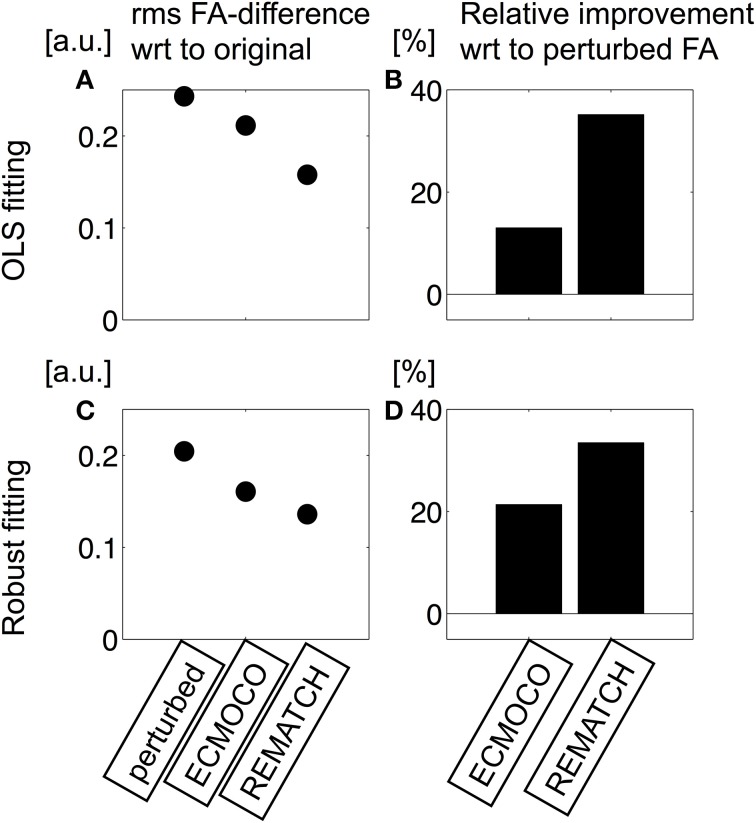
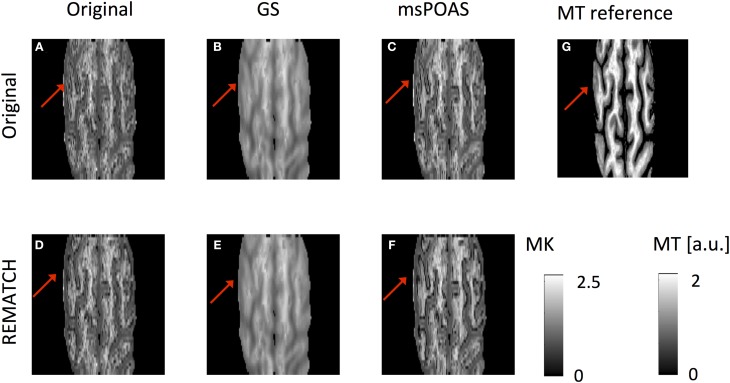
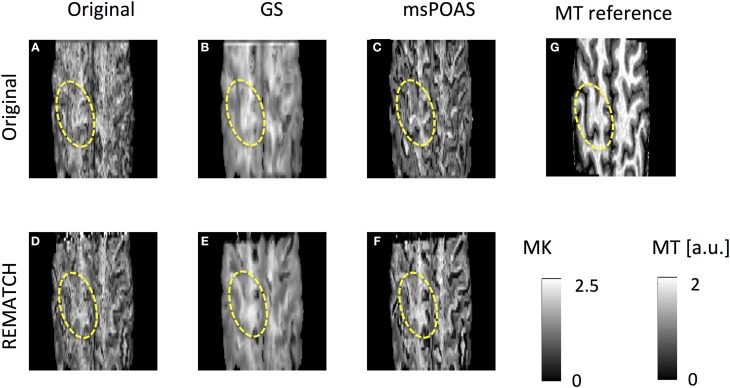
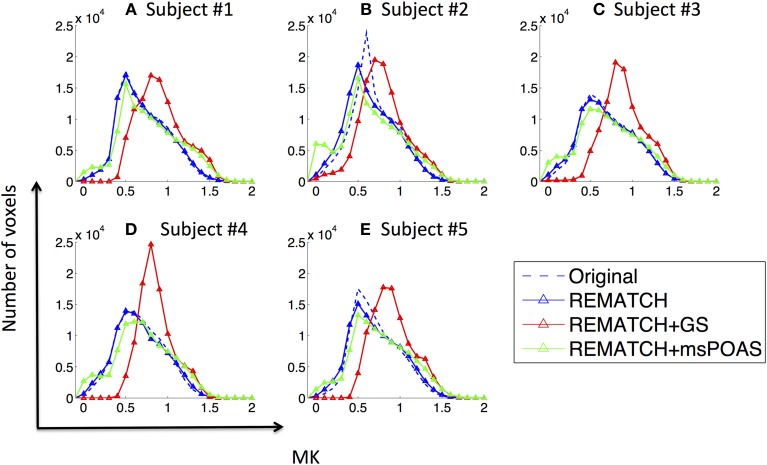
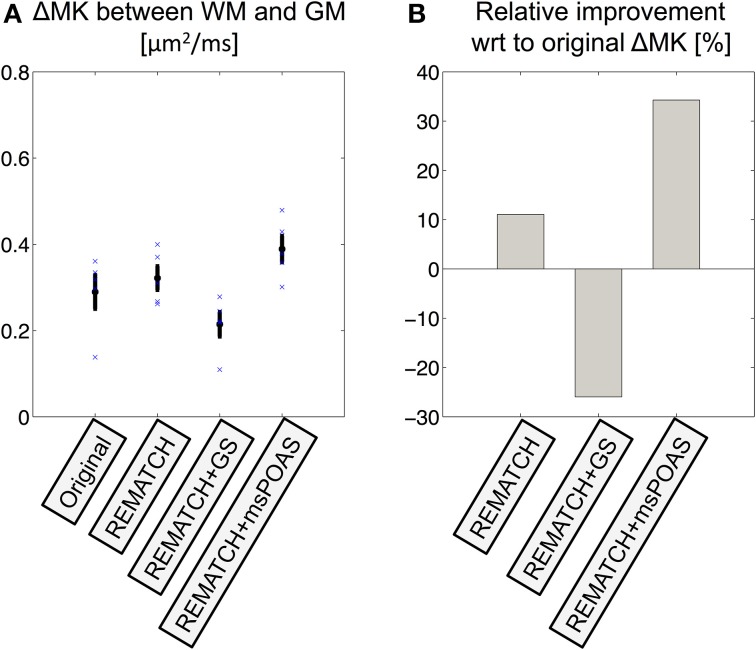
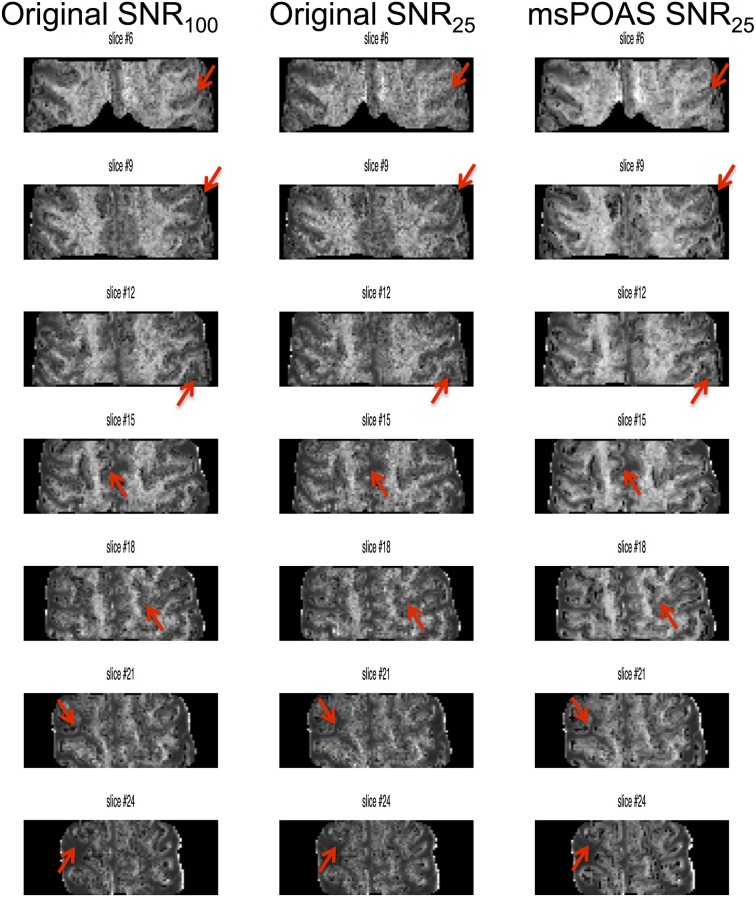
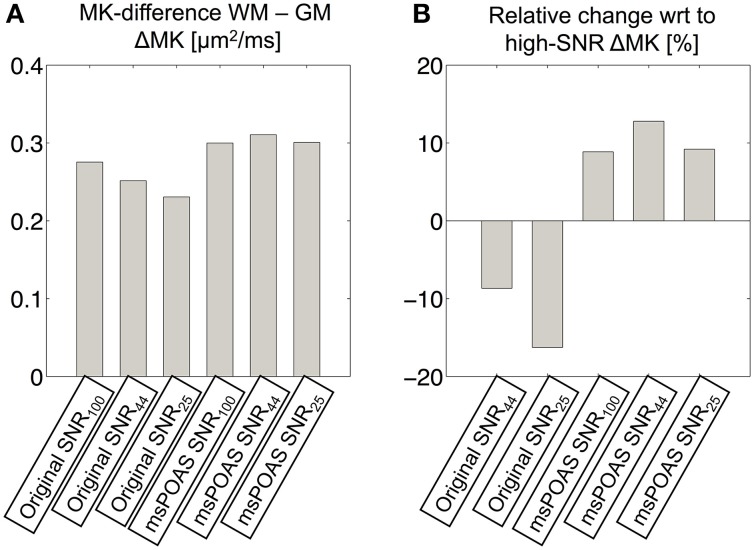
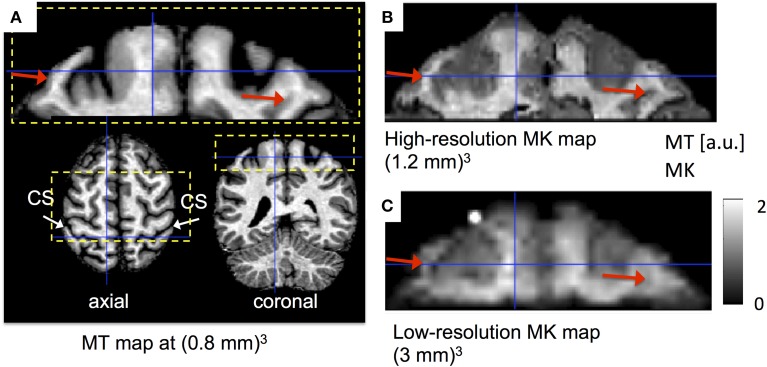
Diffusion Kurtosis Imaging (DKI) is more sensitive to microstructural differences and can be related to more specific micro-scale metrics (e.g., intra-axonal volume fraction) than diffusion tensor imaging (DTI), offering exceptional potential for clinical diagnosis and research into the white and gray matter. Currently DKI is acquired only at low spatial resolution (2-3 mm isotropic), because of the lower signal-to-noise ratio (SNR) and higher artifact level associated with the technically more demanding DKI. Higher spatial resolution of about 1 mm is required for the characterization of fine white matter pathways or cortical microstructure. We used restricted-field-of-view (rFoV) imaging in combination with advanced post-processing methods to enable unprecedented high-quality, high-resolution DKI (1.2 mm isotropic) on a clinical 3T scanner. Post-processing was advanced by developing a novel method for Retrospective Eddy current and Motion ArtifacT Correction in High-resolution, multi-shell diffusion data (REMATCH). Furthermore, we applied a powerful edge preserving denoising method, denoted as multi-shell orientation-position-adaptive smoothing (msPOAS). We demonstrated the feasibility of high-quality, high-resolution DKI and its potential for delineating highly myelinated fiber pathways in the motor cortex. REMATCH performs robustly even at the low SNR level of high-resolution DKI, where standard EC and motion correction failed (i.e., produced incorrectly aligned images) and thus biased the diffusion model fit. We showed that the combination of REMATCH and msPOAS increased the contrast between gray and white matter in mean kurtosis (MK) maps by about 35% and at the same time preserves the original distribution of MK values, whereas standard Gaussian smoothing strongly biases the distribution.

Keywords: DKI; DTI; adaptive smoothing; diffusion kurtosis; eddy current and motion artifacts; gray matter; high-resolution; multi-shell dMRI.


Figures

Figure 1
Figure 1
Flowchart of proposed eddy current and motion correction method for high-resolution diffusion MRI data.
Figure 2
Figure 2
One example of one set of (A) motion and (B) eddy current distortion parameters used to perturb the DW images.
Figure 3
Figure 3
The amount of residual misregistration is assessed by the root-mean-square (rms) difference between pseudo ground truth and perturbed DW images after post-processing: (i) no correction (perturbed), (ii) correction using ECMOCO, (iii) correction using REMATCH. (A,B) The rms difference (A) and the relative (B) rms difference with respect to the perturbed DW maps for the high-SNR data. (C,D) The same as in (A,B) for low-SNR data. The mean and standard deviation of rms difference over DW images is depicted in green and individual rms differences are depicted as black dots. For the high-SNR data ECMOCO and REMATCH performed similarly, whereas for the low-SNR data REMATCH outperformed ECMOCO. At low SNR ECMOCO produced outliers, i.e., incorrectly registered images (black dots highlighted in C,D).
Figure 4
Figure 4
Visual inspection of effect of misregistration on FA maps. To calculate the FA, different datasets were used: (A,F) pseudo ground truth, (B,G) perturbed, (C,H) perturbed ECMOCO-processed, and (D,I) perturbed REMATCH-processed data. Furthermore, the diffusion tensor was fitted with different methods: (A–D) ordinary least squares (OLS), (F-H) robust fitting. (E) FA maps were compared with structural reference map (here: Magnetization Transfer imaging). FA map of perturbed data appeared blurrier than before and less structure was visible. After ECMOCO the FA map was biased using OLS, but the bias was removed when using robust fitting.
Figure 5
Figure 5
Quantitative assessment of the effect of misregistration on FA maps (based on the same FA maps as in Figure 4). To this end, the rms difference in FA (A,C) and the relative difference (B,D) with respect to the perturbed FA map was calculated. If OLS fitting was used (A,B), ECMOCO decreased the rms difference in FA by only 13%, whereas REMATCH decreased the rms difference by about 35%. If robust fitting was used (C,D), the rms difference in FA was more similar between both methods, ECMOCO (21%) and REMATCH (33%).
Figure 6
Figure 6
The MK map for one representative subject after six post-processing methods: (A) none, (B) GS, (C) msPOAS, (D) REMATCH, (E) REMATCH and GS, (F) REMATCH, and msPOAS, as well as a high-resolution magnetization transfer (MT) map as a reference map for neuroanatomy (g). While GS not only denoised the data but also biased the contrast, msPAOS only denoised the MK maps. Neuroanatomical differences with respect to the MT reference image were highlighted.
Figure 7
Figure 7
Same as in Figure 4 for one subject, who was scanned over two sessions: (A) none, (B) GS, (C) msPOAS, (D) REMATCH, (E) REMATCH and GS, (F) REMATCH and msPOAS, as well as a high-resolution magnetization transfer (MT) map as a reference map for neuroanatomy (G). The resulting MK maps were altered by artifacts associated with large-scale motion, leading to neuroanatomical shape differences as compared to the MT reference map (highlighed). This bias in the MK maps could be reduced when using REMATCH.
Figure 8
Figure 8
The effect of post-processing on the distribution of mean kurtosis (MK) values within the brain for each subject (A–E). The original distribution had two maxima (around MK = 0.5 and MK = 1) for all subjects. Gaussian smoothing strongly changed the MK distribution, e.g., the maximum around MK = 0.5 was shifted to higher MK values. msPOAS and REMATCH changed the location of the maxima less prominently.
Figure 9
Figure 9
The effect of post-processing on the MK contrast between GM and WM. (A) The MK contrast was quantified for each subject (blue crosses) and at group level (mean: black circle, standard-error-of-the-mean: black error bars) by calculating the difference between MK in the GM and WM. (B) The relative improvement of MK contrast with respect to the original data. The combination of REMATCH and msPOAS increased the contrast between GM and WM by about 35%.
Figure 10
Figure 10
Visual assessment of the effect of noise on MK maps. The MK map that was calculated from the full dataset (SNR100) was used as pseudo ground truth and compared to MK maps, which were calculated with 50% of the original data (original SNR25) and 50% of the denoised data (msPOAS SNR25) data. Arrows highlight tissue boundaries, which were less distinctive for low-SNR data and better after processing with msPOAS.
Figure 11
Figure 11
Quantitative assessment of the effect of noise on the WM/GM MK contrast. (A) To this end, the difference between the mean MK value within WM and GM was calculated for MK maps obtained from: all (original SNR100), 66% (original SNR44), and 50% (original SNR25) of the data. The same contrast was calculated after applying msPOAS on each subset: all (msPOAS SNR100), 66% (msPOAS SNR44), and 50% (msPOAS SNR25) of the data. (B) Furthermore, the relative difference with respect to ΔMK from the original SNR100 dataset was calculated. If less data and no denoising were employed to estimate the MK, the contrast between WM and GM was reduced. If msPOAS was used the contrast stayed approximately the same.
Figure 12
Figure 12
The effect of spatial resolution on delineating neuroanatomy using MK maps. (A) High-resolution magnetization transfer (MT) map as a reference map for neuroanatomy (the central sulcus is highlighted by the white arrows) and highly myelinated microstructure (brighter regions in the WM correspond to higher myelination). (B,C): Restricted field of view (rFoV) DKI of a section of the motor cortex through the central sulcus (cs) at high (B) and low (C) spatial resolution (rFoV is highlighted in yellow, Figure 8A). The transition between highly myelinated white matter pathways and the cortical sheet (red arrows) was visible in the MK map only at high spatial resolution (B).

Similar articles

Cited by

References

    1. Andersson J., Xu J., Yacoub E., Auerbach E., Moeller S., Ugurbil K. (2012). A comprehensive Gaussian Process framework for correcting distortions and movements in diffusion images, in Proceedings of the 20th Annual Meeting International Society for Magnetic Resonance in Medicine (Melbourne: ).
    1. Andersson J. L. R., Skare S. (2002). A model-based method for retrospective correction of geometric distortions in diffusion-weighted EPI. Neuroimage 16, 177–199. 10.1006/nimg.2001.1039 - DOI - PubMed
    1. Ashburner J., Friston K. J. (2005). Unified segmentation. Neuroimage 26, 839–851. 10.1016/j.neuroimage.2005.02.018 - DOI - PubMed
    1. Assaf Y., Basser P. J. (2005). Composite hindered and restricted model of diffusion (CHARMED) MR imaging of the human brain. Neuroimage 27, 48–58. 10.1016/j.neuroimage.2005.03.042 - DOI - PubMed
    1. Assemlal H.-E., Tschumperlé D., Brun L., Siddiqi K. (2011). Recent advances in diffusion MRI modeling: angular and radial reconstruction. Med. Image Anal. 15, 369–396. 10.1016/j.media.2011.02.002 - DOI - PubMed

LinkOut - more resources