. 2015 Jan 8:5:453.
doi: 10.3389/fgene.2014.00453. eCollection 2014.

Whole-body transcriptome of selectively bred, resistant-, control-, and susceptible-line rainbow trout following experimental challenge with Flavobacterium psychrophilum

Affiliations

Whole-body transcriptome of selectively bred, resistant-, control-, and susceptible-line rainbow trout following experimental challenge with Flavobacterium psychrophilum

David Marancik et al. Front Genet. .

Abstract

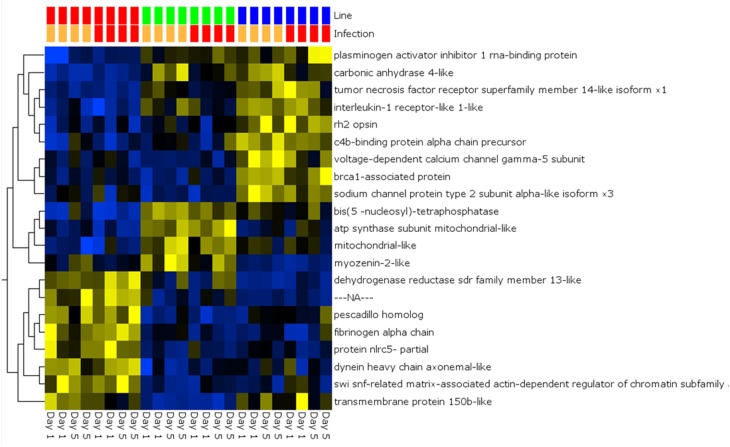
Genetic improvement for enhanced disease resistance in fish is an increasingly utilized approach to mitigate endemic infectious disease in aquaculture. In domesticated salmonid populations, large phenotypic variation in disease resistance has been identified but the genetic basis for altered responsiveness remains unclear. We previously reported three generations of selection and phenotypic validation of a bacterial cold water disease (BCWD) resistant line of rainbow trout, designated ARS-Fp-R. This line has higher survival after infection by either standardized laboratory challenge or natural challenge as compared to two reference lines, designated ARS-Fp-C (control) and ARS-Fp-S (susceptible). In this study, we utilized 1.1 g fry from the three genetic lines and performed RNA-seq to measure transcript abundance from the whole body of naive and Flavobacterium psychrophilum infected fish at day 1 (early time-point) and at day 5 post-challenge (onset of mortality). Sequences from 24 libraries were mapped onto the rainbow trout genome reference transcriptome of 46,585 predicted protein coding mRNAs that included 2633 putative immune-relevant gene transcripts. A total of 1884 genes (4.0% genome) exhibited differential transcript abundance between infected and mock-challenged fish (FDR < 0.05) that included chemokines, complement components, tnf receptor superfamily members, interleukins, nod-like receptor family members, and genes involved in metabolism and wound healing. The largest number of differentially expressed genes occurred on day 5 post-infection between naive and challenged ARS-Fp-S line fish correlating with high bacterial load. After excluding the effect of infection, we identified 21 differentially expressed genes between the three genetic lines. In summary, these data indicate global transcriptome differences between genetic lines of naive animals as well as differentially regulated transcriptional responses to infection.

Keywords: Flavobacterium psychrophilum; aquaculture; bacterial cold water disease; disease resistance; immune gene; rainbow trout genome; selective breeding; tnfrsf.


Figures

Figure 1
Figure 1
(A) Post-challenge survival of ARS-Fp-R line (resistant, blue line), ARS-Fp-C line (control, green line), and ARS-Fp-S line (susceptible, red line) fish, challenged using replicate tanks. Survival differences were significant between genetic lines (P < 0.001). Fish were injected with either F. psychrophilum in PBS (n = 100 fish per line) or with PBS alone (data not shown) and survival monitored for 21 days. Five fish were sampled from each tank (n = 10 total) on days 1 and 5 post-challenge (arrows) for RNA-seq analysis. (B) Mean F. psychrophilum load, genome equivalents per 100 ng extracted DNA (+1 SD) measured by qPCR. Individual fish were tested (n = 10 fish per group) with the exception of day 1 ARS-Fp-C line (n = 1) as samples were not available. Load differences were significantly different between genetic lines on day 5 (P < 0.001). (C) Mean F. psychrophilum cDNA count per library (+1 SD) identified from the RNA-seq dataset.
Figure 2
Figure 2
Principal component analysis of 24 RNA-seq libraries analyzed by infection status. Across the entire dataset, a total of 1884/46,585 (4.04%) genes were differentially expressed and included within the PCA analysis (false discovery rate q = 0.05, p = 0.002, no fold-change criteria). Each point represents a single RNA-seq library color coded by genetic line. Samples cluster by day and infection. Lines connecting samples represent the results from nearest neighbor analysis calculated using Qlucore Omics Explorer (v3.0). RPKM data were log2 normalized. PCA1 accounts for 57% of the variation while PCA2 accounts for 10%.
Figure 3
Figure 3
Venn diagrams depicting commonalities of regulated genes in infected ARS-Fp-R, ARS-Fp-C, and ARS-Fp-S line fish that showed significant differences in transcript abundance compared to respective PBS-challenged fish groups on days 1 and 5 post-infection. For all analyses, pair-wise comparisons were calculated with DESeq2 using a q < 0.05. Circles are color coded by line, ARS-Fp-S (red line), ARS-Fp-C (green), and ARS-Fp-R (blue).
Figure 4
Figure 4
Heat map of PCA analysis showing the most highly regulated genes in infected vs. day-matched PBS injected fish (q = 0.01 and >log2 3-fold cut-off). Genetic line (S-line red color, C-line green color, R-line blue color) and infection status (PBS injected orange color, Fp injected red color) are shown on top and day post-infection is shown on bottom. Variables (genes) are grouped by hierarchal clustering.
Figure 5
Figure 5
Heat map showing multi-group comparison by genetic line eliminating infection as a factor (q = 0.05). Variables (genes) are grouped by hierarchal clustering.
Figure 6
Figure 6
Heat map showing multi-group comparison by genetic line eliminating infection as a factor (q = 0.05) for Day 1 samples. Variables (genes) are grouped by hierarchal clustering.
Figure 7
Figure 7
Comparison between qPCR and RNA-seq by genetic line. All samples were from day 5 post-challenge.

References

    1. Anastasiou V., Mikrou A., Papanastasiou A. D., Zarkadis I. K. (2011). The molecular identification of factor H and factor I molecules in rainbow trout provides insights into complement C3 regulation. Fish Shellfish Immunol. 31, 491–499. 10.1016/j.fsi.2011.06.008 - DOI - PubMed
    1. Barnes M. E., Brown M. L. (2011). A review of Flavobacterium psychrophilum biology, clinical signs, and bacterial cold water disease prevention and treatment. Open Fish Sci. J. 4, 40–48 10.2174/1874401X01104010040 - DOI
    1. Bayne C. J., Gerwick L., Fujiki K., Nakao M., Yano T. (2001). Immune-relevant (including acute phase) genes identified in the livers of rainbow trout, Oncorhynchus mykiss, by means of suppression subtractive hybridization. Dev. Comp. Immunol. 25, 205–217. 10.1016/S0145-305X(00)00057-4 - DOI - PubMed
    1. Beck B. H., Farmer B. D., Straus D. L., Li C., Peatman E. (2012). Putative roles for a rhamnose binding lectin in Flavobacterium columnare pathogenesis in channel catfish Ictalurus punctatus. Fish Shellfish Immunol. 33, 1008–1015. 10.1016/j.fsi.2012.08.018 - DOI - PubMed
    1. Benjamini Y., Hochberg Y. (1995). Controlling the false discovery rate: a practical approach to multiple testing. J. R. Stat. Soc. B 57, 289–300.

LinkOut - more resources