Review
. 2014 Sep;4(3):395-406.
doi: 10.1086/677354.

Biomechanics of the right ventricle in health and disease (2013 Grover Conference series)

Affiliations
Review

Biomechanics of the right ventricle in health and disease (2013 Grover Conference series)

Robert Naeije et al. Pulm Circ. 2014 Sep.

Abstract

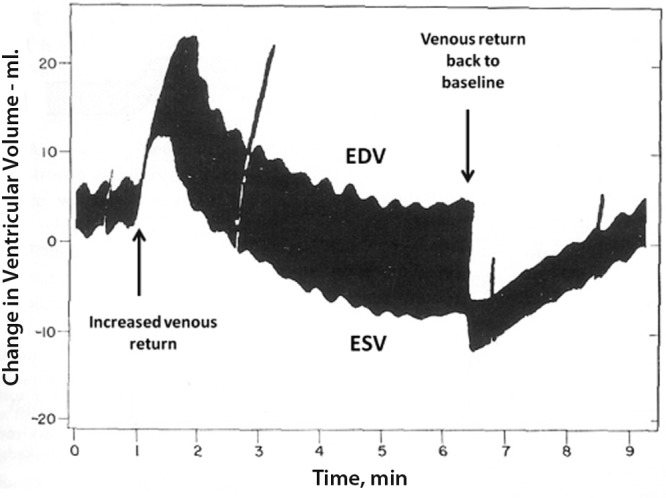
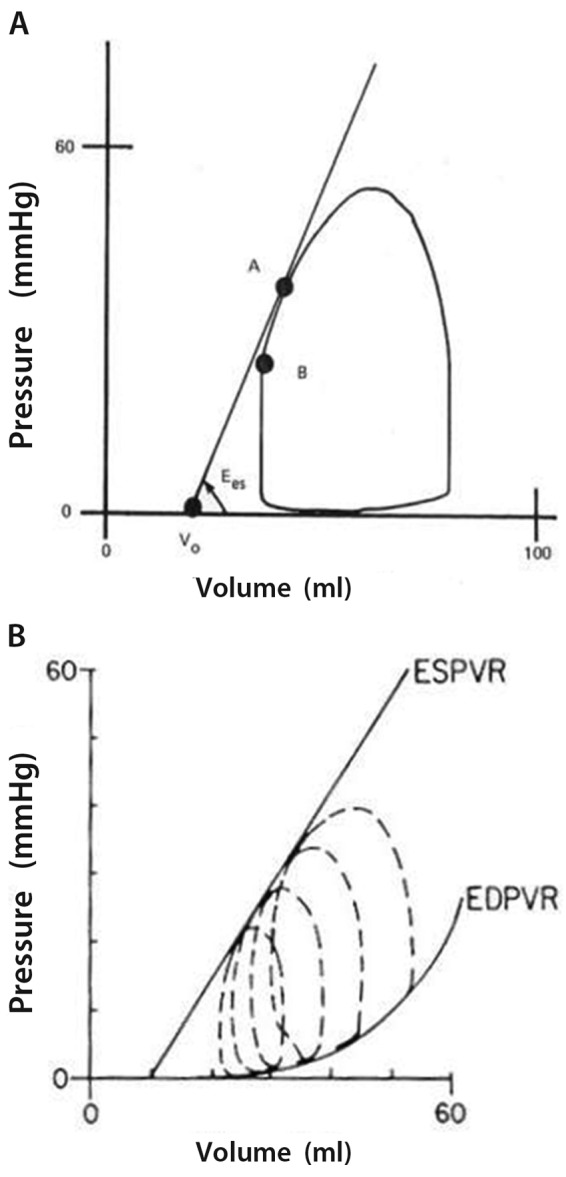
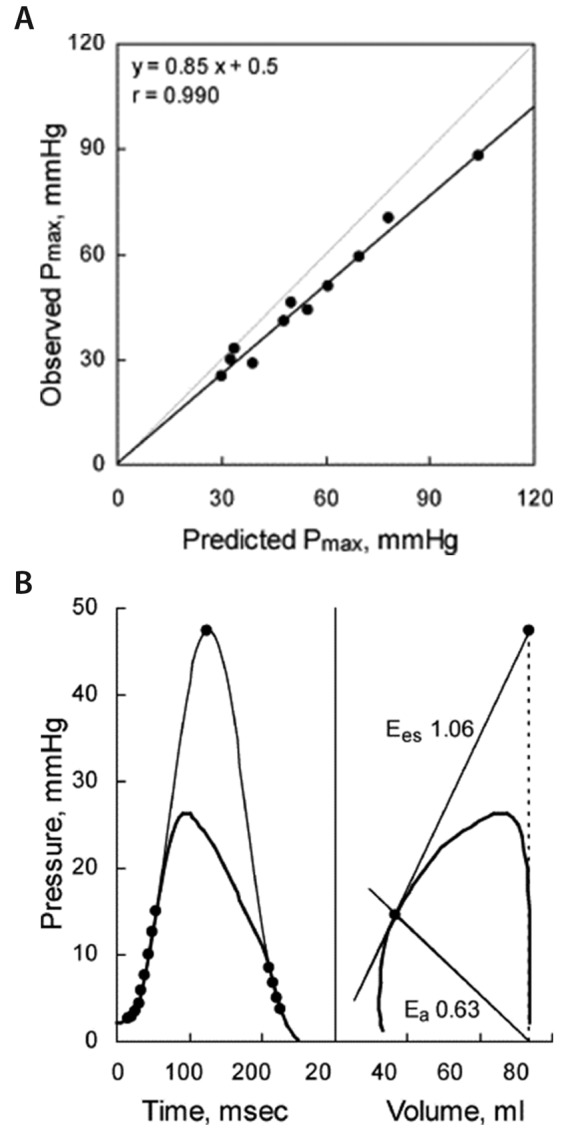
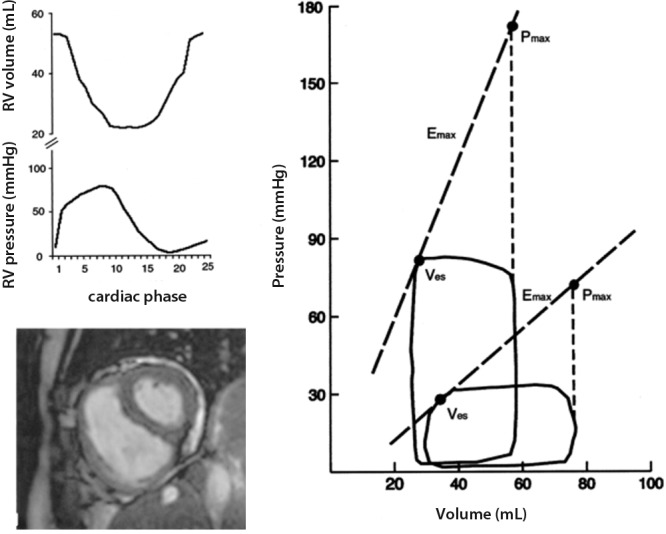
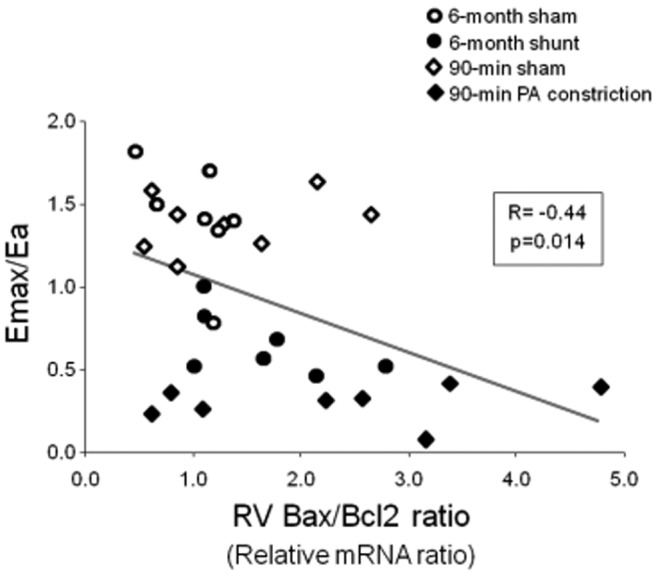
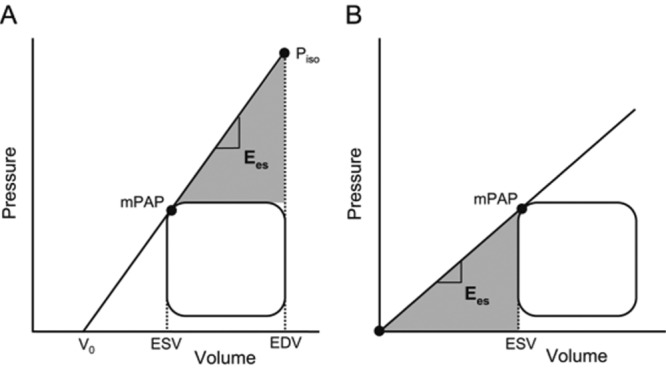
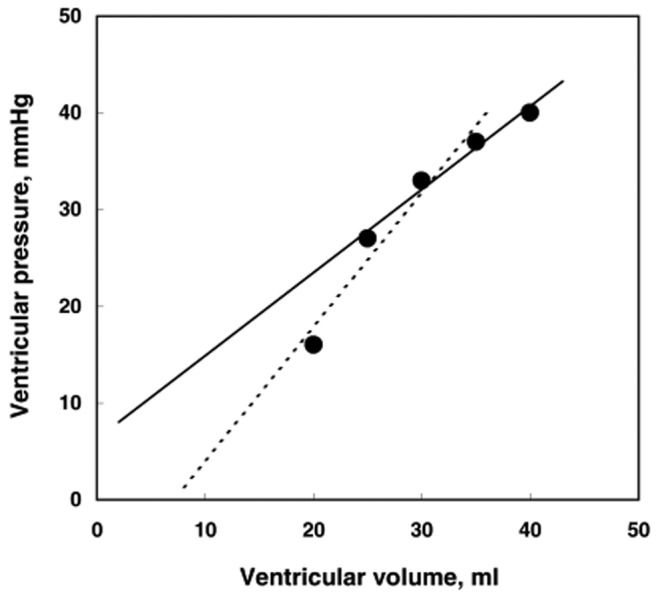
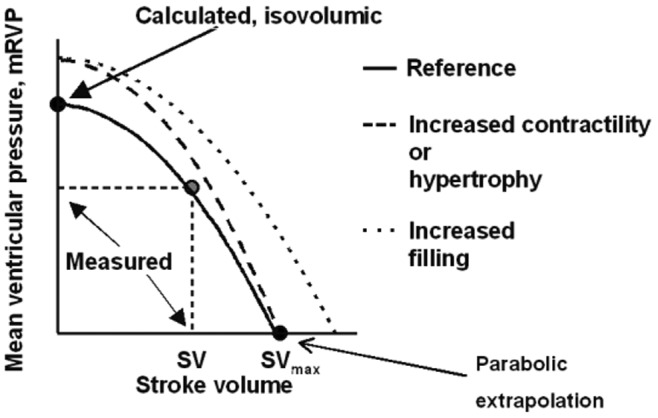
Right ventricular (RV) function is a major determinant of the symptomatology and outcome in pulmonary hypertension. The normal RV is a thin-walled flow generator able to accommodate large changes in venous return but unable to maintain flow output in the presence of a brisk increase in pulmonary artery pressure. The RV chronically exposed to pulmonary hypertension undergoes hypertrophic changes and an increase in contractility, allowing for preserved flow output in response to peripheral demand. Failure of systolic function adaptation (homeometric adaptation, described by Anrep's law of the heart) results in increased dimensions (heterometric adaptation; Starling's law of the heart), with a negative effect on diastolic ventricular interactions, limitation of exercise capacity, and vascular congestion. Ventricular function is described by pressure-volume relationships. The gold standard of systolic function is maximum elastance (E max), or the maximal value of the ratio of pressure to volume. This value is not immediately sensitive to changes in loading conditions. The gold standard of afterload is arterial elastance (E a), defined by the ratio of pressure at E max to stroke volume. The optimal coupling of ventricular function to the arterial circulation occurs at an E max/E a ratio between 1.5 and 2. Patients with severe pulmonary hypertension present with an increased E max, a trend toward decreased E max/E a, and increased RV dimensions, along with progression of the pulmonary vascular disease, systemic factors, and left ventricular function. The molecular mechanisms of RV systolic failure are currently being investigated. It is important to refer biological findings to sound measurements of function. Surrogates for E max and E a are being developed through bedside imaging techniques.

Keywords: afterload; arterial elastance; end-systolic elastance; maximum elastance; preload; pulmonary hypertension; right ventricle.


Figures

Figure 1
Figure 1
Time-course of right ventricular volume changes after a brisk increase in venous return. The initial heterometric adaptation is followed by a homeometric adaptation, allowing for a return to the initial end-diastolic volume (EDV) with decreased end-systolic volume (ESV) and increased stroke volume. Reproduced from Rosenblueth et al. with permission.
Figure 2
Figure 2
A, A normal right ventricular pressure-volume loop is of triangular shape, with maximum elastance (or Ees, point A) occurring before the end of systole (point B). B, A decrease in venous return allows for the recording of a family of right ventricular pressure-volume loops and the use of end-systolic pressure-volume relationship (ESPVR) and end-diastolic pressure-volume relationship (EDPVR) to define systolic and diastolic function. Reproduced from Maughan et al. with permission.
Figure 3
Figure 3
Single-beat method for measurement of right ventriculoarterial coupling in an anesthetized dog. A, Good agreement between directly measured maximum right ventricular (RV) pressure (Pmax) when the pulmonary arterial trunk is clamped during one heart beat (black line) and extrapolated Pmax (gray line). The slightly lower observed Pmax is explained by the proximal pulmonary arterial compliance. B, Pmax is calculated from early and late portions of the RV pressure curve, end-systolic elastance (Ees) or arterial elastance (Ea) graphically determined from Pmax, and relative changes in volume and pressure during systole. Reproduced from Brimioulle et al. with permission.
Figure 4
Figure 4
Right ventricular (RV) pressure-volume loops with calculated maximal RV pressure (Pmax), maximal elastance (Emax), and arterial elastance (Ea) in a normal subject and in a patient with pulmonary arterial hypertension (PAH). Left, source volume and pressure signals of the PAH patient (top) and a magnetic resonance image of the normal control (bottom). Right, pulmonary hypertension was associated with a marked increase in pressures and Ea, accompanied by an increase in Emax. The normal subject had an Emax/Ea ratio of 2. The Emax/Ea ratio was decreased to 1 in the PAH patient. Ves: end-systolic volume. Reproduced from Kuehne et al. with permission.
Figure 5
Figure 5
Decreased right ventricular (RV) maximum elastance/arterial elastance (Emax/Ea) ratio correlated with the Bax/Bcl2 ratio indicating activation of apoptosis as a universal mechanism in models of acute or chronic RV failure. Data from Rondelet et al. and Dewachter et al. PA: pulmonary artery; mRNA: messenger RNA.
Figure 6
Figure 6
Simplified pressure method for the determination of right ventricular (RV) maximum elastance/arterial elastance (Ees/Ea) ratio. Emax is calculated as (Pmax − mPAP)/(EDV − ESV) in A and as mPAP/ESV in B. A positive V0 is associated with a higher estimated Emax. mPAP: mean pulmonary artery pressure; Pmax: maximum RV pressure; ESV: end-systolic volume; EDV: end-diastolic volume; V0: ventricular volume at zero pressure. Reproduced from Trip et al. with permission.
Figure 7
Figure 7
Linear extrapolation from slightly curvilinear end-systolic pressure-volume relationships may lead to markedly different pressure or volume intercepts. In this series of 5 pressure-volume coordinates, omission of the highest or the lowest pressure point changes the zero-pressure volume intercept from a negative to a positive value.
Figure 8
Figure 8
Pump function curve defined by mean right ventricular pressure as a function of stroke volume (SV). The zero-SV point is calculated from a maximum-pressure determination (see Figure 3). The zero-pressure point results from a parabolic extrapolation from measured and zero-SV points. Increased preload shifts the curve in parallel to higher SV. Increased contractility increases pressure generated at any given value of SV, but in proportion to decreased SV. Reproduced from Elzinga and Westerhof with permission.
Figure 9
Figure 9
Right ventricular contractile reserve defined by exercise-induced increase in the systolic pressure. Reproduced from Grünig et al. with permission.

Similar articles

Cited by

References

    1. Reeves JT, Groves BM, Turkevich D, Morrison DA, Trapp JA. Right ventricular function in pulmonary hypertension. In: Weir EK and Reeves JT, eds. Pulmonary vascular physiology and physiopathology. New York: Dekker, 1989:325–351.
    1. Voelkel NF, Quaife RA, Leinwand LA, Barst RJ, McGoon MD, Meldrum DR, Dupuis J, et al. Right ventricular function and failure: report of a National Heart, Lung, and Blood Institute working group on cellular and molecular mechanisms of right heart failure. Circulation 2006;114(17):1883–1891. - PubMed
    1. Voelkel NF, Gomez-Arroyo J, Abbate A, Bogaard HJ. Mechanisms of right heart failure—a work in progress and plea for further prevention. Pulm Circ 2013;3(1):137–143. - PMC - PubMed
    1. West JB. Role of the fragility of the pulmonary blood-gas barrier in the evolution of the pulmonary circulation. Am J Physiol Regul Integr Comp Physiol 2013;304(3):R171–R176. - PubMed
    1. Starr I, Jeffers WA, Meade RH. The absence of conspicuous increments of venous pressure after severe damage to the right ventricle of the dog, with a discussion of the relation between clinical congestive heart failure and heart disease. Am Heart J 1943;26(3):291–301.

LinkOut - more resources