MDM4 expression as an indicator of TP53 reactivation by combined targeting of MDM2 and MDM4 in cancer cells without TP53 mutation
- PMID: 25621298
- PMCID: PMC4303891
- DOI: 10.18632/oncoscience.103
MDM4 expression as an indicator of TP53 reactivation by combined targeting of MDM2 and MDM4 in cancer cells without TP53 mutation
Abstract
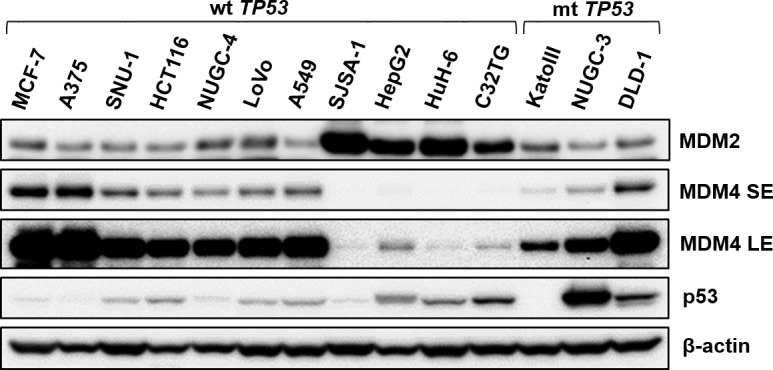
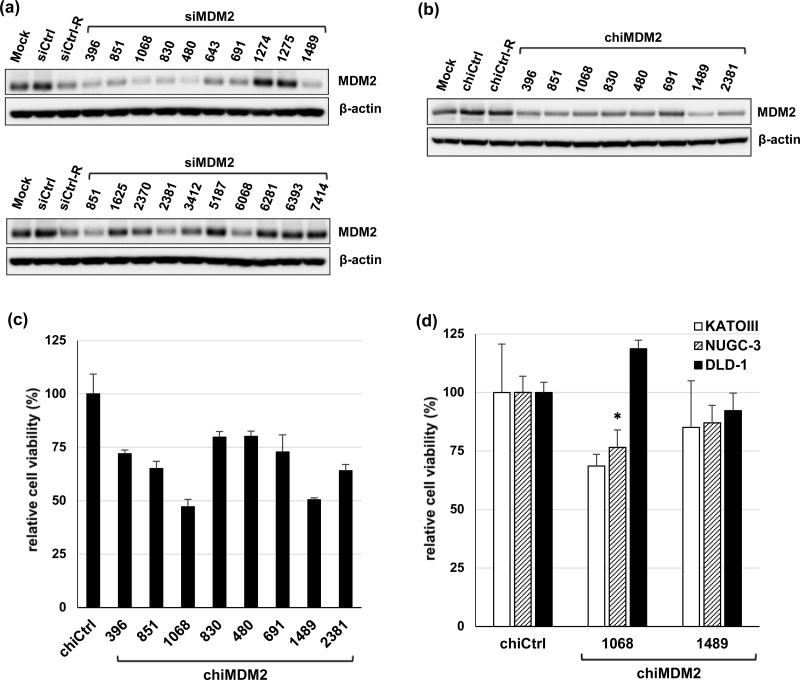
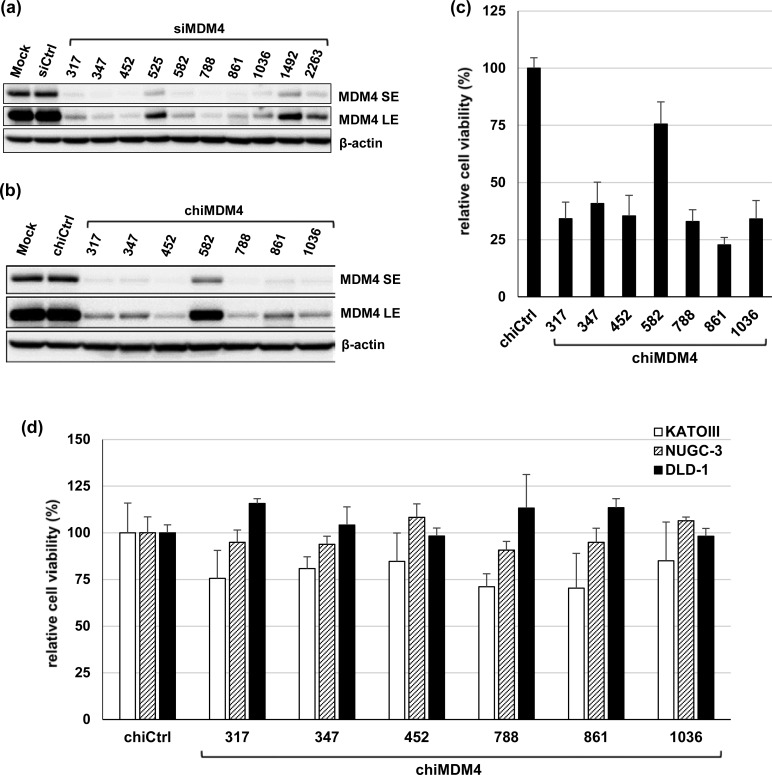
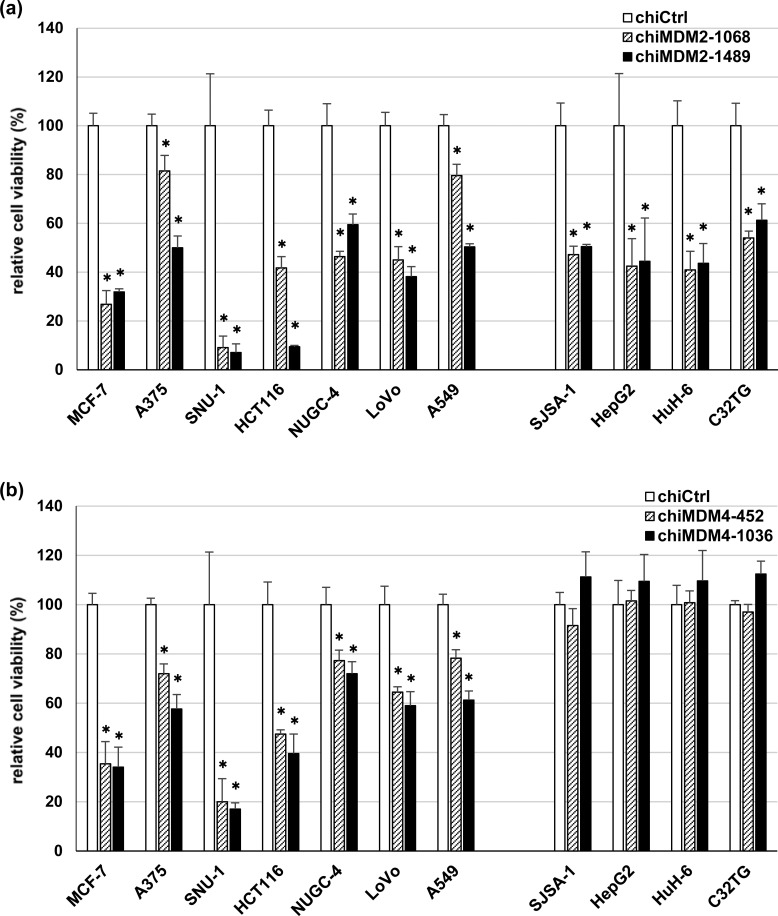
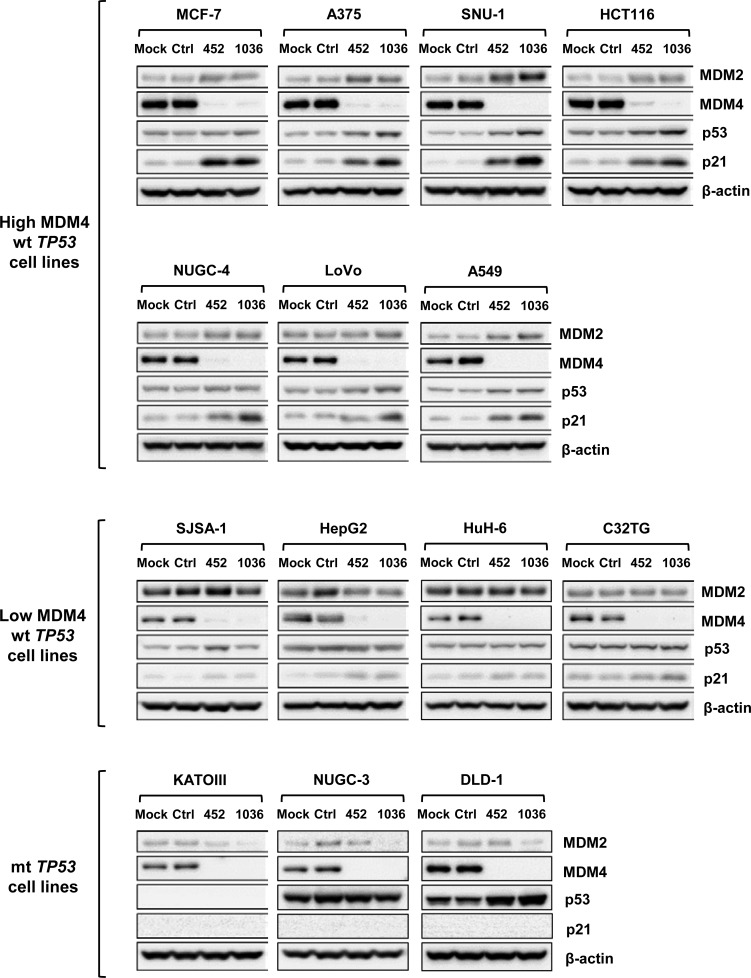
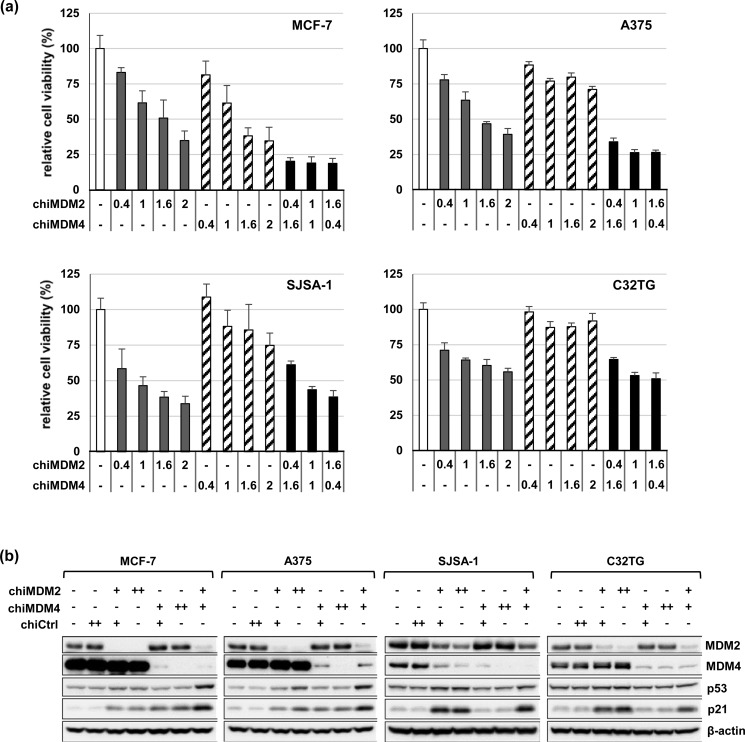
MDM2 and MDM4, a structurally related MDM2 homolog, negatively regulates expression and functions of TP53 tumor suppressor gene. To explore the precise expression patterns and function of MDM2 and MDM4 in wild-type (wt) TP53 cancer cells, we analyzed 11 various cancer cell lines with wt TP53. All cell lines exhibited deregulated expression of MDM2 and MDM4, and were divided into two distinct types; the one expressing high levels of MDM4 and another expressing low levels of MDM4. The low MDM4 type expressed higher MDM2 levels than the high MDM4 type. In cells with high MDM4 expression, knockdown of MDM4 or MDM2 reactivated TP53, and simultaneous knockdown of MDM2 and MDM4 synergistically reactivated TP53. In contrast, in cells with low MDM4 expression, knockdown of only MDM2 reactivated TP53. These results suggest that both MDM2 and MDM4 are closely involved in TP53 inactivation in cancer cells with high MDM4 expression, whereas only MDM2, and not MDM4, is a regulator of TP53 in cells with low MDM4 expression. MDM4 expression in wt TP53-tumors is a potential indicator for TP53 reactivation cancer therapy by simultaneous targeting of MDM4 and MDM2. Specific knockdown of MDM2 and MDM4 might be applicable for TP53 restoration therapy.
Keywords: MDM2; MDM4; TP53-reactivation; knockdown; p53; siRNA.
Figures

Similar articles
-
Augmented antitumor activity of 5-fluorouracil by double knockdown of MDM4 and MDM2 in colon and gastric cancer cells.Cancer Sci. 2019 Feb;110(2):639-649. doi: 10.1111/cas.13893. Epub 2019 Jan 16. Cancer Sci. 2019. PMID: 30488540 Free PMC article.
-
Enhanced G1 arrest and apoptosis via MDM4/MDM2 double knockdown and MEK inhibition in wild-type TP53 colon and gastric cancer cells with aberrant KRAS signaling.Oncol Lett. 2021 Jul;22(1):558. doi: 10.3892/ol.2021.12819. Epub 2021 May 25. Oncol Lett. 2021. PMID: 34084225 Free PMC article.
-
Rare MDM4 gene amplification in colorectal cancer: The principle of a mutually exclusive relationship between MDM alteration and TP53 inactivation is not applicable.Oncol Rep. 2011 Jul;26(1):49-54. doi: 10.3892/or.2011.1270. Epub 2011 Apr 18. Oncol Rep. 2011. PMID: 21503588
-
Peptides and peptidomimetics in the p53/MDM2/MDM4 circuitry - a patent review.Expert Opin Ther Pat. 2016 Dec;26(12):1417-1429. doi: 10.1080/13543776.2017.1233179. Epub 2016 Sep 20. Expert Opin Ther Pat. 2016. PMID: 27603098 Review.
-
The MDM2 gene family.Biomol Concepts. 2014 Mar;5(1):9-19. doi: 10.1515/bmc-2013-0027. Biomol Concepts. 2014. PMID: 25372739 Free PMC article. Review.
Cited by
-
MiR-370 promotes apoptosis in colon cancer by directly targeting MDM4.Oncol Lett. 2018 Feb;15(2):1673-1679. doi: 10.3892/ol.2017.7524. Epub 2017 Dec 5. Oncol Lett. 2018. PMID: 29434862 Free PMC article.
-
p53 Is Active in Human Amniotic Fluid Stem Cells.Stem Cells Dev. 2018 Nov 1;27(21):1507-1517. doi: 10.1089/scd.2017.0254. Epub 2018 Oct 2. Stem Cells Dev. 2018. PMID: 30044176 Free PMC article.
-
MDMX Recruits UbcH5c to Facilitate MDM2 E3 Ligase Activity and Subsequent p53 Degradation In Vivo.Cancer Res. 2021 Feb 15;81(4):898-909. doi: 10.1158/0008-5472.CAN-20-0790. Epub 2020 Dec 4. Cancer Res. 2021. PMID: 33277368 Free PMC article.
-
Augmented antitumor activity of 5-fluorouracil by double knockdown of MDM4 and MDM2 in colon and gastric cancer cells.Cancer Sci. 2019 Feb;110(2):639-649. doi: 10.1111/cas.13893. Epub 2019 Jan 16. Cancer Sci. 2019. PMID: 30488540 Free PMC article.
-
Identification of selective protein-protein interaction inhibitors using efficient in silico peptide-directed ligand design.Chem Sci. 2019 Mar 22;10(16):4502-4508. doi: 10.1039/c9sc00059c. eCollection 2019 Apr 28. Chem Sci. 2019. PMID: 31057779 Free PMC article.
References
LinkOut - more resources
Full Text Sources
Other Literature Sources
Research Materials
Miscellaneous