. 2015 Jan 22;282(1799):20141857.
doi: 10.1098/rspb.2014.1857.

Spatially heterogeneous impact of climate change on small mammals of montane California

Spatially heterogeneous impact of climate change on small mammals of montane California

Kevin C Rowe et al. Proc Biol Sci. .

Abstract

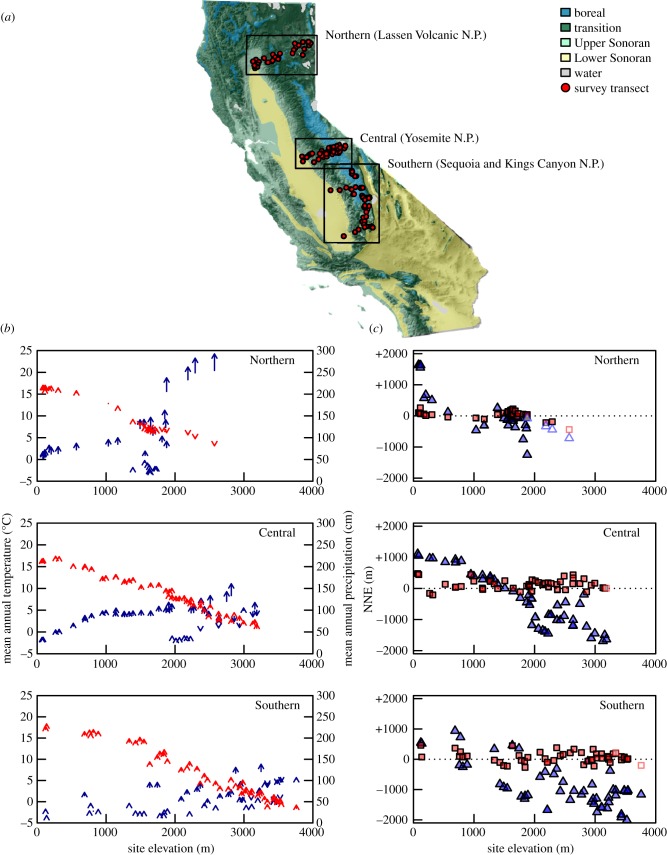
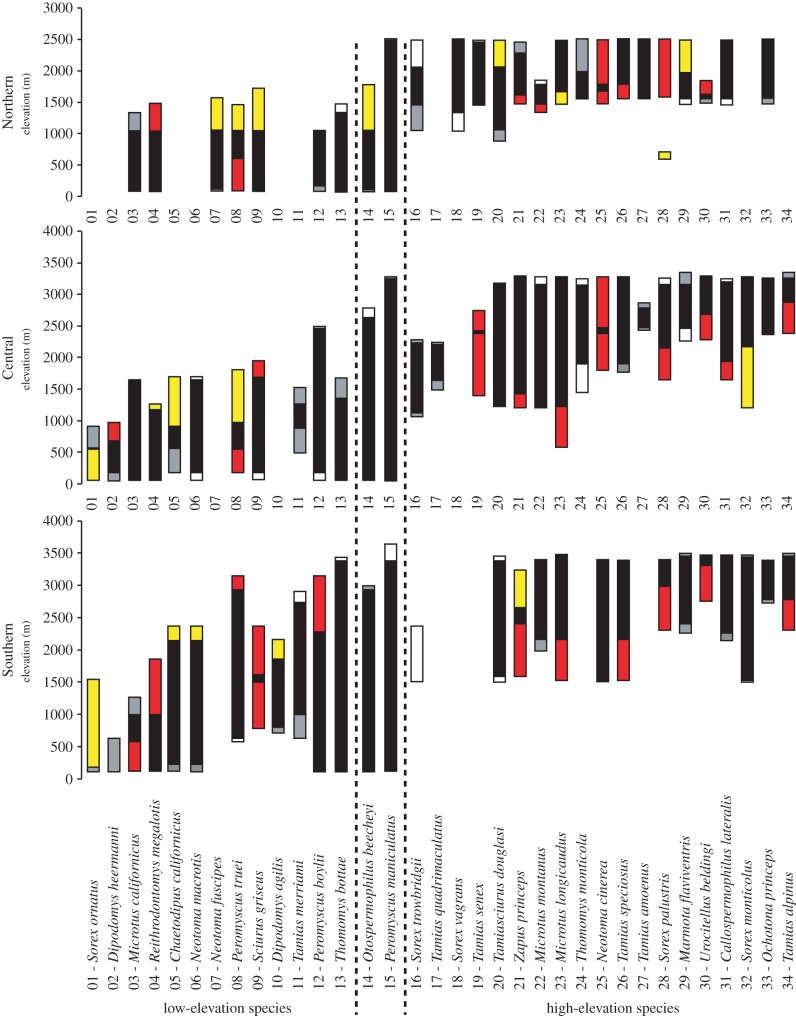
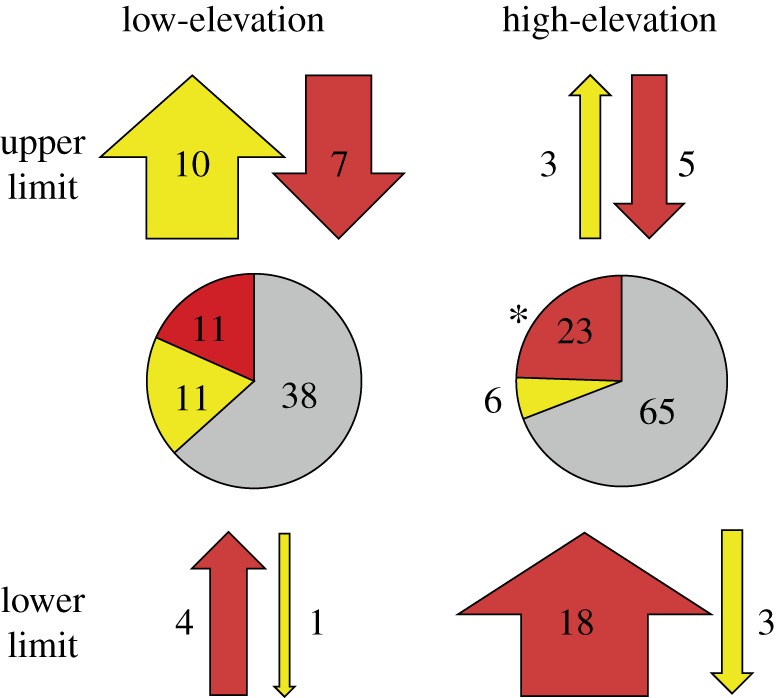
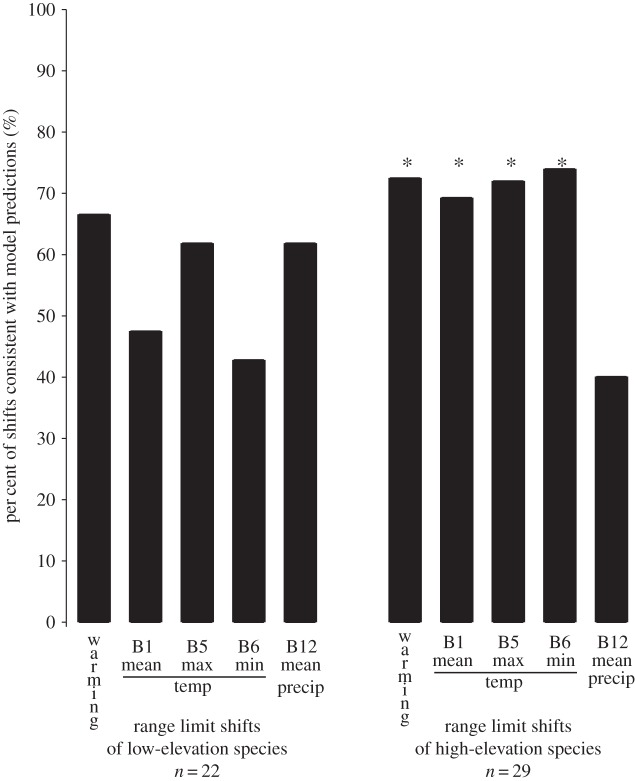
Resurveys of historical collecting localities have revealed range shifts, primarily leading edge expansions, which have been attributed to global warming. However, there have been few spatially replicated community-scale resurveys testing whether species' responses are spatially consistent. Here we repeated early twentieth century surveys of small mammals along elevational gradients in northern, central and southern regions of montane California. Of the 34 species we analysed, 25 shifted their ranges upslope or downslope in at least one region. However, two-thirds of ranges in the three regions remained stable at one or both elevational limits and none of the 22 species found in all three regions shifted both their upper and lower limits in the same direction in all regions. When shifts occurred, high-elevation species typically contracted their lower limits upslope, whereas low-elevation species had heterogeneous responses. For high-elevation species, site-specific change in temperature better predicted the direction of shifts than change in precipitation, whereas the direction of shifts by low-elevation species was unpredictable by temperature or precipitation. While our results support previous findings of primarily upslope shifts in montane species, they also highlight the degree to which the responses of individual species vary across geographically replicated landscapes.


Figures

Figure 1.
Figure 1.
Climate change and expected elevation shifts across sampling sites. (a) Map of historical survey localities in relation to survey region and life zone (N.P., National Park); (b) change in mean annual temperature (red) and mean annual precipitation (blue) between the historical (base of arrow) and modern (tip of arrow) eras across elevation; (c) average expectation of elevation shift in the modern era to achieve the most similar value of mean annual temperature (red squares) or mean annual precipitation (blue triangles) as historical localities across elevation, based on our climatic nearest neighbour analysis (see §2); open squares and triangles indicate historical sites where similar climate is underrepresented regionally within the historical era (i.e. rare) or in the modern era (i.e. disappearing). NNE, nearest neighbour elevation (m).
Figure 2.
Figure 2.
Elevation range limit shifts by region of the 34 modelled species, arranged by increasing average elevation range. Species were classified as low-elevation, high-elevation or widespread based on their range limits in relation to life zone, following [13]: low-elevation (historical elevation ranges within Lower Sonoran—transition life zones; 01–13), high-elevation (Transition—alpine; 16–34) and widespread species (14 and 15). For each species, statistically significant elevation range contractions (red) and expansions (yellow) between the historical and modern eras are shown, along with non-significant contractions (grey) and expansions (white). Lack of a bar indicates that species is not found in that region.
Figure 3.
Figure 3.
Number and proportion of upper and lower range shifts of high- and low-elevation species across all regions. Pie charts display the proportions of range limits that exhibited significant expansions (yellow), contractions (red), or no significant change (grey). Numbers represent the number of individual shifts observed in each category. An asterisk next to a pie indicates that significantly more contractions were observed than expansions. For each elevation and limit category, the arrows above and below each pie indicate the direction (up or down) and the number of shifts observed in each direction at each range limit, with the width of the arrow indicating the relative proportion observed within each category. The colours of arrows indicate whether the shift resulted in an expansion (yellow) or contraction (red).
Figure 4.
Figure 4.
Significant range limit shifts of high- and low-elevation species in relation to climate predictions. Bars represent the per cent of observed limit shifts that are consistent with the predictions from an overall warming model (i.e. all upwards) and with nearest neighbour analyses for each of the four BIOCLIM variables. Sample sizes indicate the number of range limit shifts within high- and low-elevation species that were significant from the Pfa analysis. Symbols above bars denote predictions that were significantly better than random (*p < 0.05).

Similar articles

Cited by

References

    1. Walther G, Post E, Convey P, Menzel A, Parmesan C, Beebee TJC, Fromentin J, Hoegh-Guldberg O, Bairlein F. 2002. Ecological responses to recent climate change. Nature 416, 389–395. (10.1038/416389a) - DOI - PubMed
    1. Parmesan C, Yohe G. 2003. A globally coherent fingerprint of climate change impacts across natural systems. Nature 421, 37–42. (10.1038/nature01286) - DOI - PubMed
    1. Root T, Price JT, Hall KR, Schneider SH, Pounds JA. 2003. Fingerprints of global warming on wild animals and plants. Nature 421, 57–60. (10.1038/nature01333) - DOI - PubMed
    1. Parmesan C. 2006. Ecological and evolutionary responses to recent climate change. Annu. Rev. Ecol. Evol. Syst. 37, 637–669. (10.1146/annurev.ecolsys.37.091305.110100) - DOI
    1. Chen I, Hill JK, Ohlemüller R, Roy DB, Thomas CD. 2011. Rapid range shifts of species associated with high levels of climate warming. Science 333, 1024–1026. (10.1126/science.1206432) - DOI - PubMed

Publication types