. 2015 Mar;16(3):306-17.
doi: 10.1038/ni.3094. Epub 2015 Jan 26.

Transcriptional programs define molecular characteristics of innate lymphoid cell classes and subsets

Collaborators, Affiliations

Transcriptional programs define molecular characteristics of innate lymphoid cell classes and subsets

Michelle L Robinette et al. Nat Immunol. 2015 Mar.

Abstract

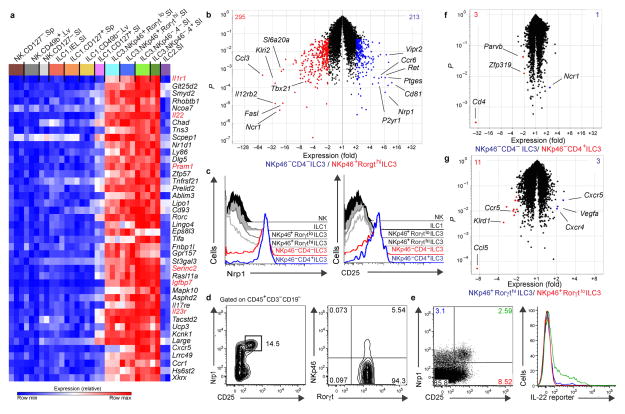
The recognized diversity of innate lymphoid cells (ILCs) is rapidly expanding. Three ILC classes have emerged, ILC1, ILC2 and ILC3, with ILC1 and ILC3 including several subsets. The classification of some subsets is unclear, and it remains controversial whether natural killer (NK) cells and ILC1 cells are distinct cell types. To address these issues, we analyzed gene expression in ILCs and NK cells from mouse small intestine, spleen and liver, as part of the Immunological Genome Project. The results showed unique gene-expression patterns for some ILCs and overlapping patterns for ILC1 cells and NK cells, whereas other ILC subsets remained indistinguishable. We identified a transcriptional program shared by small intestine ILCs and a core ILC signature. We revealed and discuss transcripts that suggest previously unknown functions and developmental paths for ILCs.


Figures

Figure 1
Figure 1. Analysis of ILC frequency and diversity
(a) Sorting strategy for array analysis after gating on live CD45+ and CD3CD19 cells. (b) Cytospins of cells using the indicated sorting strategy for each population. Each individual panel is 14.6μm in length. (c) Flow cytometry analysis of ILC percentage in each tissue among the lymphocyte population. To differentiate CD3+ T cells, CD19+ B cells, and ILCs within the same sample, the same gating strategy in (a) was used except: the siLP ILC2 marker KLRG1 and spleen ILC1 marker CD27 were excluded and liver ILCs were distinguished using NKp46, CD49b, and CD49a. Data from two independent experiments and n = 2–4 mice per tissue are shown. (d) PCA of gene expression by ILC and NK cells subsets. Numbers in parentheses indicate relative scaling of the principal variables. ImmGen sample nomenclature is used: spleen NK = NK.CD127.Sp, liver NK = NK.CD49b+.Lv, siLP NK = NK.CD127.SI, siIEL ILC1 = ILC1.IEL.SI, spleen ILC1 = ILC1.CD127+.Sp, liver ILC1 = ILC1.CD49b.Lv, siLP ILC1 = ILC1.CD127+.SI, siLP NKp46+ Rorγtlo ILC3 = ILC3.NKp46+.Rorγtlo.SI, siLP NKp46+ Rorγthi ILC3 = ILC3.NKp46+.Rorγthi.SI, siLP NKp46 CD4 LTi-like ILC3 = ILC3.NKp46.4.SI, siLP NKp46 CD4+ LTi-like ILC3 = ILC3.NKp46.4+.SI, and siLP ILC2 = ILC2.SI. (e) Hierarchical clustering of ILC and NK cells subsets based on the 10% of genes with the greatest variability. Data are combined from three to seven experiments per sample, with cells pooled from three to fifteen mice each.
Figure 2
Figure 2. Unique transcripts of individual ILC subsets
(a–i; and full gene lists in Supplemental Table 1) mRNA transcripts upregulated more than 4-fold (red font) or 2-fold (black font) in individual subsets (a,d,e,f,g), two similar subsets (b,c,h), or all subsets from siLP (i) were generated based on pairwise comparisons between the index subset(s) labeled in bold above the heat map compared to all other subsets. Between similar ILC3 subsets consisting of NKp46 CD4+ LTi-like and CD4 LTi-like (b) or NKp46+ Rorγthi and Rorγtlo(c) cells, some transcripts were expressed more than 4-fold (b) or 2-fold (c) higher in one subset, but not the other, in which case shared transcripts expressed by both subsets are indicated in blue. CD4+ LTi-like ILC3 expressed 4 transcripts 2-fold more than CD4 LTi-like ILC3 and 4-fold more than all other subsets, shown in gray (b).
Figure 3
Figure 3. Spectrum of unique and shared transcriptional profiles between siILC subsets
(a) Heat map of selected transcription factors, normalized by expression within the entire heat map. (b–c) Heat map of selected chemokine receptors and ligands (b) and cytokine receptors and ligands (c), normalized by expression within each row. (d; and full gene lists in Supplemental Table 2) Among selected siLP ILCs, transcripts upregulated by a single subset or 2 subsets are indicated, as described in the color-coded key above the plot. Numbers within the plot indicate transcripts upregulated at least by a 2-fold change in the indicated color-coded subset(s). (e) Volcano plot of Rorγthi NKp46+ ILC3 (n = 3 replicates) compared to ILC1 (n = 2 replicates), with transcripts significantly upregulated at least 2-fold quantified in corners. P ≤ 0.05 (t-test).
Figure 4
Figure 4. ILC3-specific transcriptional programs and cell surface markers
(a) Heat map of mRNA transcripts upregulated more than 4-fold (red font) or 2-fold (black font) in Rorγt+ ILC3 subsets compared to all other subsets. (b; and full gene lists in Supplemental Table 3) Volcano plots comparing NKp46+ Rorγthi ILC3 to CD4 LTi-like ILC3 with transcripts significantly upregulated at least 2-fold quantified in corners and color-coded according to key below plot. P ≤ .05 (t-test) (n = 3 replicates each) (c) Expression of Nrp1 and CD25 compared to other siLP ILC subsets from the RorγteGFP reporter mice. (d) Unbiased selection of Nrp1+ CD25+ cells gating only on CD45+ and CD3CD19 cells, with percent enrichment of LTi-like in by intracellular Rorγt staining from C56BL/6 wt mice. (e) Enrichment of IL-22 production from naive IL-22 reporter mice in Nrp1+CD25+ cells compared to other quadrants, gating on CD45+, CD3CD19, and NKp46 cells. (f–g; Supplemental Table 3) Volcano plots comparing CD4+ LTi-like (n = 2 replicates) to CD4 LTi-like ILC3 (n = 3 replicates) (f) and NKp46+ Rorγthi ILC3 to NKp46+ Rorγtlo ILC3 (n = 3 each) (g and Supplemental Table 3). P ≤ .05 (t-test). Data are representative of 3 experiments.
Figure 5
Figure 5. Transcripts differentially expressed between NK cells and ILC1
(a) Gating strategy of liver, spleen, and siLP ILC1 and NK cells after the first round of sorting from pooled samples. (b–c; and full gene lists in Supplemental Table 4) Volcano plots comparing liver ILC1 to liver NK cells (n = 3 replicates each), spleen ILC1 to spleen NK cells, siLP ILC1 to siLP NK cells (b), and liver ILC1 to spleen ILC1 (c), with transcripts significantly upregulated at least 2-fold quantified in corners and color-coded according to the key below plot. P ≤ .05 (t-test). (d) Expression of CD127 and Eomes in ILC1 and NK cells compared to isotype-matched control Ig staining from liver, spleen, and siLP, color-coded according to the key on the left. Histograms are representative of 2 experiments.
Figure 6
Figure 6. Generation of a core ILC signature distinct from NK cells
(a) Visualization of transcripts differentially expressed by ILC1 compared NK cells from different tissues. Transcripts upregulated by 2 or 3 subsets are indicated, as described in the color-coded key above the plot. Numbers within the plot indicate transcripts significantly expressed with at least a 2-fold change between liver and spleen ILC1 and NK cells (n = 3 replicates each) or with an additional filter for at least a 2-fold change between siLP ILC1 and NK cells (n = 2 replicates each). P ≤ .05 (t-test). (b; and full gene lists in Supplemental Table 5–6) Heat map showing gene signatures generated and color-coded in (a); transcripts upregulated ≥ 4-fold in all 3 comparisons between ILC1 and NK cells are shown in red. (c–h): ILCs were discriminated as in Fig. 1c, except spleen was positively selected using anti-CD49b-coated beads and Rorγt was stained intracellularly in siLP samples (c; and Supplemental Figure 2). Representative plots from ILCs and positive control IEL γδ T cells stained extracellularly or intracellularly for TCRδ by flow cytometry; for intracellular stain, PE-conjugated anti-TCRδ mAb was used to stain positive control IEL extracellularly before intracellular staining with FITC-conjugated anti-TCRδ (n = 2 independent experiments). Color-coded gates demonstrate percentage of indicated subsets positive for anti-TCRδ, except for control IEL γδ cells, which are shown as a percentage of CD45+ cells. (d) RNAseq data from a previous dataset (GEO accession GSE52043), selecting the 3′ end of the TcRγ locus between 19426 kb and 19446 kb on Chromosome 13. (e) Quantification of percentage of CXCR6+ cells within each ILC subset from CXCR6eGFP/+ reporter mice. (1-way ANOVA with multiple comparisons; error bars mean +/− SEM; * P ≤ .05). (f) Quantification of ILC frequency in CXCR6eGFP/+ and CXCR6eGFP/eGFP mice (2-way ANOVA with multiple comparisons; error bars mean +/− SEM; all comparisons are not significant). (e–f) Data are from 3–4 mice from each genotype per tissue. (g) Visualization of transcripts upregulated between siLP ILC1, siLP NK, and siIEL ILC1 by 1 or 2 subsets are indicated, as described in the color-coded key above the plot. (n = 2–3 replicates each).

Comment in

Similar articles

Cited by

References

    1. Heng TS, Painter MW. The Immunological Genome Project: networks of gene expression in immune cells. Nat Immunol. 2008;9:1091–1094. - PubMed
    1. Diefenbach A, Colonna M, Koyasu S. Development, Differentiation, and Diversity of Innate Lymphoid Cells. Immunity. 2014;41:354–365. - PMC - PubMed
    1. McKenzie AN, Spits H, Eberl G. Innate lymphoid cells in inflammation and immunity. Immunity. 2014;41:366–374. - PubMed
    1. Klose CS, Flach M, Möhle L, Rogell L, Hoyler T, Ebert K, Fabiunke C, Pfeifer D, Sexl V, Fonseca-Pereira D, et al. Differentiation of type 1 ILCs from a common progenitor to all helper-like innate lymphoid cell lineages. Cell. 2014;157:340–356. - PubMed
    1. Sawa S, Cherrier M, Lochner M, Satoh-Takayama N, Fehling HJ, Langa F, Di Santo JP, Eberl G. Lineage relationship analysis of RORgammat+ innate lymphoid cells. Science. 2010;29:665–669. - PubMed

Publication types

Associated data