. 2015 Mar;16(3):318-325.
doi: 10.1038/ni.3093. Epub 2015 Jan 26.

The long intergenic noncoding RNA landscape of human lymphocytes highlights the regulation of T cell differentiation by linc-MAF-4

Affiliations

The long intergenic noncoding RNA landscape of human lymphocytes highlights the regulation of T cell differentiation by linc-MAF-4

Valeria Ranzani et al. Nat Immunol. 2015 Mar.

Abstract

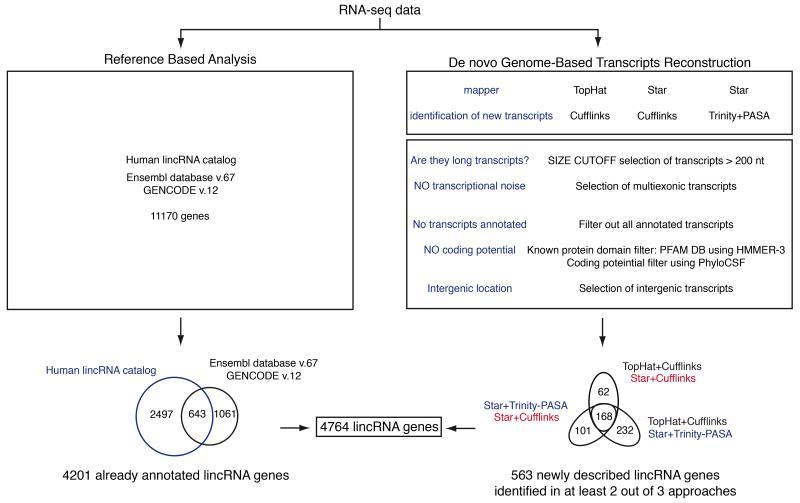
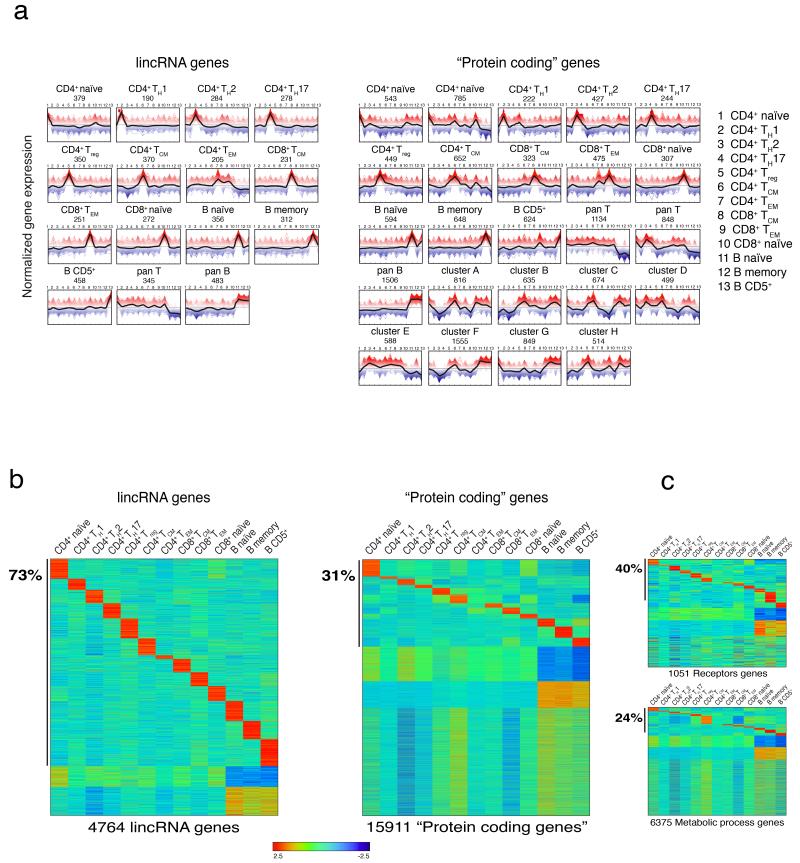
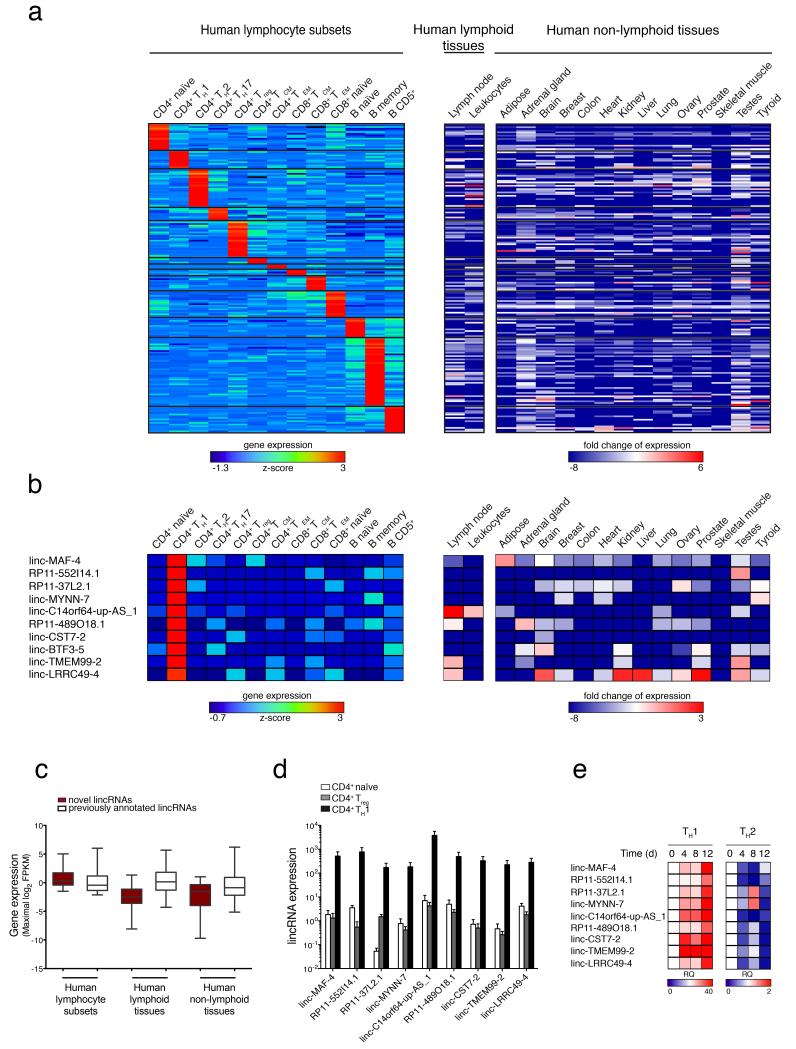
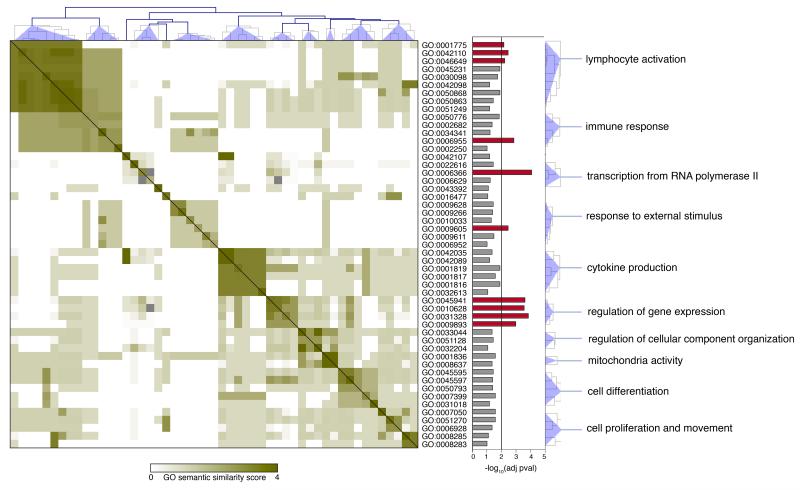
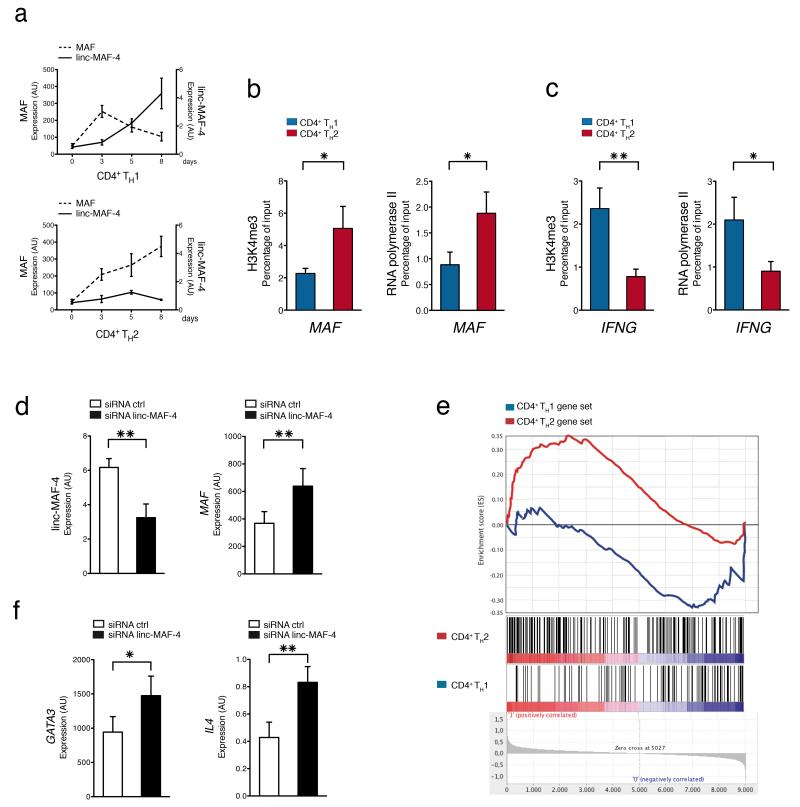
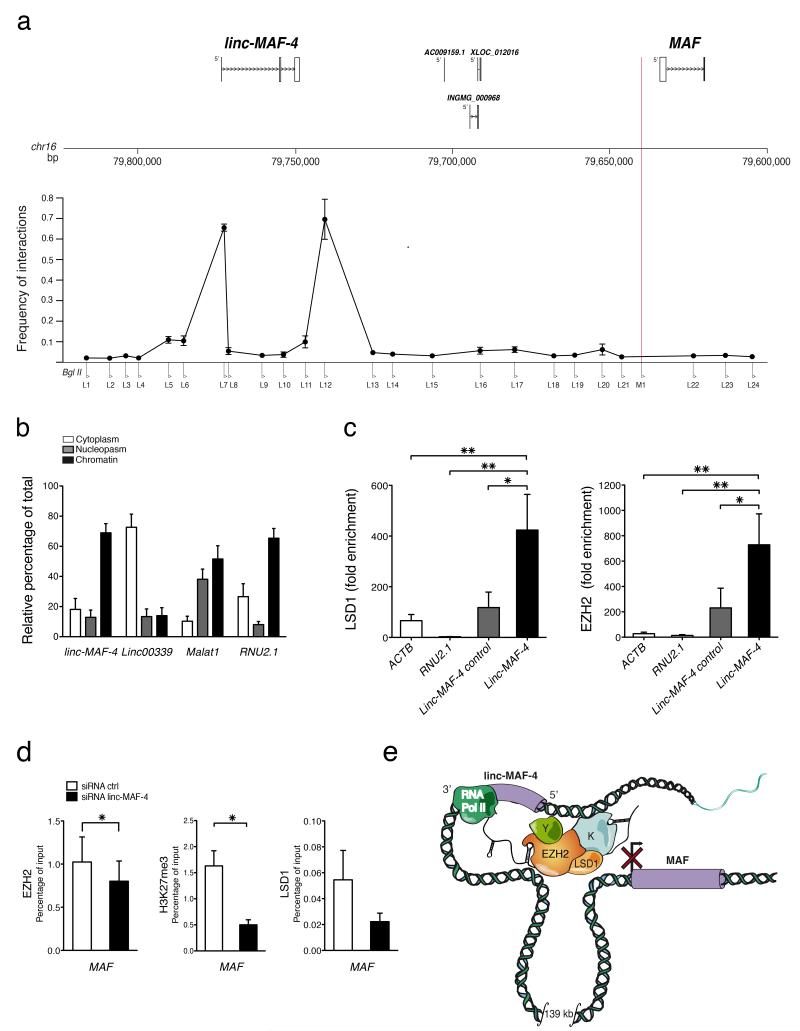
Long noncoding RNAs are emerging as important regulators of cellular functions, but little is known of their role in the human immune system. Here we investigated long intergenic noncoding RNAs (lincRNAs) in 13 subsets of T lymphocytes and B lymphocytes by next-generation sequencing-based RNA sequencing (RNA-seq analysis) and de novo transcriptome reconstruction. We identified over 500 previously unknown lincRNAs and described lincRNA signatures. Expression of linc-MAF-4, a chromatin-associated lincRNA specific to the TH1 subset of helper T cells, was inversely correlated with expression of MAF, a TH2-associated transcription factor. Downregulation of linc-MAF-4 skewed T cell differentiation toward the TH2 phenotype. We identified a long-distance interaction between the genomic regions of the gene encoding linc-MAF-4 and MAF, where linc-MAF-4 associated with the chromatin modifiers LSD1 and EZH2; this suggested that linc-MAF-4 regulated MAF transcription through the recruitment of chromatin modifiers. Our results demonstrate a key role for lincRNA in T lymphocyte differentiation.


Figures

Figure 1
Figure 1. Identification of lincRNAs expressed in human lymphocyte subsets
RNA-seq data generated from 63 lymphocyte samples were processed according to two different strategies: quantification of lincRNAs already annotated in public resources and de novo Genome Based Transcripts Reconstruction for the quantification of new lincRNAs expressed in human lymphocytes. Three methods for the identification of new transcripts were adopted: Reference Annotation Based assembly by Cufflinks with two different aligners (TopHat and STAR) and an approach that integrates Trinity and PASA software. Only transcripts reconstructed by at least two assemblers were considered. Novel transcripts were filtered with a computational analysis pipeline to select for lincRNAs. The number of lincRNA genes and transcripts identified in lymphocytes subsets is indicated.
Figure 2
Figure 2. Definition of transcript clusters in human lymphocytes
(a) Expression profiles of lincRNA and protein coding genes across 13 human lymphocyte subsets according to K-Means clusters definition. The black line represents the mean expression of the genes belonging to the same cluster. The peaks of expression profiles refer to the populations reported in legend according to numbering. (b) Specificity of lincRNAs and protein coding genes. Rows and columns are ordered based on a K-Means clustering of lincRNAs and protein coding genes across 13 human lymphocyte populations. Color intensity represents the Z-score log2-normalized raw FPKM counts estimated by Cufflinks. 79% of lincRNAs genes and 39% of protein coding genes are assigned to specific clusters. See also Supplementary Fig. 2a. (c) As in (b), performed on receptors and metabolic processes genes.
Figure 3
Figure 3. LincRNA signatures of human lymphocyte subsets
(a) Heatmap of normalized expression values of lymphocytes signature lincRNAs selected on the basis of fold change (>2.5 with respect to all the other subsets), intrapopulation consistency (expressed in at least 3 out of 5 samples) and non parametric Kruskal-Wallis test (P < 0.05). Signature lincRNAs relative expression values were calculated as log2 ratios between lymphocyte subsets and a panel of human lymphoid and non-lymphoid tissues of the Human BodyMap 2.0 project (See also Supplementary Table 3). (b) CD4+ TH1 signature lincRNAs extracted from panel (a). The barcode on the left indicates already annotated lincRNAs (white) and novel lincRNAs (brick red). For novel lincRNAs name, ‘S’ and ‘AS’ indicates ‘sense’ and ‘antisense’ respectively. (c) Average expression values of previously annotated (white) and novel (brick red) lincRNAs in human lymphocyte subsets and lymphoid or non-lymphoid human tissues. (d) Validation of TH1 signature lincRNAs expression by RT-qPCR on primary CD4+ naïve, TH1 and Treg cells sorted from PBMC of healthy donors (average of three independent experiments ± SEM). (e) RT-qPCR analysis of TH1 signature lincRNAs expression in a time course of CD4+ naïve T cells differentiated in TH1 and TH2 polarizing conditions presented as relative quantity (RQ) relative to time zero (average of two independent experiments).
Figure 4
Figure 4. Gene Ontology semantic similarity matrix “protein coding” genes proximal to lincRNA signatures
The semantic similarity scores for all GO term pairs were clustered using hierarchical clustering method. On the right of the matrix a bar plot of the adjusted p-values for each GO term is reported. Red bars represent GO terms that are significantly enriched in Gene Ontology analysis. Common ancestor is reported for each cluster.
Figure 5
Figure 5. Linc-MAF-4 contributes to TH1 cell differentiation
(a) Expression of linc-MAF-4 and MAF assessed at different time points by RT-qPCR in activated CD4+ naïve T cells differentiated in TH1 or TH2 polarizing conditions (average of four technical replicates ± SEM). See also Supplementary Fig. 4 b,c. (b) ChIP-qPCR analysis of H3K4me3 and RNA polymerase II occupancy at MAF locus in CD4+ naïve T cells differentiated in TH1 or TH2 polarizing conditions at day 8 post-activation. Enrichment is a percentage of input (average of at least 5 independent experiments ± SEM). One-tailed t-test *P < 0.05. (c) As in (b) at IFNG locus as control (average of at least 10 independent experiments ± SEM). One-tailed t-test *P < 0.05; **P < 0.01. (d) Linc-MAF-4 and MAF expression determined by RT-qPCR in activated CD4+ naïve T cells (in the absence of polarizing cytokines) and transfected at the same time with linc-MAF-4 siRNA (black) or ctrl siRNA (white). Transcripts expression was detected 72 h post transfection (average of six independent experiments ± SEM). One-tailed t-test **P < 0.01; *P < 0.05. (e) Results of GSEA (Gene Set Enrichment Analysis) performed on gene expression data obtained from siRNA mediated knock-down of linc-MAF-4 in activated CD4 naïve T cells. Activation and transfection conditions were as in (d). The red and blue line represent the observed enrichment score profile of genes in the linc-MAF-4 / ctrl siRNA treated cells compared to the CD4 TH1 and TH2 reference gene sets respectively (average of four independent experiments). Nominal P < 0.05. (f) GATA3 and IL4 transcript expression determined by RT-qPCR in activated CD4+ naïve T cells transfected with linc-MAF-4 siRNA (black) or ctrl siRNA (white) (average of six independent experiments ± SEM). One-tailed t-test ** P < 0.01; * P < 0.05.
Figure 6
Figure 6. Epigenetic characterization of linc-MAF4/MAF genomic locus
(a) Schematic representation of the genomic region analyzed by 3C. Position relative to linc-MAF-4 and MAF of three lincRNAs present in the region is shown in the upper part of the panel. The M1 primer at the 5′ end of MAF (red line) was used as bait. Primers (L1-L24) spanning the region between linc-MAF-4 and MAF were tested for interaction. Relative frequency of interaction between MAF and linc-MAF-4 5 ′ (L7) and 3 ′ (L12) ends is shown in CD4+ naïve T cells differentiated in TH1 polarizing conditions (day 8) (average of three independent experiments ± SEM). (b) Relative abundance of linc-MAF-4 transcript in cytoplasm, nucleus and chromatin in CD4+ naïve T cells differentiated in TH1 polarizing conditions (day 8). Linc-00339, MALAT1 and RNU2.1 were used respectively as cytoplasmic, nuclear and chromatin-associated controls (average of three independent experiments ± SEM). (c) RIP assay for LSD1 and EZH2 in CD4+ naïve T cells differentiated in TH1 polarizing conditions (day 8). Fold enrichment is relative to mock. ACTB, RNU2.1 and a region upstream the TSS of linc-MAF-4 were chosen as controls (average of six independent experiments ± SEM). The statistical significance was determined with ANOVA and Dunnet post-hoc test: *P < 0.05; **P < 0.01. (d) ChIP-qPCR analysis of EZH2, H3K27me3 and LSD1 occupancy at MAF locus in activated CD4+ naïve T cells transfected with linc-MAF-4 siRNA (black) or ctrl siRNA (white) (average of at least three independent experiments ± SEM). One-tailed t-test * P < 0.05. (e) Model for linc-MAF-4-mediated MAF repression in TH1 lymphocytes. When linc-MAF-4 is expressed, it recruits chromatin remodelers (i.e. LSD1 and EZH2) at MAF 5′-end, taking advantage of a DNA loop that brings linc-MAF-4 5′ and 3′ end in close proximity to MAF 5′ end.

Comment in

Similar articles

Cited by

References

    1. Zhu J, Yamane H, Paul WE. Differentiation of effector CD4 T cell populations (*) Annu Rev Immunol. 2010;28:445–89. - PMC - PubMed
    1. Zhou L, Chong MM, Littman DR. Plasticity of CD4+ T cell lineage differentiation. Immunity. 2009;30:646–55. - PubMed
    1. O’Shea JJ, Paul WE. Mechanisms underlying lineage commitment and plasticity of helper CD4+ T cells. Science. 2010;327:1098–102. - PMC - PubMed
    1. Kanno Y, Vahedi G, Hirahara K, Singleton K, O’Shea JJ. Transcriptional and epigenetic control of T helper cell specification: molecular mechanisms underlying commitment and plasticity. Annu Rev Immunol. 2012;30:707–31. - PMC - PubMed
    1. O’Connell RM, Rao DS, Chaudhuri AA, Baltimore D. Physiological and pathological roles for microRNAs in the immune system. Nat Rev Immunol. 2010;10:111–22. - PubMed

Publication types

MeSH terms

Substances